
CTS (CTS)
We’re skeptical of CTS. Its poor sales growth and falling returns on capital suggest its growth opportunities are shrinking.― StockStory Analyst Team
1. News


2. Summary
Why We Think CTS Will Underperform
With roots dating back to 1896 and a global manufacturing footprint, CTS (NYSE:CTS) designs and manufactures sensors, connectivity components, and actuators for aerospace, defense, industrial, medical, and transportation markets.
- Subscale operations are evident in its revenue base of $541.3 million, meaning it has fewer distribution channels than its larger rivals
- Anticipated sales growth of 4.5% for the next year implies demand will be shaky
- A positive is that its impressive free cash flow profitability enables the company to fund new investments or reward investors with share buybacks/dividends, and its recently improved profitability means it has even more resources to invest or distribute


CTS is skating on thin ice. We’re on the lookout for more interesting opportunities.
Why There Are Better Opportunities Than CTS


CTS’s stock price of $47.84 implies a valuation ratio of 20.2x forward P/E. This multiple is higher than most business services companies, and we think it’s quite expensive for the quality you get.
We’d rather invest in similarly-priced but higher-quality companies with more reliable earnings growth.
3. CTS (CTS) Research Report: Q4 CY2025 Update
Electronic components manufacturer CTS Corporation (NYSE:CTS) reported Q4 CY2025 results topping the market’s revenue expectations, with sales up 7.7% year on year to $137.3 million. The company’s full-year revenue guidance of $565 million at the midpoint came in 0.6% above analysts’ estimates. Its non-GAAP profit of $0.62 per share was 3.3% above analysts’ consensus estimates.
CTS (CTS) Q4 CY2025 Highlights:
- Revenue: $137.3 million vs analyst estimates of $135.9 million (7.7% year-on-year growth, 1% beat)
- Adjusted EPS: $0.62 vs analyst estimates of $0.60 (3.3% beat)
- Adjusted EBITDA: $32.6 million vs analyst estimates of $32.48 million (23.7% margin, in line)
- Adjusted EPS guidance for the upcoming financial year 2026 is $2.38 at the midpoint, missing analyst estimates by 1%
- Operating Margin: 16.5%, in line with the same quarter last year
- Free Cash Flow Margin: 18.9%, up from 15.6% in the same quarter last year
- Market Capitalization: $1.61 billion
Company Overview
With roots dating back to 1896 and a global manufacturing footprint, CTS (NYSE:CTS) designs and manufactures sensors, connectivity components, and actuators for aerospace, defense, industrial, medical, and transportation markets.
CTS organizes its product portfolio into three functional categories: Sense, Connect, and Move. The Sense category includes controls, pedals, piezo sensing products, sensors, switches, and transducers that provide vital inputs to electronic systems. Connect products, such as EMI/RFI filters, capacitors, frequency control products, resistors, and RF filters, enable systems to function in synchronization with other systems. Move products, including piezo microactuators and rotary actuators, ensure precise and accurate movement execution.
These components are critical building blocks in complex electronic systems manufactured by original equipment manufacturers (OEMs) and tier one suppliers. For example, a commercial aircraft might use CTS sensors to monitor engine temperature, while an automobile manufacturer might incorporate CTS pedals and actuators in vehicle control systems. The company's components can be found in everything from medical devices to defense systems.
CTS maintains a highly engineered approach to its business, with sales engineers working closely with major customers to design and develop application-specific products that meet precise requirements. This collaborative engineering process represents the majority of the company's business model, with approximately 91% of sales coming through its direct sales engineers.
The company operates manufacturing facilities across North America, Asia, and Europe, giving it global production capabilities to serve multinational customers. CTS supplements its direct sales with distribution partners like Avnet, Digi-Key Electronics, and TTI for smaller customers and standard products that require less design support.
CTS protects its innovations through an extensive intellectual property portfolio that includes approximately 285 patents worldwide. The company continues to invest in research and development to create new solutions, spending nearly $25 million on R&D in 2023 to maintain its competitive position in rapidly evolving electronic component markets.
4. Electronic Components & Manufacturing
The sector could see higher demand as the prevalence of advanced electronics increases in industries such as automotive, healthcare, aerospace, and computing. The high-performance components and contract manufacturing expertise required for autonomous vehicles and cloud computing datacenters, for instance, will benefit companies in the space. However, headwinds include geopolitical risks, particularly U.S.-China trade tensions that could disrupt component sourcing and production as the Trump administration takes an increasingly antagonizing stance on foreign relations. Additionally, stringent environmental regulations on e-waste and emissions could force the industry to pivot in potentially costly ways.
CTS competes with other electronic component manufacturers such as TE Connectivity (NYSE:TEL), Sensata Technologies (NYSE:ST), Amphenol Corporation (NYSE:APH), and Vishay Intertechnology (NYSE:VSH), along with divisions of larger industrial conglomerates.
5. Revenue Growth
A company’s long-term sales performance is one signal of its overall quality. Even a bad business can shine for one or two quarters, but a top-tier one grows for years.
With $541.3 million in revenue over the past 12 months, CTS is a small player in the business services space, which sometimes brings disadvantages compared to larger competitors benefiting from economies of scale and numerous distribution channels. On the bright side, it can grow faster because it has more room to expand.
As you can see below, CTS’s 5% annualized revenue growth over the last five years was decent. This shows its offerings generated slightly more demand than the average business services company, a useful starting point for our analysis.
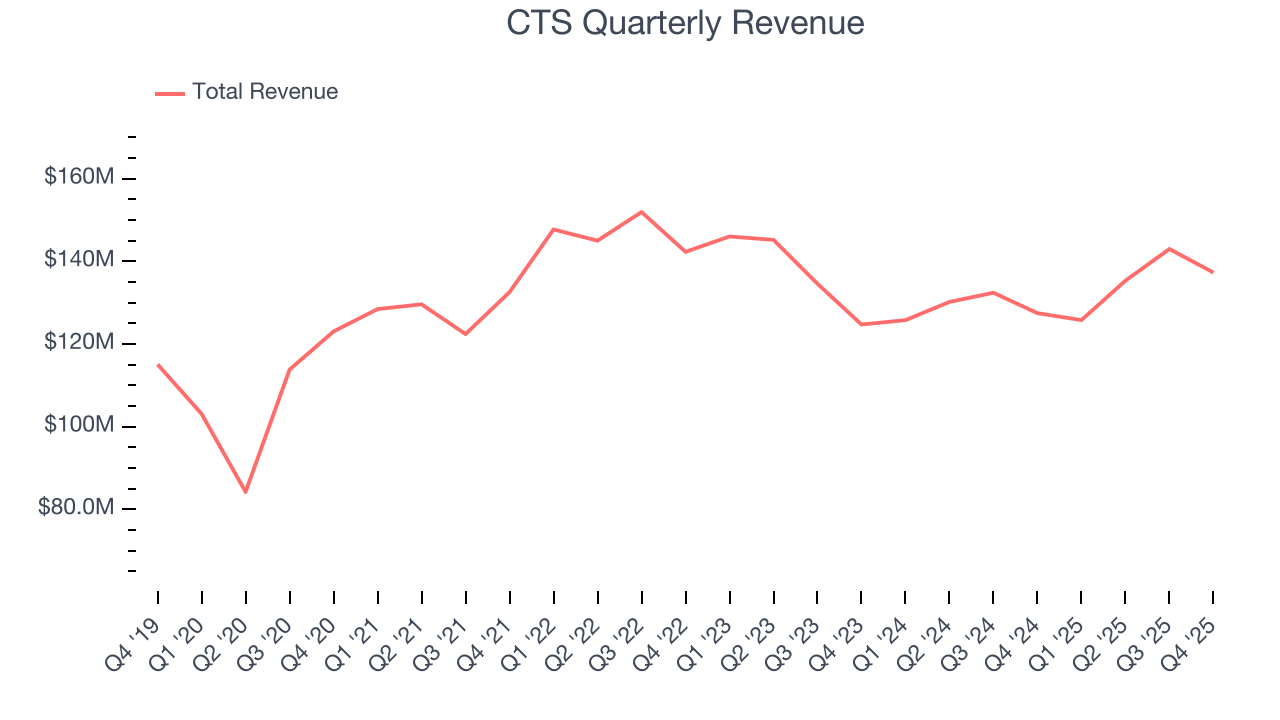
We at StockStory place the most emphasis on long-term growth, but within business services, a half-decade historical view may miss recent innovations or disruptive industry trends. CTS’s recent performance shows its demand has slowed as its revenue was flat over the last two years. 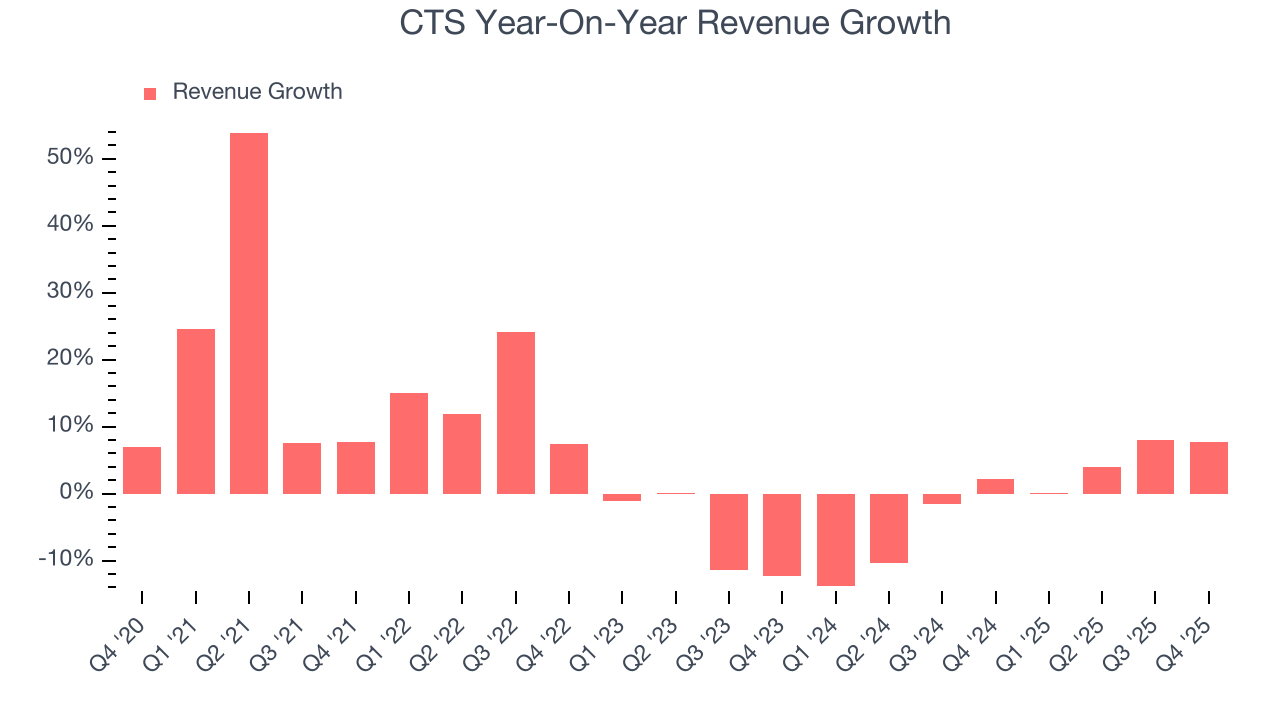
This quarter, CTS reported year-on-year revenue growth of 7.7%, and its $137.3 million of revenue exceeded Wall Street’s estimates by 1%.
Looking ahead, sell-side analysts expect revenue to grow 3.7% over the next 12 months. While this projection indicates its newer products and services will spur better top-line performance, it is still below average for the sector.
6. Operating Margin
Operating margin is a key measure of profitability. Think of it as net income - the bottom line - excluding the impact of taxes and interest on debt, which are less connected to business fundamentals.
CTS has been an efficient company over the last five years. It was one of the more profitable businesses in the business services sector, boasting an average operating margin of 15.3%.
Analyzing the trend in its profitability, CTS’s operating margin rose by 1.5 percentage points over the last five years, as its sales growth gave it operating leverage.
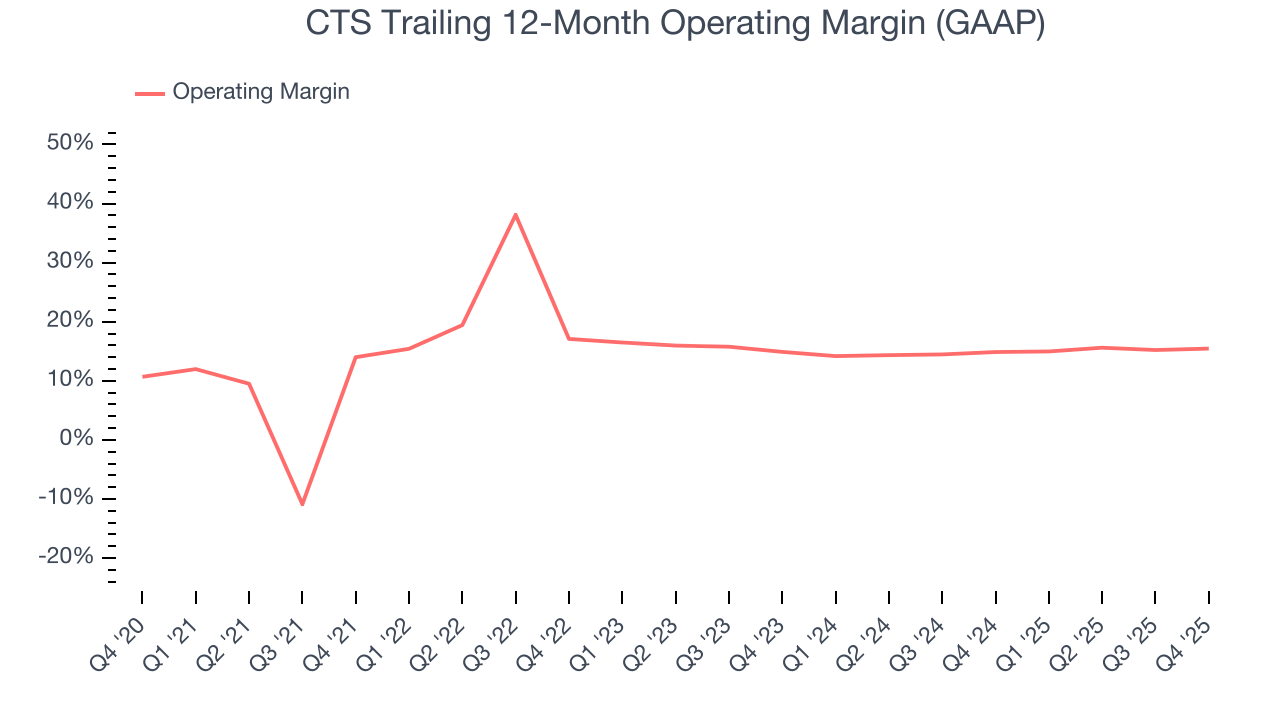
In Q4, CTS generated an operating margin profit margin of 16.5%, in line with the same quarter last year. This indicates the company’s overall cost structure has been relatively stable.
7. Earnings Per Share
We track the long-term change in earnings per share (EPS) for the same reason as long-term revenue growth. Compared to revenue, however, EPS highlights whether a company’s growth is profitable.
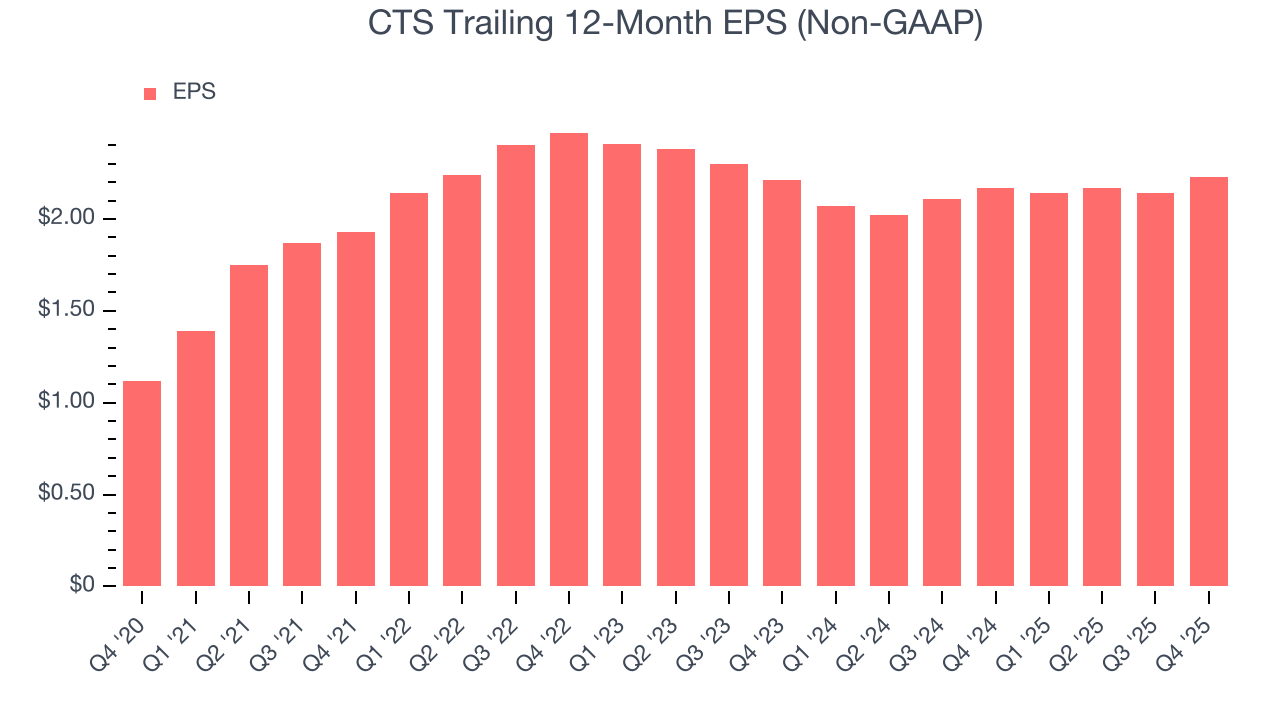
CTS’s EPS grew at a spectacular 14.8% compounded annual growth rate over the last five years, higher than its 5% annualized revenue growth. This tells us the company became more profitable on a per-share basis as it expanded.
We can take a deeper look into CTS’s earnings to better understand the drivers of its performance. As we mentioned earlier, CTS’s operating margin was flat this quarter but expanded by 1.5 percentage points over the last five years. On top of that, its share count shrank by 10.2%. These are positive signs for shareholders because improving profitability and share buybacks turbocharge EPS growth relative to revenue growth. 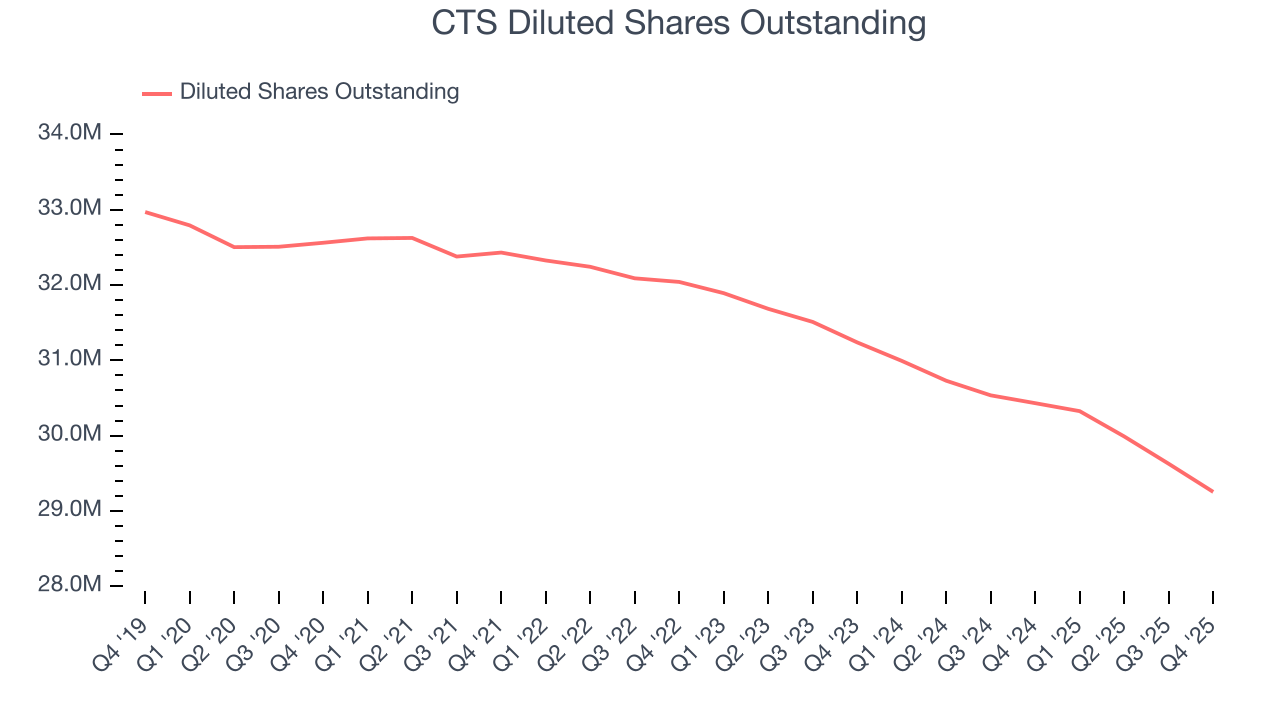
Like with revenue, we analyze EPS over a shorter period to see if we are missing a change in the business.
For CTS, EPS didn’t budge over the last two years, a regression from its five-year trend. We hope it can revert to earnings growth in the coming years.
In Q4, CTS reported adjusted EPS of $0.62, up from $0.53 in the same quarter last year. This print beat analysts’ estimates by 3.3%. Over the next 12 months, Wall Street expects CTS’s full-year EPS of $2.23 to grow 8.1%.
8. Cash Is King
Although earnings are undoubtedly valuable for assessing company performance, we believe cash is king because you can’t use accounting profits to pay the bills.
CTS has shown terrific cash profitability, enabling it to reinvest, return capital to investors, and stay ahead of the competition while maintaining an ample cushion. The company’s free cash flow margin was among the best in the business services sector, averaging 15.5% over the last five years.
Taking a step back, we can see that CTS’s margin expanded by 2.2 percentage points during that time. This is encouraging because it gives the company more optionality.
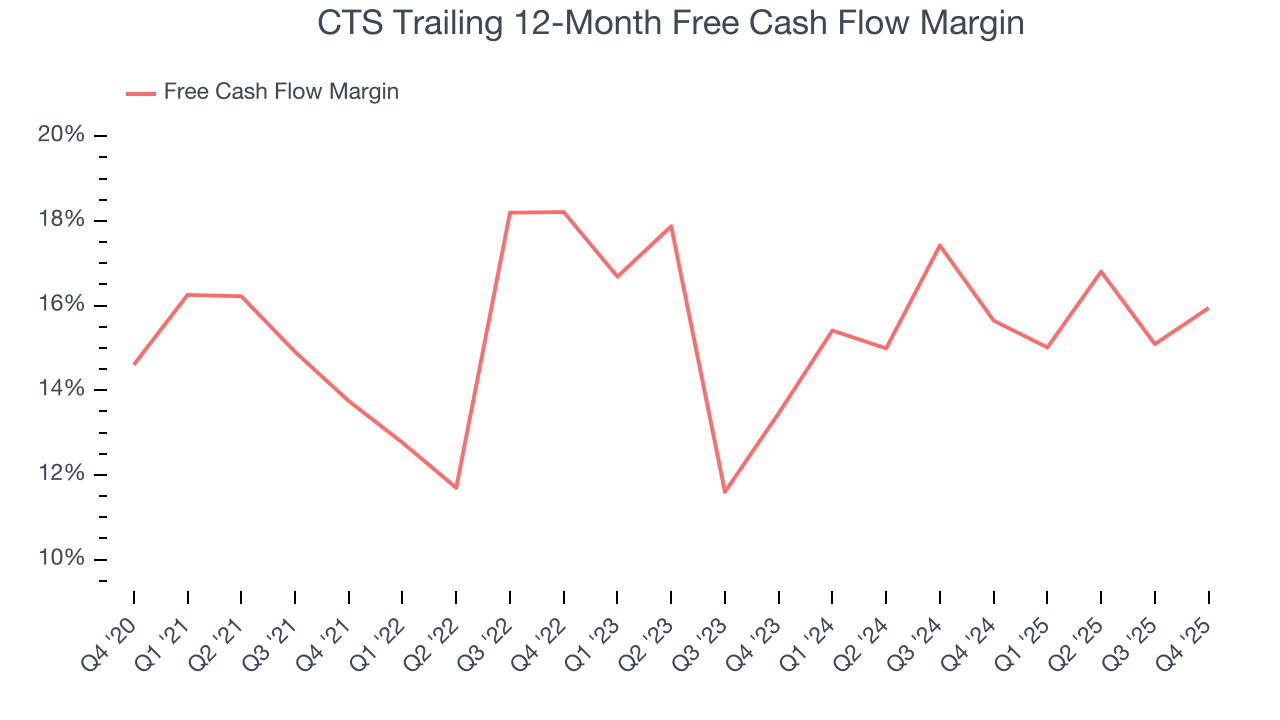
CTS’s free cash flow clocked in at $26 million in Q4, equivalent to a 18.9% margin. This result was good as its margin was 3.3 percentage points higher than in the same quarter last year, building on its favorable historical trend.
9. Return on Invested Capital (ROIC)
EPS and free cash flow tell us whether a company was profitable while growing its revenue. But was it capital-efficient? Enter ROIC, a metric showing how much operating profit a company generates relative to the money it has raised (debt and equity).
Although CTS hasn’t been the highest-quality company lately, it historically found a few growth initiatives that worked. Its five-year average ROIC was 15.7%, higher than most business services businesses.
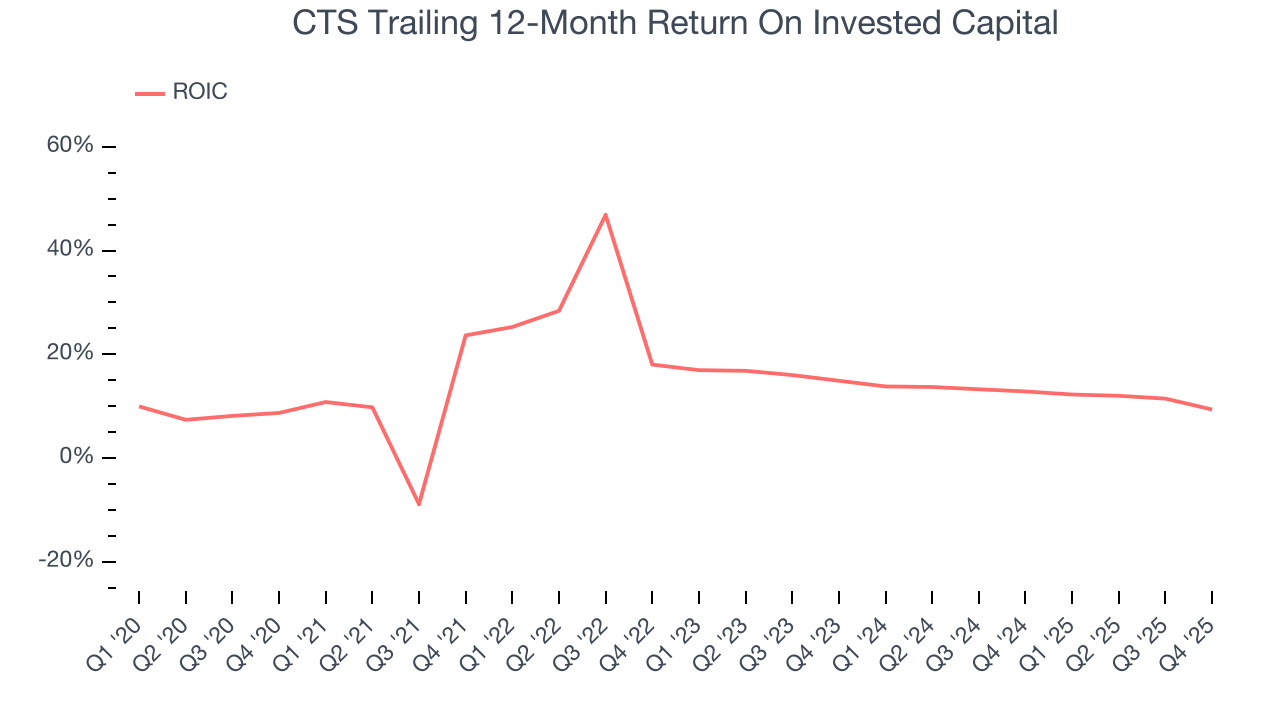
We like to invest in businesses with high returns, but the trend in a company’s ROIC is what often surprises the market and moves the stock price. Unfortunately, CTS’s ROIC has decreased over the last few years. We like what management has done in the past, but its declining returns are perhaps a symptom of fewer profitable growth opportunities.
10. Balance Sheet Assessment
CTS reported $82.3 million of cash and $100.1 million of debt on its balance sheet in the most recent quarter. As investors in high-quality companies, we primarily focus on two things: 1) that a company’s debt level isn’t too high and 2) that its interest payments are not excessively burdening the business.
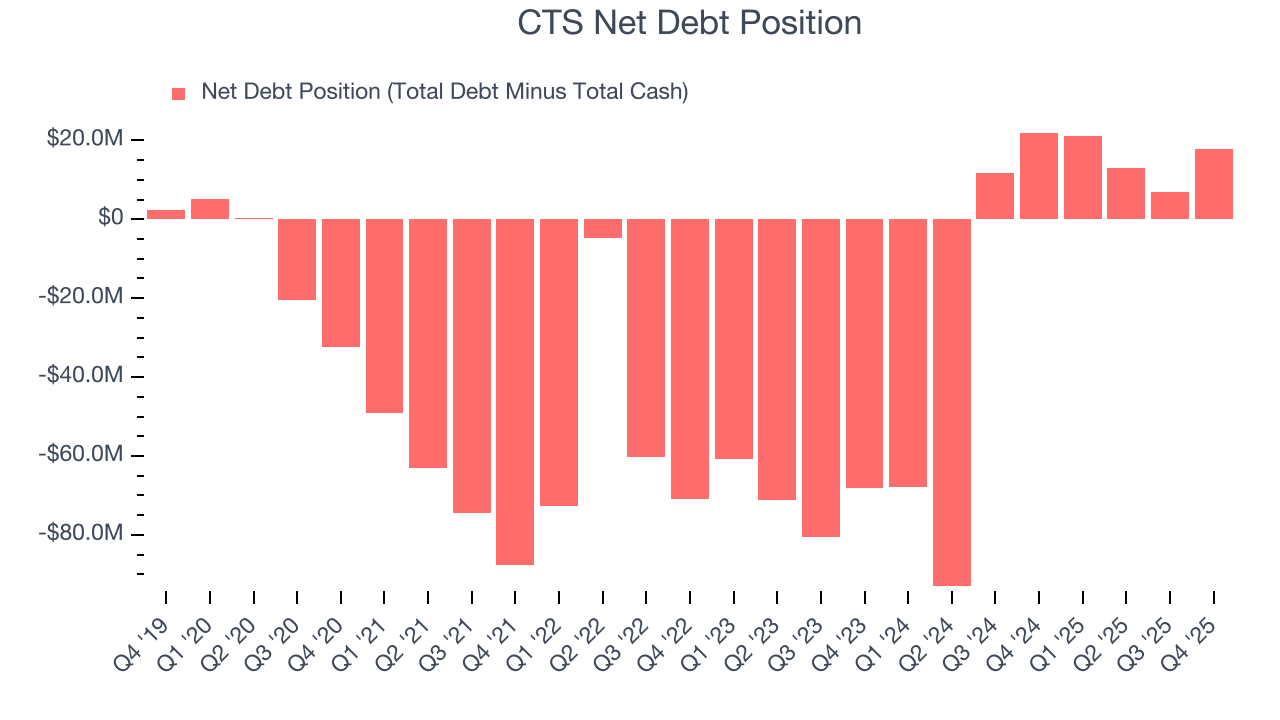
With $123.6 million of EBITDA over the last 12 months, we view CTS’s 0.1× net-debt-to-EBITDA ratio as safe. We also see its $1.41 million of annual interest expenses as appropriate. The company’s profits give it plenty of breathing room, allowing it to continue investing in growth initiatives.
11. Key Takeaways from CTS’s Q4 Results
It was good to see CTS beat analysts’ EPS expectations this quarter. We were also happy its revenue narrowly outperformed Wall Street’s estimates. On the other hand, its full-year EPS guidance slightly missed. Zooming out, we think this was a mixed quarter. The stock remained flat at $55.58 immediately after reporting.
12. Is Now The Time To Buy CTS?
Updated: March 27, 2026 at 11:42 PM EDT
We think that the latest earnings result is only one piece of the bigger puzzle. If you’re deciding whether to own CTS, you should also grasp the company’s longer-term business quality and valuation.
CTS’s business quality ultimately falls short of our standards. Although its revenue growth was decent over the last five years and Wall Street believes it will continue to grow, its diminishing returns show management's prior bets haven't worked out. And while the company’s powerful free cash flow generation enables it to stay ahead of the competition through consistent reinvestment of profits, the downside is its subscale operations give it fewer distribution channels than its larger rivals.
CTS’s P/E ratio based on the next 12 months is 20.2x. At this valuation, there’s a lot of good news priced in - we think there are better stocks to buy right now.
Wall Street analysts have a consensus one-year price target of $54 on the company (compared to the current share price of $47.84).