
Everest Group (EG)
Everest Group doesn’t excite us. Its decelerating revenue growth and even worse EPS performance give us little confidence it can beat the market.― StockStory Analyst Team
1. News


2. Summary
Why We Think Everest Group Will Underperform
Rebranded from Everest Re in 2023 to reflect its evolution beyond just reinsurance, Everest Group (NYSE:EG) underwrites property and casualty reinsurance and insurance worldwide, serving insurance companies, corporations, and other clients across six continents.
- Forecasted revenue decline of 2.5% for the upcoming 12 months implies demand will fall off a cliff
- Incremental sales over the last five years were less profitable as its 2% annual earnings per share growth lagged its revenue gains
- On the plus side, its market share has increased this cycle as its 14.4% annual revenue growth over the last five years was exceptional


Everest Group’s quality is inadequate. There are more profitable opportunities elsewhere.
Why There Are Better Opportunities Than Everest Group


Everest Group is trading at $329.83 per share, or 0.9x forward P/B. This multiple is lower than most insurance companies, but for good reason.
It’s better to pay up for high-quality businesses with higher long-term earnings potential rather than to buy lower-quality stocks because they appear cheap. These challenged businesses often don’t re-rate, a phenomenon known as a “value trap”.
3. Everest Group (EG) Research Report: Q4 CY2025 Update
Global reinsurance company Everest Group (NYSE:EG) missed Wall Street’s revenue expectations in Q4 CY2025, with sales falling 4.6% year on year to $4.42 billion. Its non-GAAP profit of $13.26 per share was 4.1% below analysts’ consensus estimates.
Everest Group (EG) Q4 CY2025 Highlights:
- Net Premiums Earned: $3.86 billion vs analyst estimates of $3.90 billion (1.6% year-on-year decline, 1.1% miss)
- Revenue: $4.42 billion vs analyst estimates of $4.50 billion (4.6% year-on-year decline, 1.6% miss)
- Combined Ratio: 98.4% vs analyst estimates of 95.4% (300 basis point miss)
- Adjusted EPS: $13.26 vs analyst expectations of $13.83 (4.1% miss)
- Book Value per Share: $379.83 vs analyst estimates of $381.87 (17.7% year-on-year growth, 0.5% miss)
- Market Capitalization: $13.85 billion
Company Overview
Rebranded from Everest Re in 2023 to reflect its evolution beyond just reinsurance, Everest Group (NYSE:EG) underwrites property and casualty reinsurance and insurance worldwide, serving insurance companies, corporations, and other clients across six continents.
Everest operates through two main segments: Reinsurance and Insurance. The Reinsurance segment works with other insurance companies, taking on portions of their risk in exchange for premiums. This includes property coverage for natural disasters like hurricanes and earthquakes, casualty protection for liability claims, and specialty lines such as political risk and credit insurance. Reinsurance helps client insurers reduce their net liability, obtain catastrophe protection, and increase their underwriting capacity.
The Insurance segment provides direct coverage to businesses worldwide, offering specialized products including accident and health policies, specialty casualty coverage, professional liability protection, property insurance, and workers' compensation. The company distributes its products through brokers, surplus lines, and general agents.
For example, a regional insurance company might purchase catastrophe reinsurance from Everest to protect against major hurricane losses, allowing it to write more policies than its capital would otherwise permit. Similarly, a multinational corporation might obtain professional liability coverage directly from Everest's Insurance segment to protect against potential lawsuits.
Everest generates revenue by collecting premiums for the risks it assumes, managing those risks through careful underwriting, and investing the premium funds until claims need to be paid. The company maintains operations across six continents with offices in key markets including the United States, Bermuda, Canada, Singapore, and various European countries.
4. Reinsurance
This is a cyclical industry, and the sector benefits when there is 'hard market', characterized by strong premium rate increases that outpace loss and cost inflation, resulting in robust underwriting margins. The opposite is true in a 'soft market'. Interest rates also matter, as they determine the yields earned on fixed-income portfolios. The primary headwind remains the immense and concentrated exposure to large-scale catastrophe losses, as the growing impact of climate change challenges traditional risk models and creates significant earnings volatility. Additionally, they face the risk of adverse prior-year reserve development, where claims prove more costly than anticipated, while the eventual influx of new capital from alternative sources threatens to soften the market and compress future returns.
Everest Group's main competitors include other major global reinsurers such as Munich Re, Swiss Re, and Hannover Re, as well as large insurance and reinsurance companies like Berkshire Hathaway (NYSE:BRK.A, BRK.B), Chubb Limited (NYSE:CB), and AXA (OTCQX:AXAHY).
5. Revenue Growth
Insurance companies earn revenue from three primary sources: 1) The core insurance business itself, often called underwriting and represented in the income statement as premiums 2) Income from investing the “float” (premiums collected upfront not yet paid out as claims) in assets such as fixed-income assets and equities 3) Fees from various sources such as policy administration, annuities, or other value-added services. Over the last five years, Everest Group grew its revenue at an excellent 12.8% compounded annual growth rate. Its growth beat the average insurance company and shows its offerings resonate with customers.
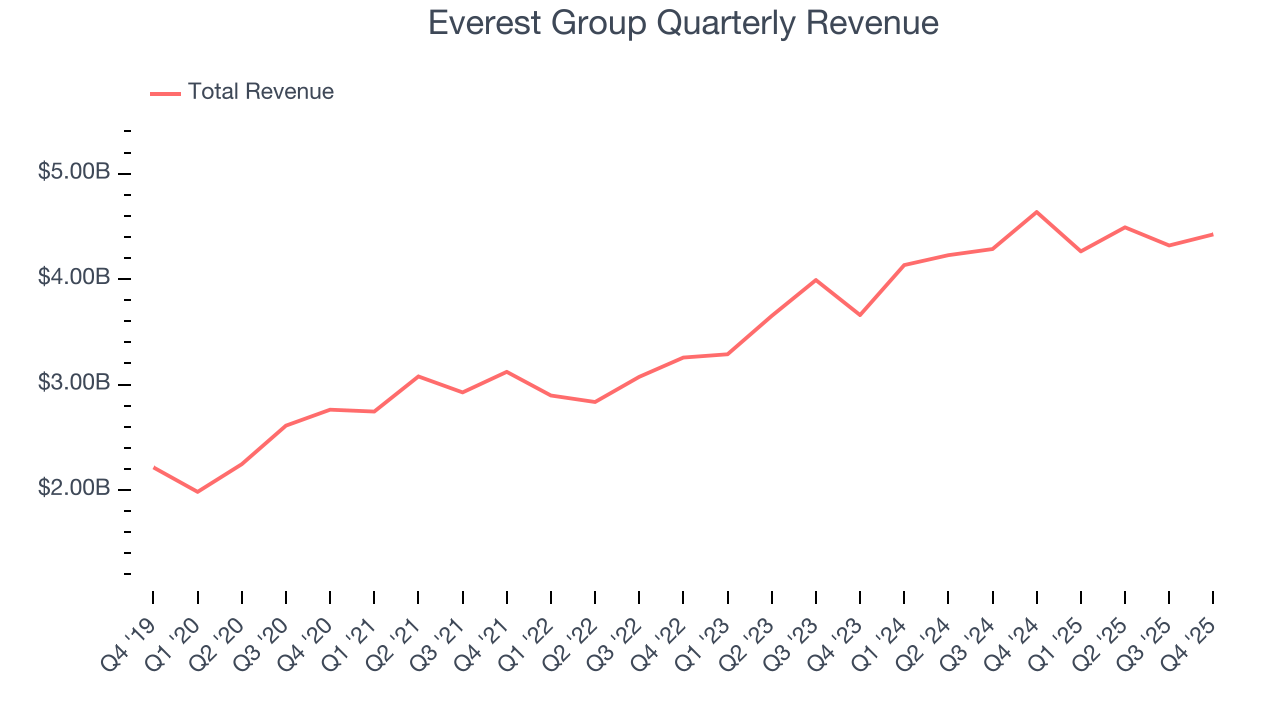
Long-term growth is the most important, but within financials, a half-decade historical view may miss recent interest rate changes and market returns. Everest Group’s annualized revenue growth of 9.5% over the last two years is below its five-year trend, but we still think the results suggest healthy demand. 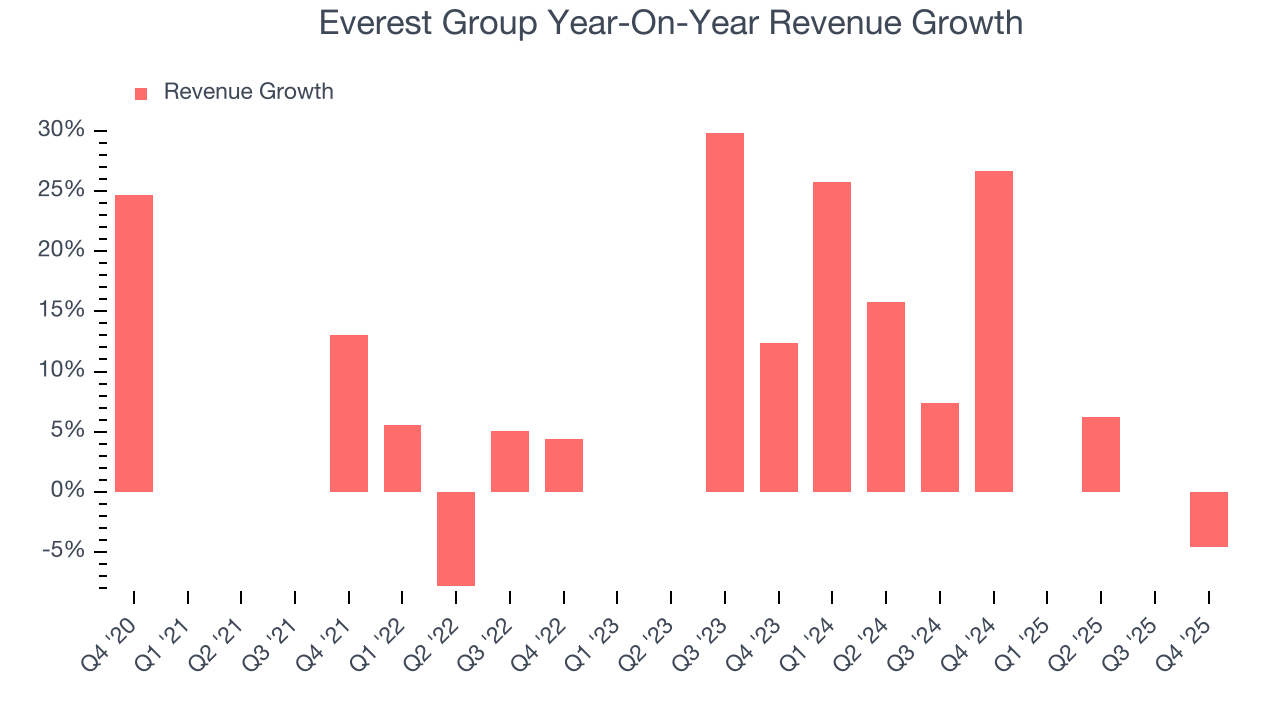 Note: Quarters not shown were determined to be outliers, impacted by outsized investment gains/losses that are not indicative of the recurring fundamentals of the business.
This quarter, Everest Group missed Wall Street’s estimates and reported a rather uninspiring 4.6% year-on-year revenue decline, generating $4.42 billion of revenue.
Net premiums earned made up 90.6% of the company’s total revenue during the last five years, meaning Everest Group lives and dies by its underwriting activities because non-insurance operations barely move the needle.
Our experience and research show the market cares primarily about an insurer’s net premiums earned growth as investment and fee income are considered more susceptible to market volatility and economic cycles.
6. Net Premiums Earned
Net premiums earned are net of what’s paid to reinsurers (insurance for insurance companies), which are used by insurers to protect themselves from large losses.
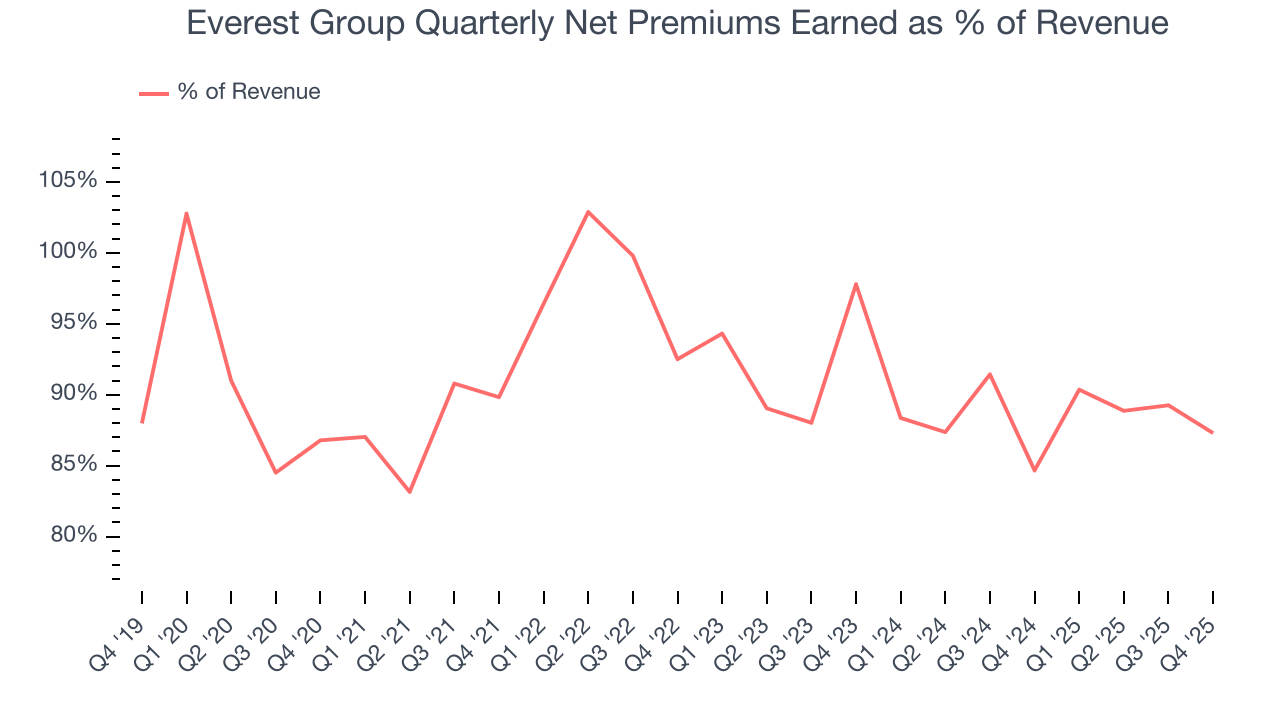
Everest Group’s net premiums earned has grown at a 12.4% annualized rate over the last five years, better than the broader insurance industry and in line with its total revenue.
When analyzing Everest Group’s net premiums earned over the last two years, we can see that growth decelerated to 7.6% annually. Since two-year net premiums earned grew slower than total revenue over this period, it’s implied that other line items such as investment income grew at a faster rate. While these additional streams certainly contribute to the bottom line, their impact can vary. Some firms have shown greater success and long-term consistency in investing their float compared to peers. However, sharp fluctuations in the fixed income and equity markets can significantly affect short-term performance.
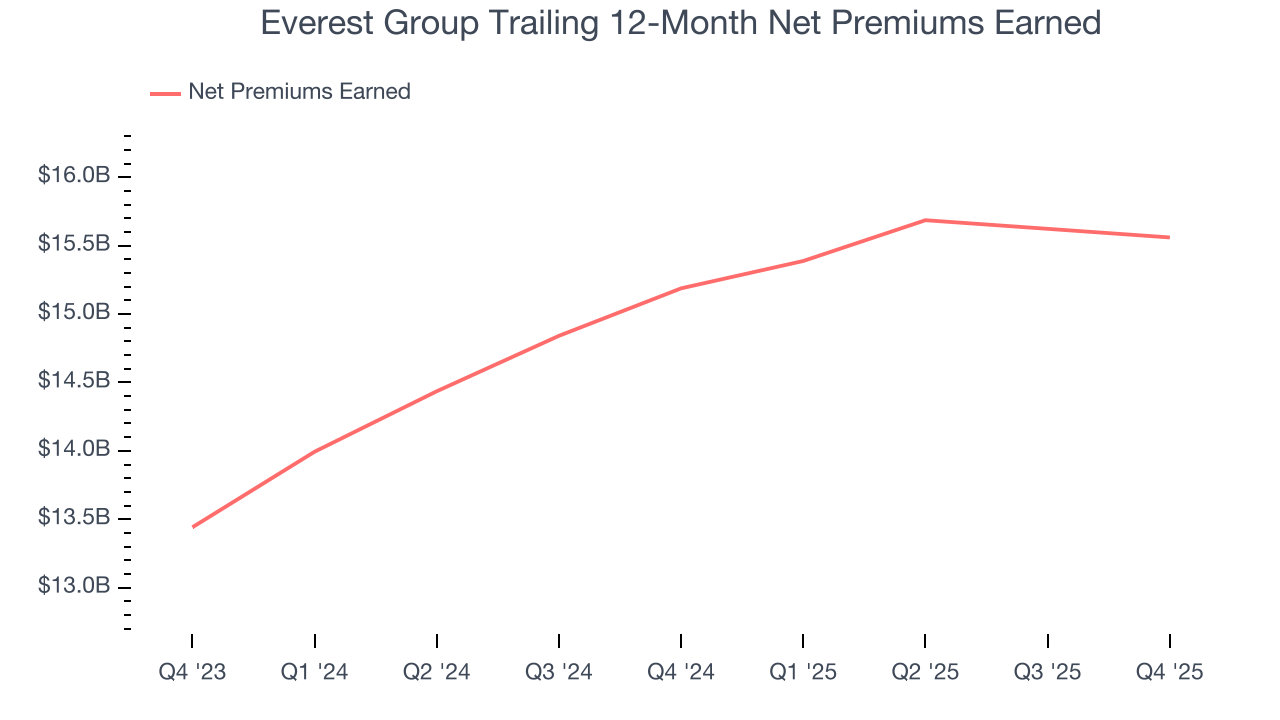
This quarter, Everest Group’s net premiums earned was $3.86 billion, down 1.6% year on year and short of Wall Street Consensus estimates.
7. Combined Ratio
Revenue growth is one major determinant of business quality, and the efficiency of operations is another. For insurance companies, we look at the combined ratio rather than the operating expenses and margins that define sectors such as consumer, tech, and industrials.
Combined ratio sums operating costs (salaries, commissions, overhead) with what is paid out in claims (losses) and divides this by net premiums earned. Combined ratios under 100% means profits while ones over 100% mean losses on its core operations of selling insurance policies.
Given the calculation, a lower expense ratio is better. Over the last five years, Everest Group’s combined ratio has swelled by 3.9 percentage points, going from 97.8% to 98.7%. However, the company gave back some of its expense savings as its combined ratio worsened by 7.9 percentage points on a two-year basis.
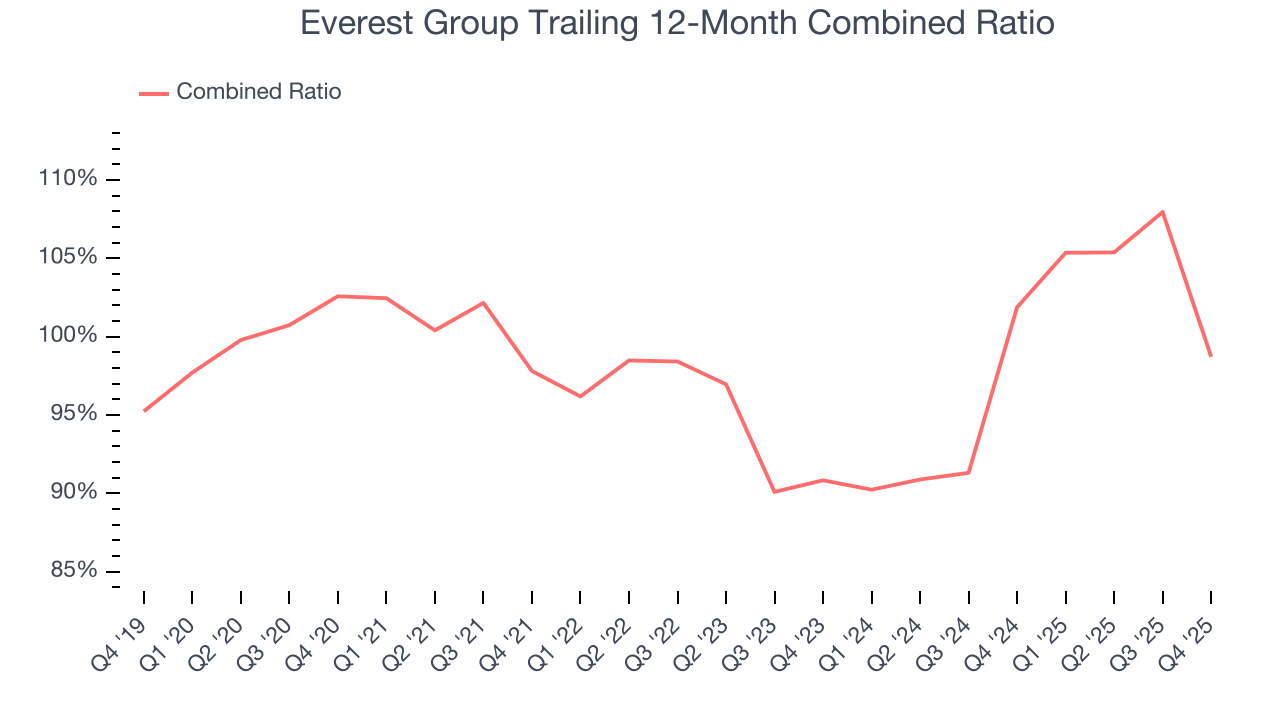
Everest Group’s combined ratio came in at 98.4% this quarter, falling short of analysts’ expectations by 300 basis points (100 basis points = 1 percentage point). This result was 36.9 percentage points better than the same quarter last year.
8. Earnings Per Share
We track the long-term change in earnings per share (EPS) for the same reason as long-term revenue growth. Compared to revenue, however, EPS highlights whether a company’s growth is profitable.
Everest Group’s EPS grew at an astounding 43.2% compounded annual growth rate over the last five years, higher than its 12.8% annualized revenue growth. However, we take this with a grain of salt because its combined ratio didn’t improve and it didn’t repurchase its shares, meaning the delta came from factors we consider non-core or less sustainable over the long term.
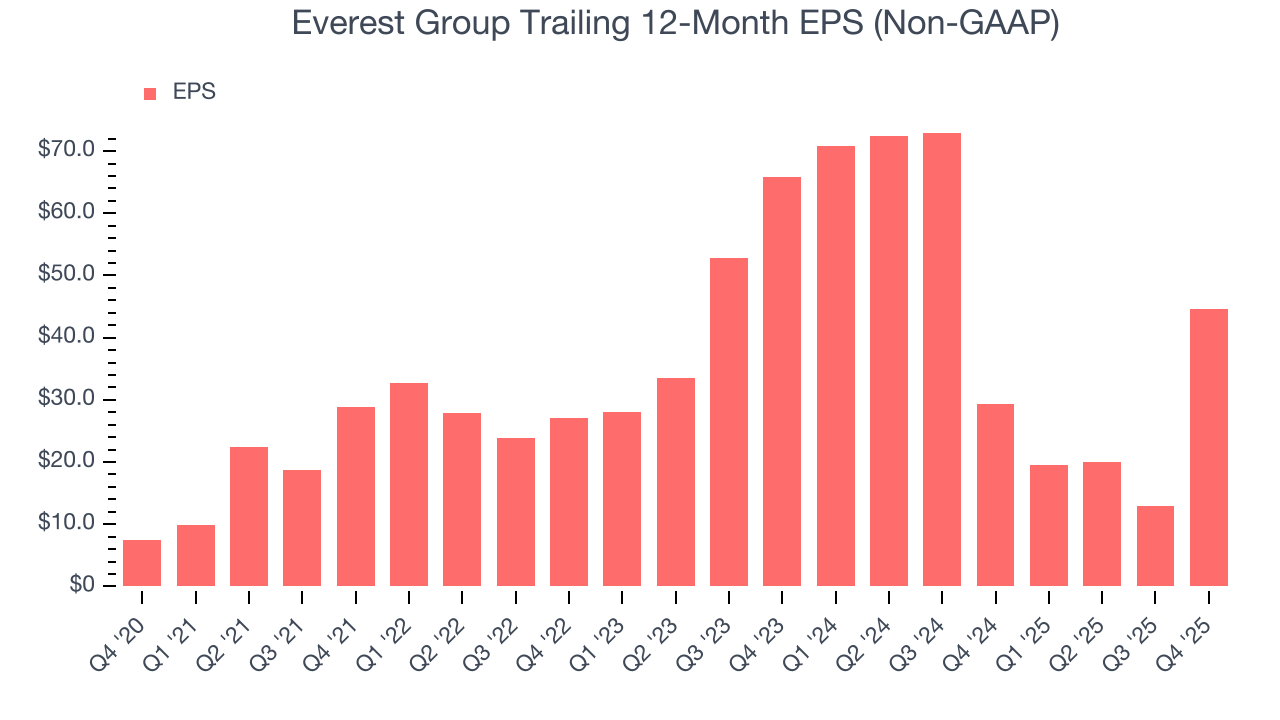
Like with revenue, we analyze EPS over a shorter period to see if we are missing a change in the business.
For Everest Group, its two-year annual EPS declines of 17.7% mark a reversal from its (seemingly) healthy five-year trend. We hope Everest Group can return to earnings growth in the future.
In Q4, Everest Group reported adjusted EPS of $13.26, up from negative $18.39 in the same quarter last year. Despite growing year on year, this print missed analysts’ estimates, but we care more about long-term adjusted EPS growth than short-term movements. Over the next 12 months, Wall Street expects Everest Group’s full-year EPS of $44.61 to grow 24.5%.
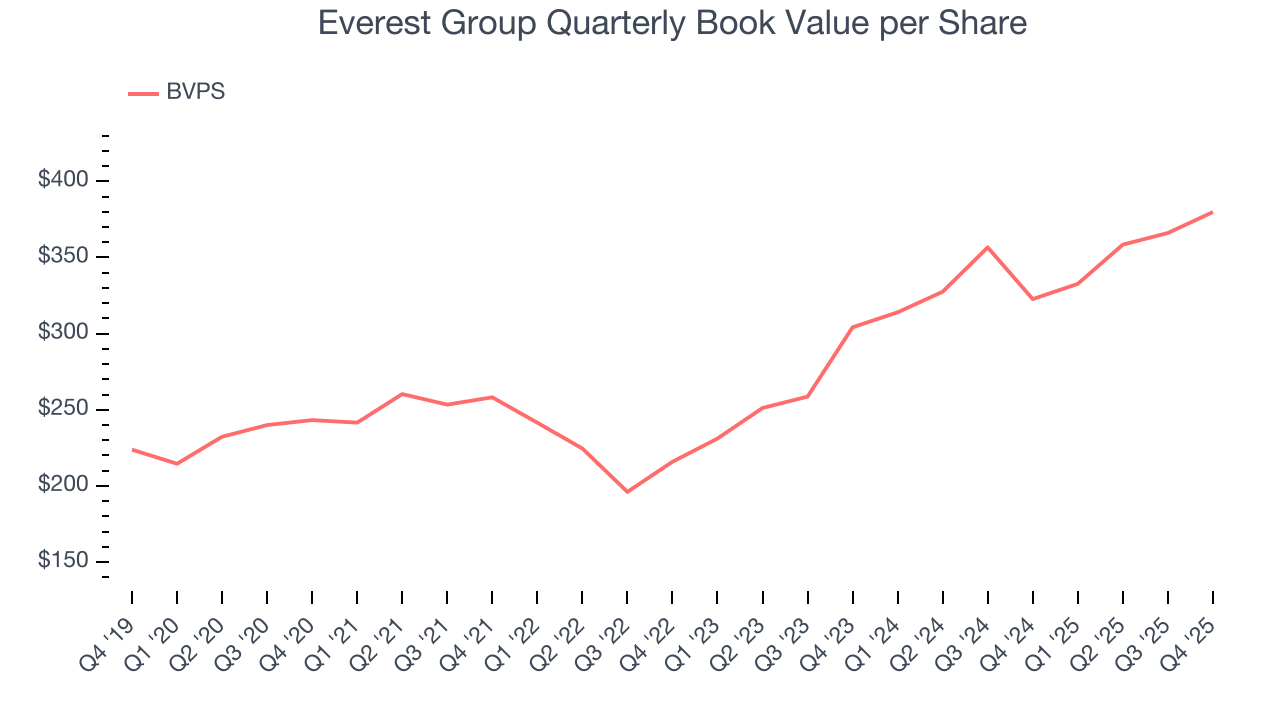
9. Book Value Per Share (BVPS)
Insurers are balance sheet businesses, collecting premiums upfront and paying out claims over time. Premiums collected but not yet paid out, often referred to as the float, are invested and create an asset base supported by a liability structure. Book value per share (BVPS) captures this dynamic by measuring these assets (investment portfolio, cash, reinsurance recoverables) less liabilities (claim reserves, debt, future policy benefits). BVPS is essentially the residual value for shareholders.
We therefore consider BVPS very important to track for insurers and a metric that sheds light on business quality because it reflects long-term capital growth and is harder to manipulate than more commonly-used metrics like EPS.
Everest Group’s BVPS grew at a solid 9.3% annual clip over the last five years. BVPS growth has also accelerated recently, growing by 11.7% annually over the last two years from $304.19 to $379.83 per share.
10. Balance Sheet Assessment
The debt-to-equity ratio is a widely used measure to assess a company's balance sheet health. A higher ratio means that a business aggressively financed its growth with debt. This can result in higher earnings (if the borrowed funds are invested profitably) but also increases risk.
If debt levels are too high, there could be difficulties in meeting obligations, especially during economic downturns or periods of rising interest rates if the debt has variable-rate payments.
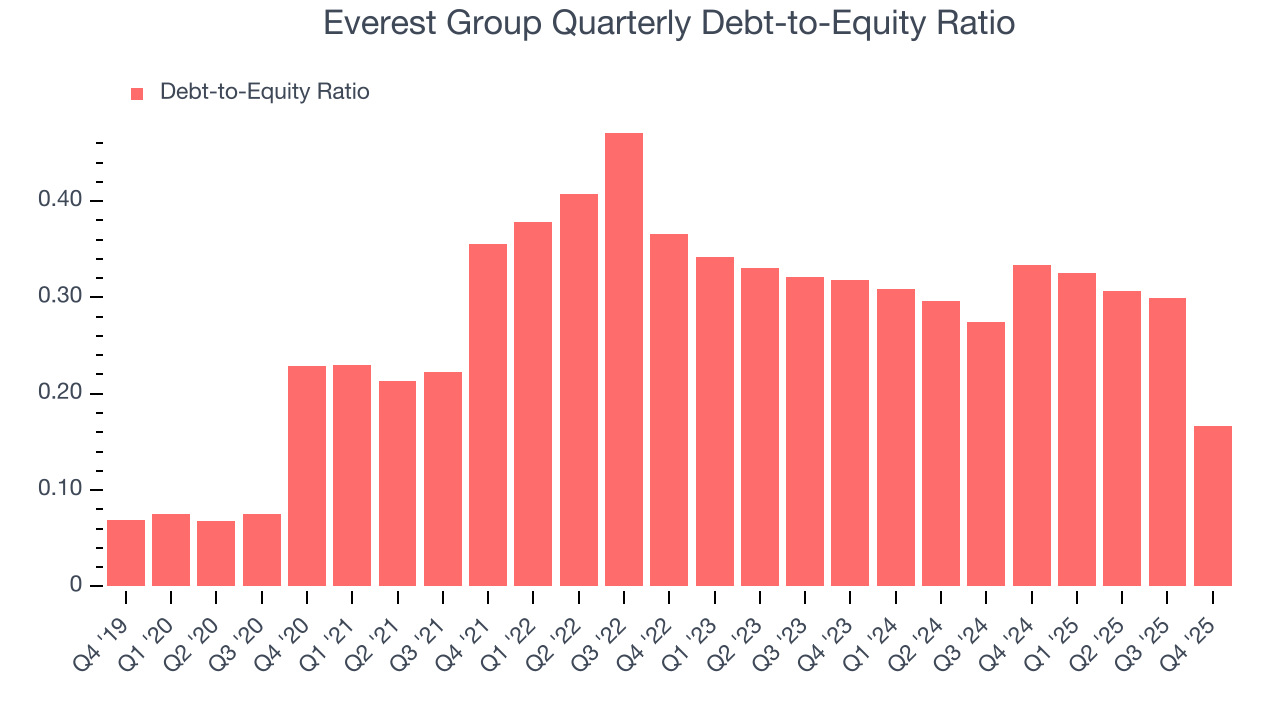
Everest Group currently has $2.57 billion of debt and $15.46 billion of shareholder's equity on its balance sheet, and over the past four quarters, has averaged a debt-to-equity ratio of 0.3×. We think this is safe and raises no red flags. In general, we’re comfortable with any ratio below 1.0× for an insurance business. Anything below 0.5× is a bonus.
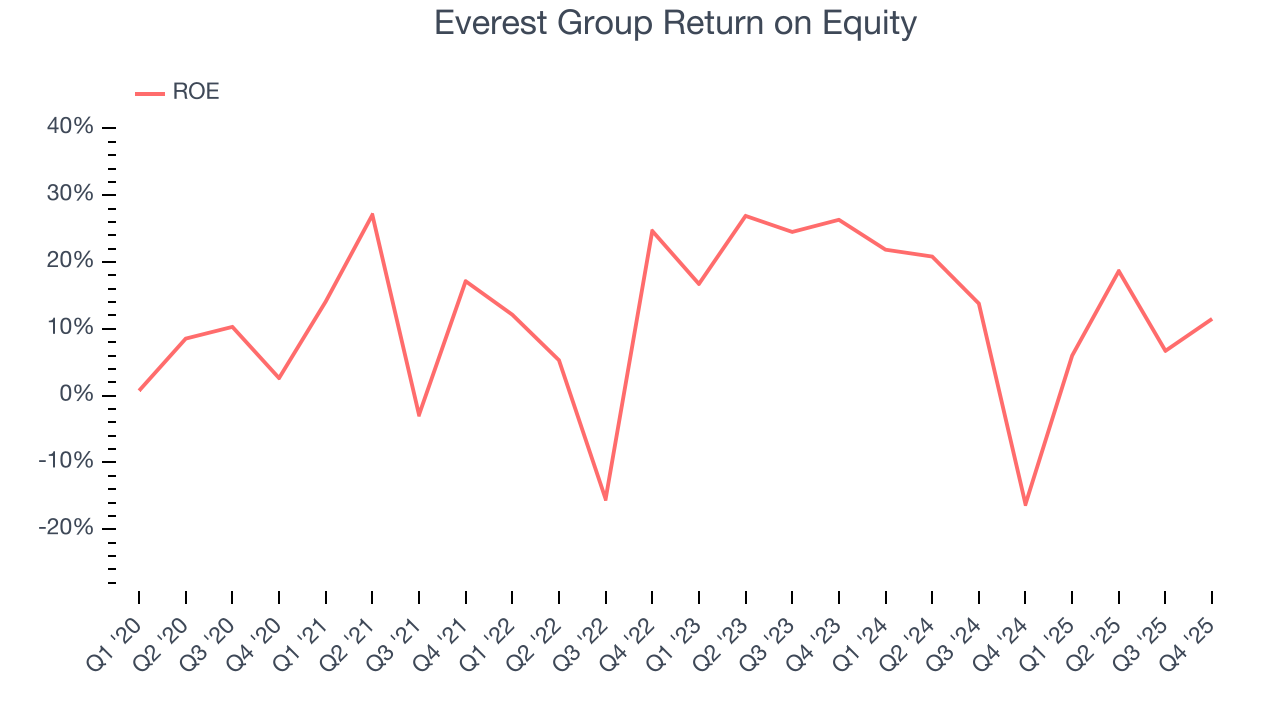
11. Return on Equity
Return on Equity, or ROE, ties everything together and is a vital metric. It tells us how much profit the insurer generates for each dollar of shareholder equity entrusted to management. Over a long period, insurers with higher ROEs tend to compound shareholder wealth faster through retained earnings, buybacks, and dividends.
Over the last five years, Everest Group has averaged an ROE of 13%, respectable for a company operating in a sector where the average shakes out around 12.5% and those putting up 20%+ are greatly admired.
12. Key Takeaways from Everest Group’s Q4 Results
We struggled to find many positives in these results. Its EPS missed and its revenue fell short of Wall Street’s estimates. Overall, this was a weaker quarter. The stock traded down 1.7% to $327.73 immediately following the results.
13. Is Now The Time To Buy Everest Group?
Updated: February 4, 2026 at 4:35 PM EST
A common mistake we notice when investors are deciding whether to buy a stock or not is that they simply look at the latest earnings results. Business quality and valuation matter more, so we urge you to understand these dynamics as well.
Everest Group isn’t a bad business, but we have other favorites. To kick things off, its revenue growth was impressive over the last five years. On top of that, Everest Group’s astounding EPS growth over the last five years shows its profits are trickling down to shareholders, and its projected EPS for the next year implies the company will continue generating shareholder value.
Everest Group’s P/B ratio based on the next 12 months is 0.8x. This valuation is reasonable, but the company’s shakier fundamentals present too much downside risk. We're pretty confident there are superior stocks to buy right now.
Wall Street analysts have a consensus one-year price target of $367.43 on the company (compared to the current share price of $327.73).