EnerSys (ENS)
EnerSys doesn’t excite us. Its underwhelming revenue growth and failure to generate meaningful free cash flow is a concerning trend.― StockStory Analyst Team
1. News
2. Summary
Why EnerSys Is Not Exciting
Supplying batteries that power equipment as big as mining rigs, EnerSys (NYSE:ENS) manufactures various kinds of batteries for a range of industries.
- Estimated sales growth of 1.9% for the next 12 months is soft and implies weaker demand
- Annual revenue growth of 4.9% over the last five years was below our standards for the industrials sector
- On the bright side, its performance over the past five years shows its incremental sales were extremely profitable, as its annual earnings per share growth of 19.3% outpaced its revenue gains


EnerSys’s quality is lacking. We see more attractive opportunities in the market.
Why There Are Better Opportunities Than EnerSys


EnerSys’s stock price of $169.79 implies a valuation ratio of 16.7x forward P/E. Yes, this valuation multiple is lower than that of other industrials peers, but we’ll remind you that you often get what you pay for.
Our advice is to pay up for elite businesses whose advantages are tailwinds to earnings growth. Don’t get sucked into lower-quality businesses just because they seem like bargains. These mediocre businesses often never achieve a higher multiple as hoped, a phenomenon known as a “value trap”.
3. EnerSys (ENS) Research Report: Q4 CY2025 Update
Battery manufacturer EnerSys (NYSE:ENS) missed Wall Street’s revenue expectations in Q4 CY2025 as sales only rose 1.4% year on year to $919.1 million. On the other hand, the company expects next quarter’s revenue to be around $980 million, close to analysts’ estimates. Its non-GAAP profit of $2.77 per share was 1.8% above analysts’ consensus estimates.
EnerSys (ENS) Q4 CY2025 Highlights:
- Revenue: $919.1 million vs analyst estimates of $932 million (1.4% year-on-year growth, 1.4% miss)
- Adjusted EPS: $2.77 vs analyst estimates of $2.72 (1.8% beat)
- Adjusted EBITDA: $159.7 million vs analyst estimates of $147.2 million (17.4% margin, 8.5% beat)
- Revenue Guidance for Q1 CY2026 is $980 million at the midpoint, roughly in line with what analysts were expecting
- Adjusted EPS guidance for Q1 CY2026 is $3 at the midpoint, above analyst estimates of $2.92
- Operating Margin: 13.5%, down from 15.7% in the same quarter last year
- Free Cash Flow was -$13.12 million, down from $56.79 million in the same quarter last year
- Sales Volumes fell 4% year on year (2% in the same quarter last year)
- Market Capitalization: $7.01 billion
Company Overview
Supplying batteries that power equipment as big as mining rigs, EnerSys (NYSE:ENS) manufactures various kinds of batteries for a range of industries.
Its products include reserve power batteries, which are used for backup power applications in telecommunications systems and emergency power uses, and industrial batteries used to power heavy industrial machinery like electric forklifts and mining equipment.
It also supplies various types of connectors, cables, and especially, racks and enclosures, which are used to store and protect telecommunications and electrical equipment in outdoor environments. Other types of batteries and power management equipment make up the rest of EnerSys’s product offerings.
EnerSys generates revenue mainly through the sale of these products to companies in the industrial, telecommunications, and utilities sectors along with government and military organizations. EnerSys sells through multiple channels, including a global direct sales team and a network of distributors and dealers.
4. Renewable Energy
Renewable energy companies are buoyed by the secular trend of green energy that is upending traditional power generation. Those who innovate and evolve with this dynamic market can win share while those who continue to rely on legacy technologies can see diminishing demand, which includes headwinds from increasing regulation against “dirty” energy. Additionally, these companies are at the whim of economic cycles, as interest rates can impact the willingness to invest in renewable energy projects.
Top competitors of EnerSys include Japanese company GS Yuasa (TSE:6674), and private companies East Penn Manufacturing and Exide Technologies.
5. Revenue Growth
A company’s long-term performance is an indicator of its overall quality. Any business can put up a good quarter or two, but the best consistently grow over the long haul. Unfortunately, EnerSys’s 4.9% annualized revenue growth over the last five years was tepid. This was below our standard for the industrials sector and is a tough starting point for our analysis.
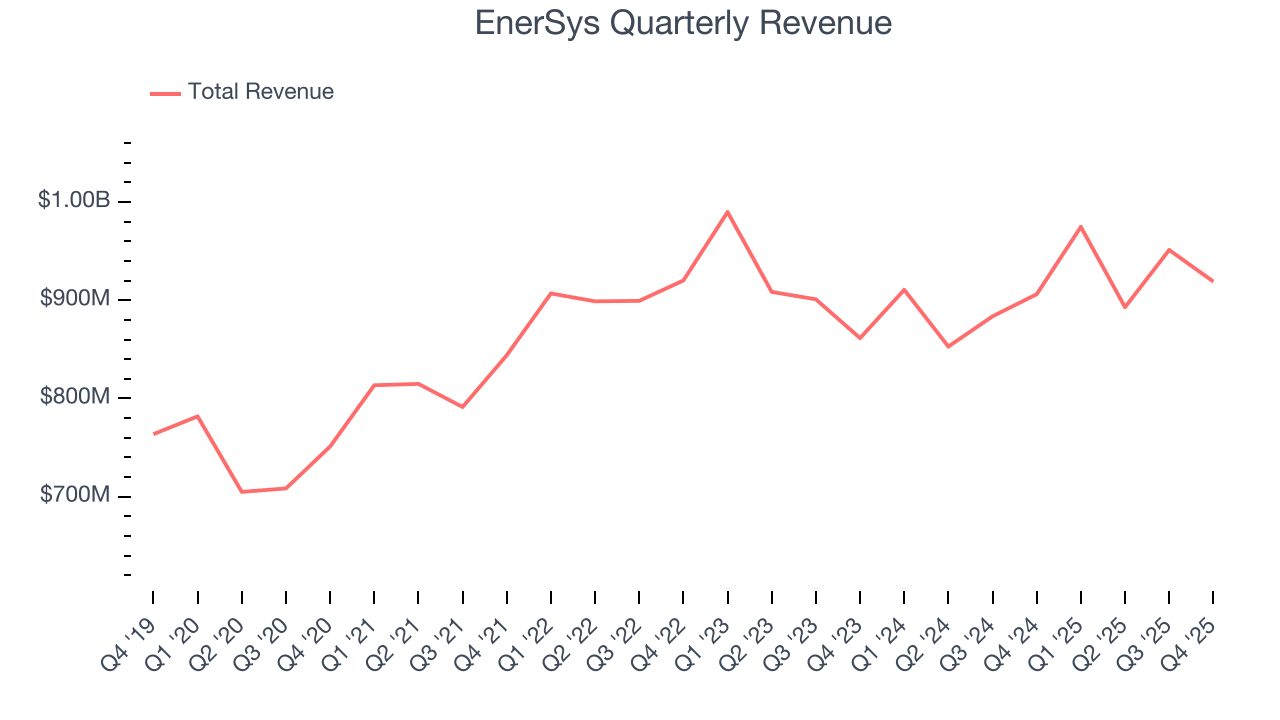
We at StockStory place the most emphasis on long-term growth, but within industrials, a half-decade historical view may miss cycles, industry trends, or a company capitalizing on catalysts such as a new contract win or a successful product line. EnerSys’s recent performance shows its demand has slowed as its annualized revenue growth of 1% over the last two years was below its five-year trend. 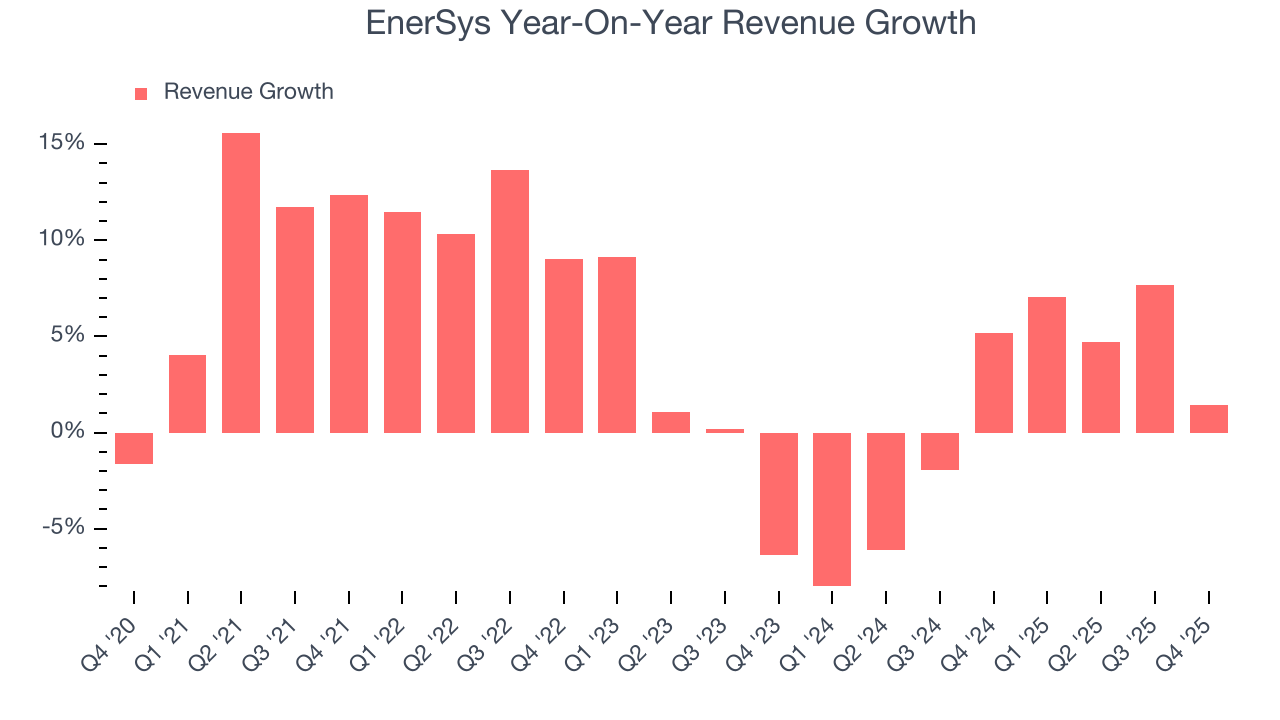
EnerSys also reports its number of units sold. Over the last two years, EnerSys’s units sold averaged 1.1% year-on-year declines. Because this number is lower than its revenue growth, we can see the company benefited from price increases. 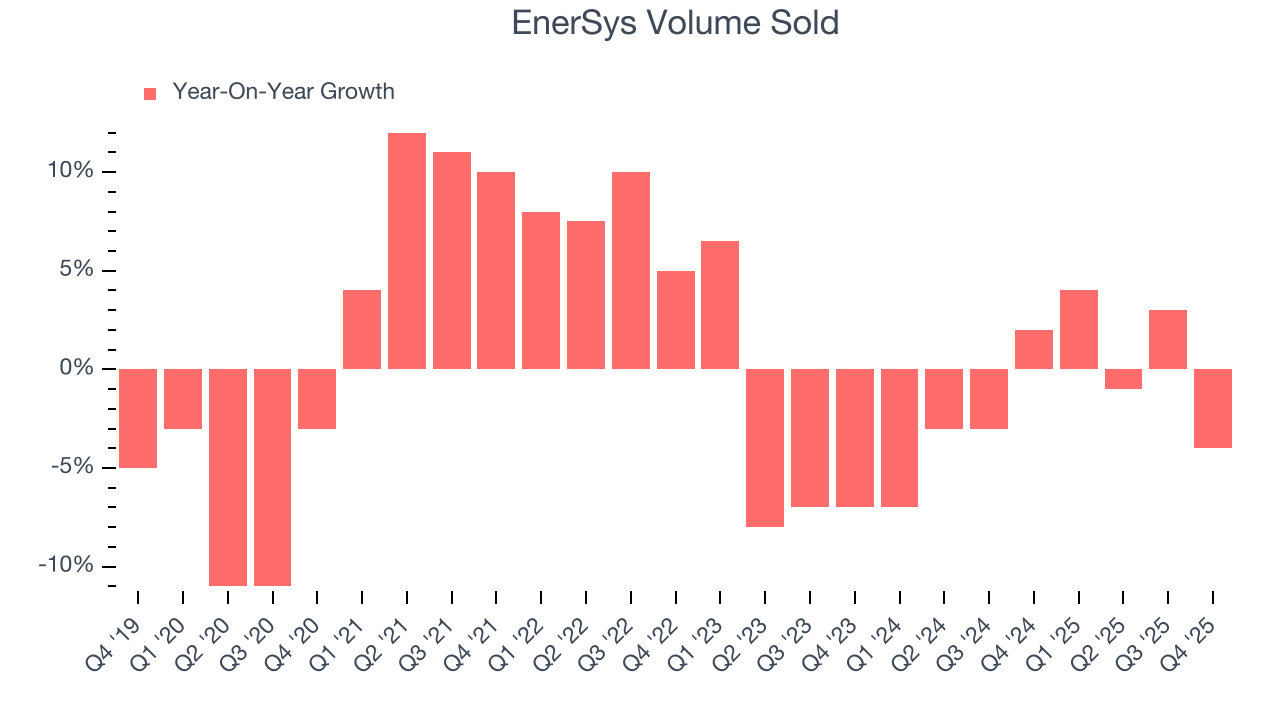
This quarter, EnerSys’s revenue grew by 1.4% year on year to $919.1 million, falling short of Wall Street’s estimates. Company management is currently guiding for flat sales next quarter.
Looking further ahead, sell-side analysts expect revenue to grow 1.9% over the next 12 months, similar to its two-year rate. This projection doesn't excite us and suggests its newer products and services will not catalyze better top-line performance yet.
6. Gross Margin & Pricing Power
All else equal, we prefer higher gross margins because they usually indicate that a company sells more differentiated products and commands stronger pricing power.
EnerSys has bad unit economics for an industrials company, giving it less room to reinvest and develop new offerings. As you can see below, it averaged a 26.3% gross margin over the last five years. Said differently, EnerSys had to pay a chunky $73.67 to its suppliers for every $100 in revenue. 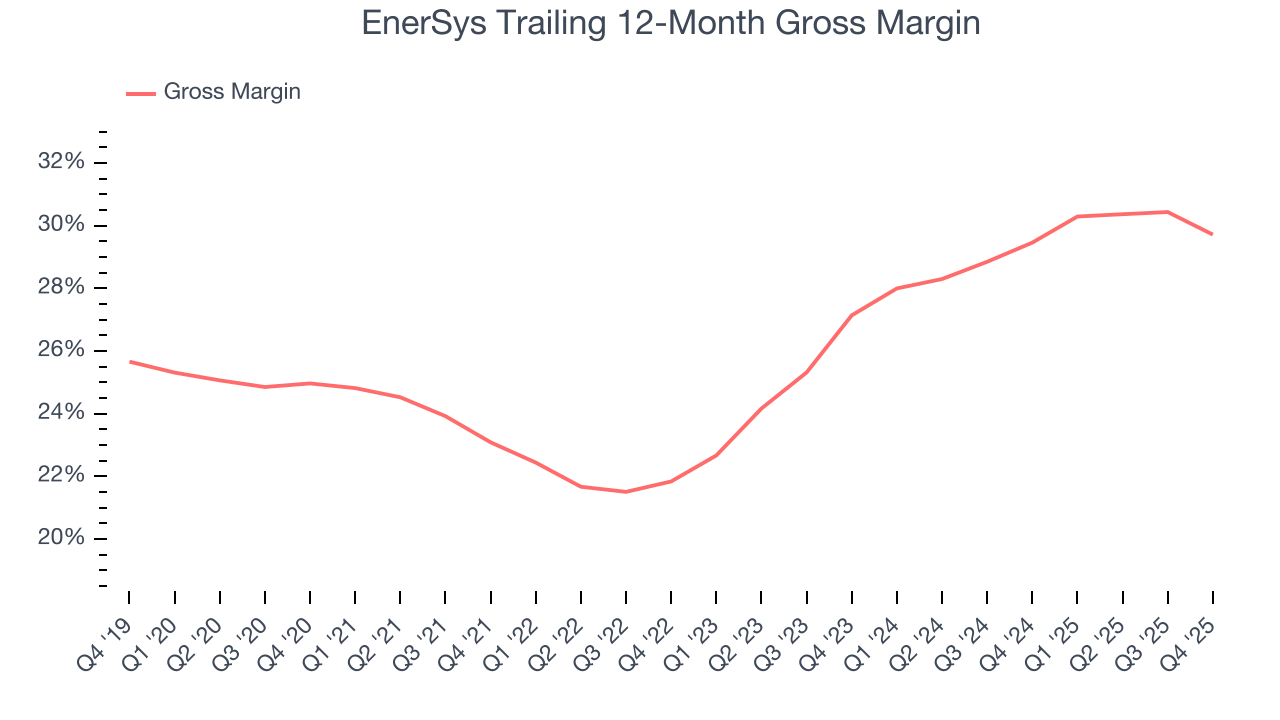
In Q4, EnerSys produced a 30.1% gross profit margin, marking a 3 percentage point decrease from 33% in the same quarter last year. On a wider time horizon, the company’s full-year margin has remained steady over the past four quarters, suggesting its input costs (such as raw materials and manufacturing expenses) have been stable and it isn’t under pressure to lower prices.
7. Operating Margin
Operating margin is a key measure of profitability. Think of it as net income - the bottom line - excluding the impact of taxes and interest on debt, which are less connected to business fundamentals.
EnerSys has done a decent job managing its cost base over the last five years. The company has produced an average operating margin of 9.3%, higher than the broader industrials sector.
Looking at the trend in its profitability, EnerSys’s operating margin rose by 5.1 percentage points over the last five years, as its sales growth gave it operating leverage.
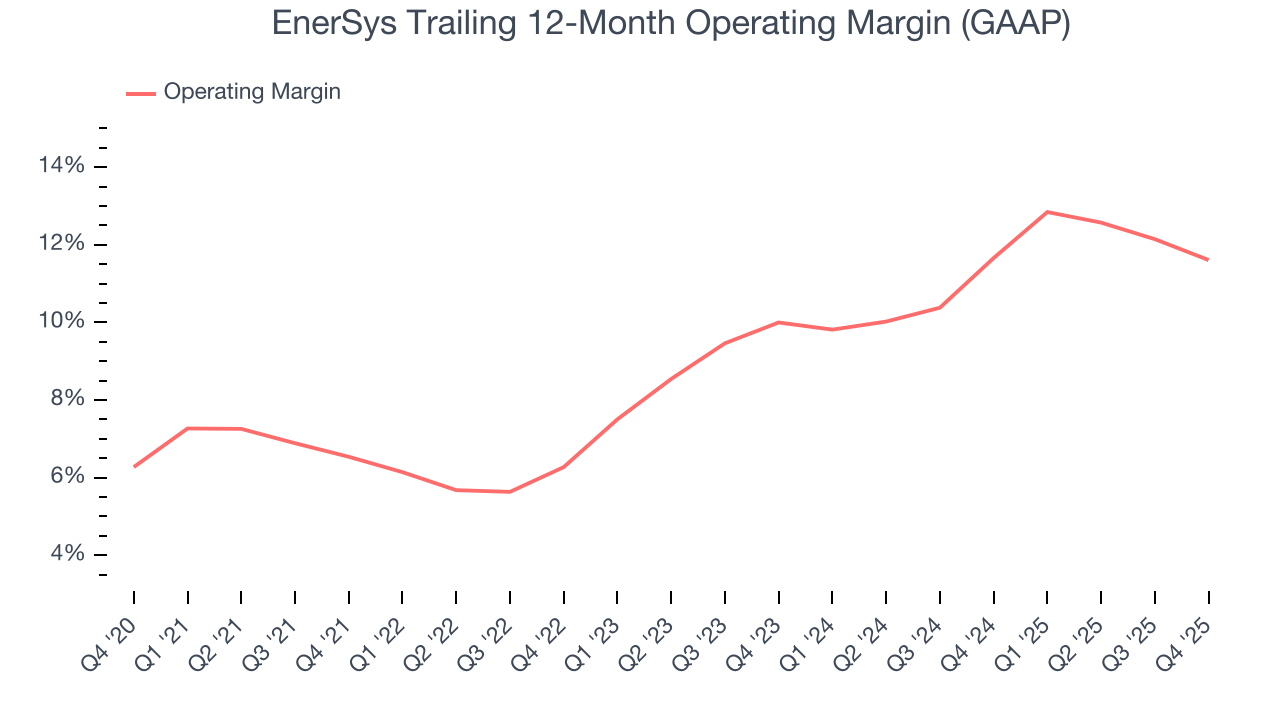
This quarter, EnerSys generated an operating margin profit margin of 13.5%, down 2.2 percentage points year on year. Since EnerSys’s gross margin decreased more than its operating margin, we can assume its recent inefficiencies were driven more by weaker leverage on its cost of sales rather than increased marketing, R&D, and administrative overhead expenses.
8. Earnings Per Share
We track the long-term change in earnings per share (EPS) for the same reason as long-term revenue growth. Compared to revenue, however, EPS highlights whether a company’s growth is profitable.
EnerSys’s EPS grew at an astounding 19.3% compounded annual growth rate over the last five years, higher than its 4.9% annualized revenue growth. This tells us the company became more profitable on a per-share basis as it expanded.
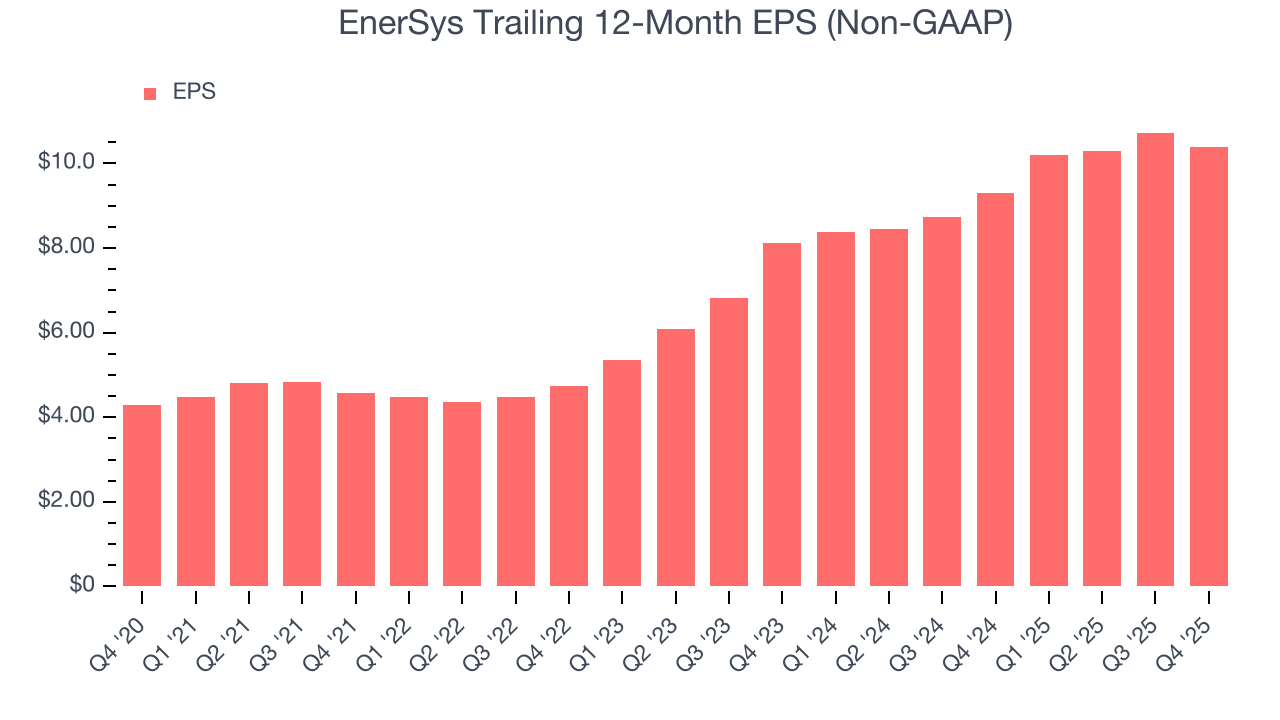
Diving into the nuances of EnerSys’s earnings can give us a better understanding of its performance. As we mentioned earlier, EnerSys’s operating margin declined this quarter but expanded by 5.1 percentage points over the last five years. Its share count also shrank by 13%, and these factors together are positive signs for shareholders because improving profitability and share buybacks turbocharge EPS growth relative to revenue growth. 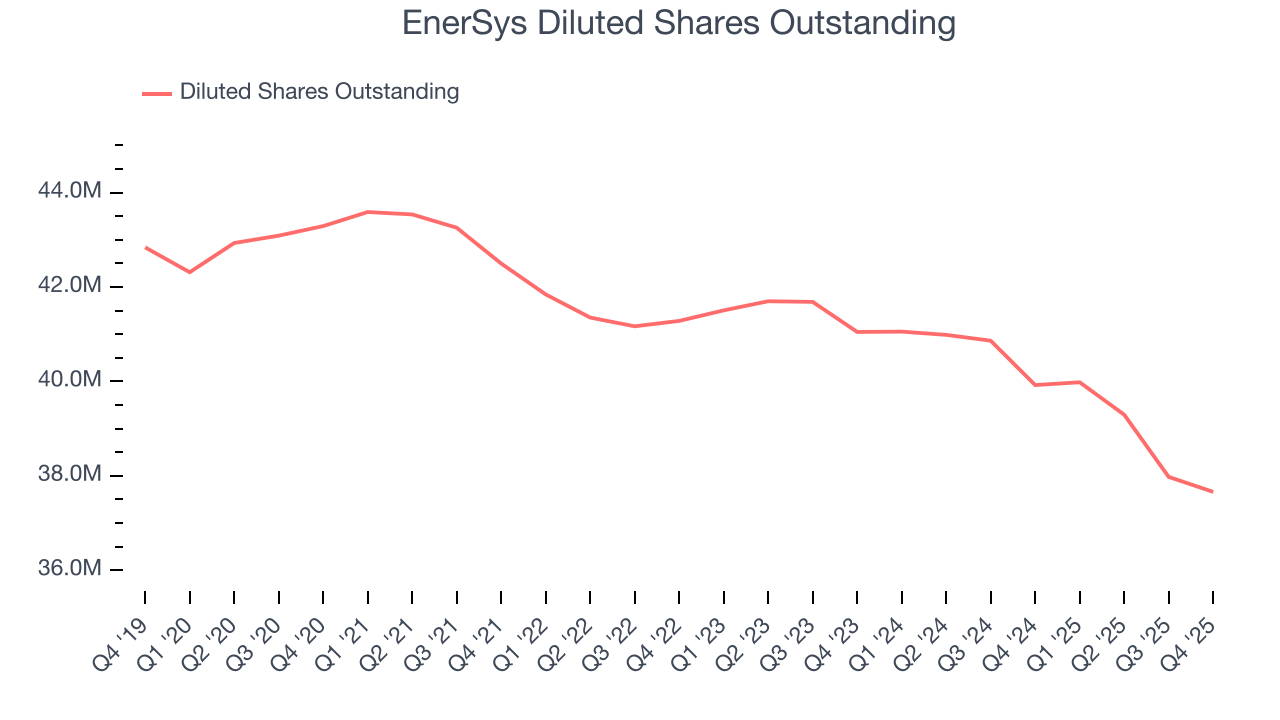
Like with revenue, we analyze EPS over a shorter period to see if we are missing a change in the business.
For EnerSys, its two-year annual EPS growth of 13.1% was lower than its five-year trend. We still think its growth was good and hope it can accelerate in the future.
In Q4, EnerSys reported adjusted EPS of $2.77, down from $3.12 in the same quarter last year. Despite falling year on year, this print beat analysts’ estimates by 1.8%. Over the next 12 months, Wall Street expects EnerSys’s full-year EPS of $10.38 to grow 9.5%.
9. Cash Is King
Free cash flow isn't a prominently featured metric in company financials and earnings releases, but we think it's telling because it accounts for all operating and capital expenses, making it tough to manipulate. Cash is king.
EnerSys has shown weak cash profitability over the last five years, giving the company limited opportunities to return capital to shareholders. Its free cash flow margin averaged 4.4%, subpar for an industrials business.
Taking a step back, an encouraging sign is that EnerSys’s margin expanded by 8.7 percentage points during that time. The company’s improvement shows it’s heading in the right direction, and we can see it became a less capital-intensive business because its free cash flow profitability rose more than its operating profitability.
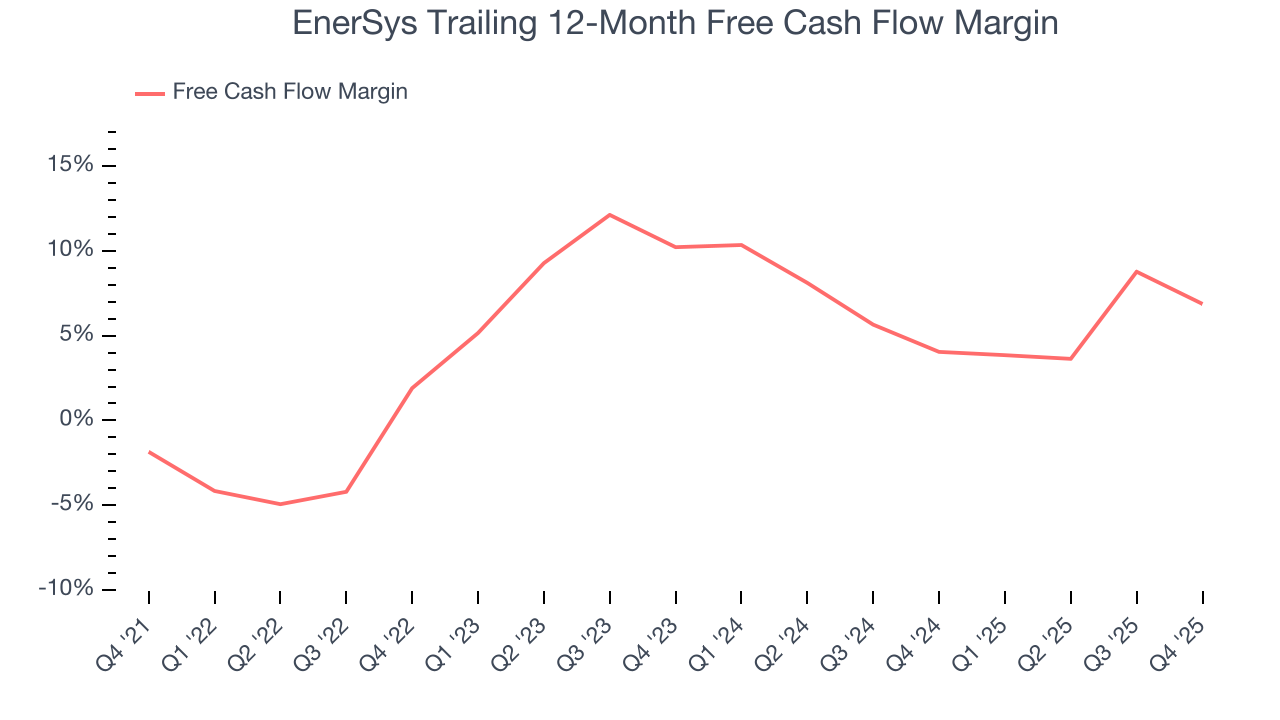
EnerSys burned through $13.12 million of cash in Q4, equivalent to a negative 1.4% margin. The company’s cash flow turned negative after being positive in the same quarter last year, prompting us to pay closer attention. Short-term fluctuations typically aren’t a big deal because investment needs can be seasonal, but we’ll be watching to see if the trend extrapolates into future quarters.
10. Return on Invested Capital (ROIC)
EPS and free cash flow tell us whether a company was profitable while growing its revenue. But was it capital-efficient? A company’s ROIC explains this by showing how much operating profit it makes compared to the money it has raised (debt and equity).
EnerSys’s management team makes decent investment decisions and generates value for shareholders. Its five-year average ROIC was 11.1%, slightly better than typical industrials business.
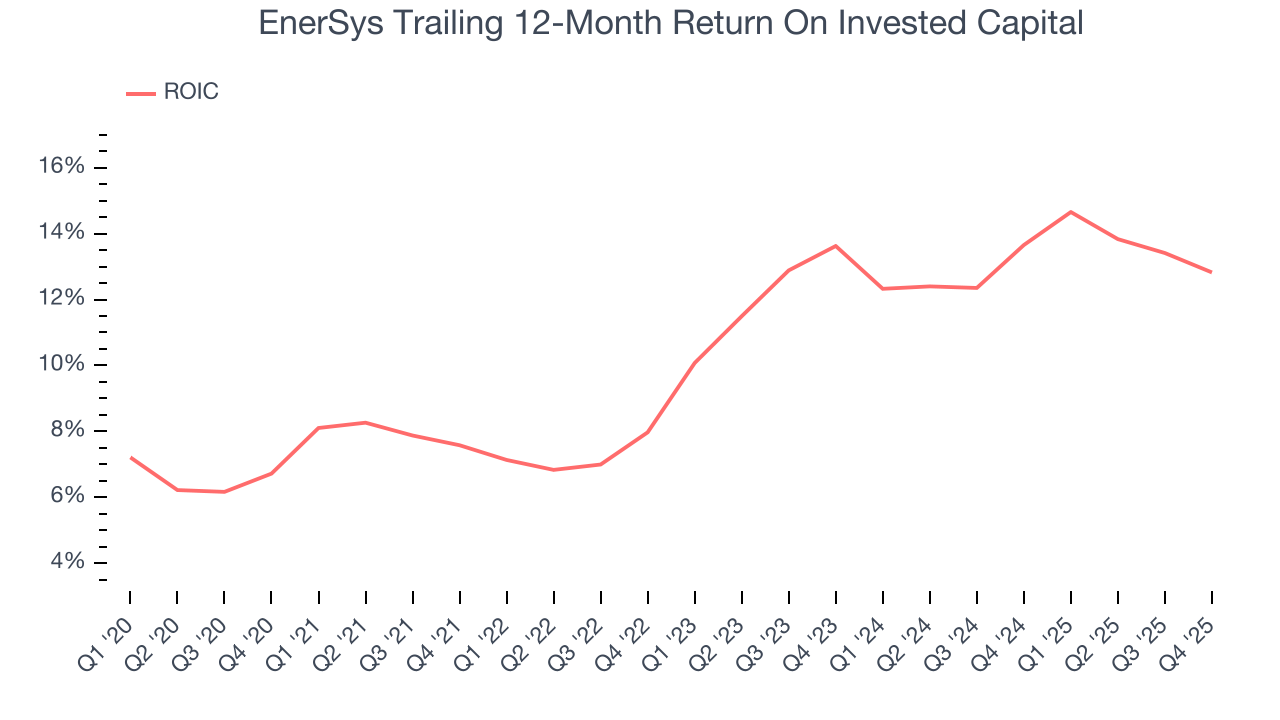
We like to invest in businesses with high returns, but the trend in a company’s ROIC is what often surprises the market and moves the stock price. EnerSys’s ROIC has increased over the last few years. This is a good sign, and if its returns keep rising, there’s a chance it could evolve into an investable business.
11. Balance Sheet Assessment
EnerSys reported $450.1 million of cash and $1.18 billion of debt on its balance sheet in the most recent quarter. As investors in high-quality companies, we primarily focus on two things: 1) that a company’s debt level isn’t too high and 2) that its interest payments are not excessively burdening the business.
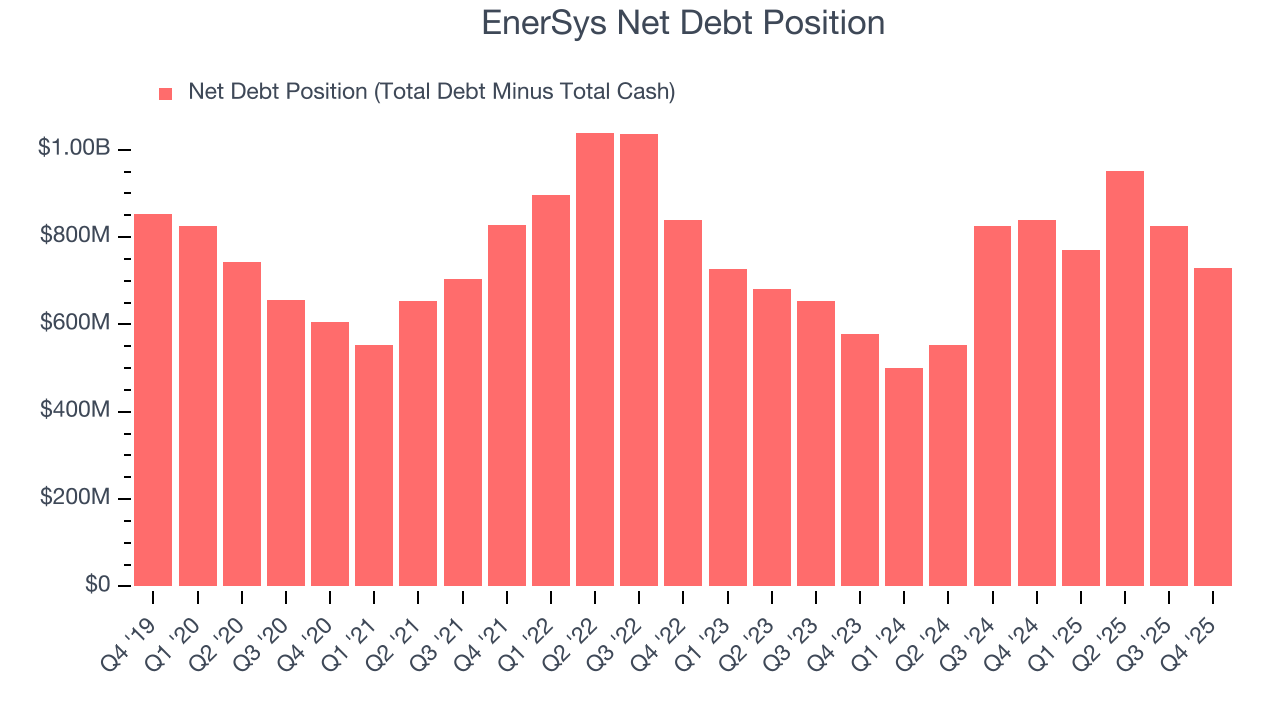
With $595.9 million of EBITDA over the last 12 months, we view EnerSys’s 1.2× net-debt-to-EBITDA ratio as safe. We also see its $36.27 million of annual interest expenses as appropriate. The company’s profits give it plenty of breathing room, allowing it to continue investing in growth initiatives.
12. Key Takeaways from EnerSys’s Q4 Results
We were impressed by how significantly EnerSys blew past analysts’ EBITDA expectations this quarter. We were also glad its EPS guidance for next quarter exceeded Wall Street’s estimates. On the other hand, its sales volume missed and its revenue fell slightly short of Wall Street’s estimates. Overall, this was a weaker quarter. The stock traded down 8.5% to $169.25 immediately following the results.
13. Is Now The Time To Buy EnerSys?
Updated: February 4, 2026 at 10:21 PM EST
The latest quarterly earnings matters, sure, but we actually think longer-term fundamentals and valuation matter more. Investors should consider all these pieces before deciding whether or not to invest in EnerSys.
EnerSys has some positive attributes, but it isn’t one of our picks. Although its revenue growth was uninspiring over the last five years and analysts expect growth to slow over the next 12 months, its rising cash profitability gives it more optionality. Tread carefully with this one, however, as its unit sales declined.
EnerSys’s P/E ratio based on the next 12 months is 16.7x. This valuation is reasonable, but the company’s shakier fundamentals present too much downside risk. We're pretty confident there are superior stocks to buy right now.
Wall Street analysts have a consensus one-year price target of $185.60 on the company (compared to the current share price of $169.79).