
FB Financial (FBK)
We’re wary of FB Financial. Its weak sales growth and low returns on capital show it struggled to generate demand and profits.― StockStory Analyst Team
1. News


2. Summary
Why FB Financial Is Not Exciting
Founded in 1906 and operating through more than a century of economic cycles, FB Financial (NYSE:FBK) operates FirstBank, providing commercial and consumer banking services across Tennessee, Kentucky, Alabama, and North Georgia.
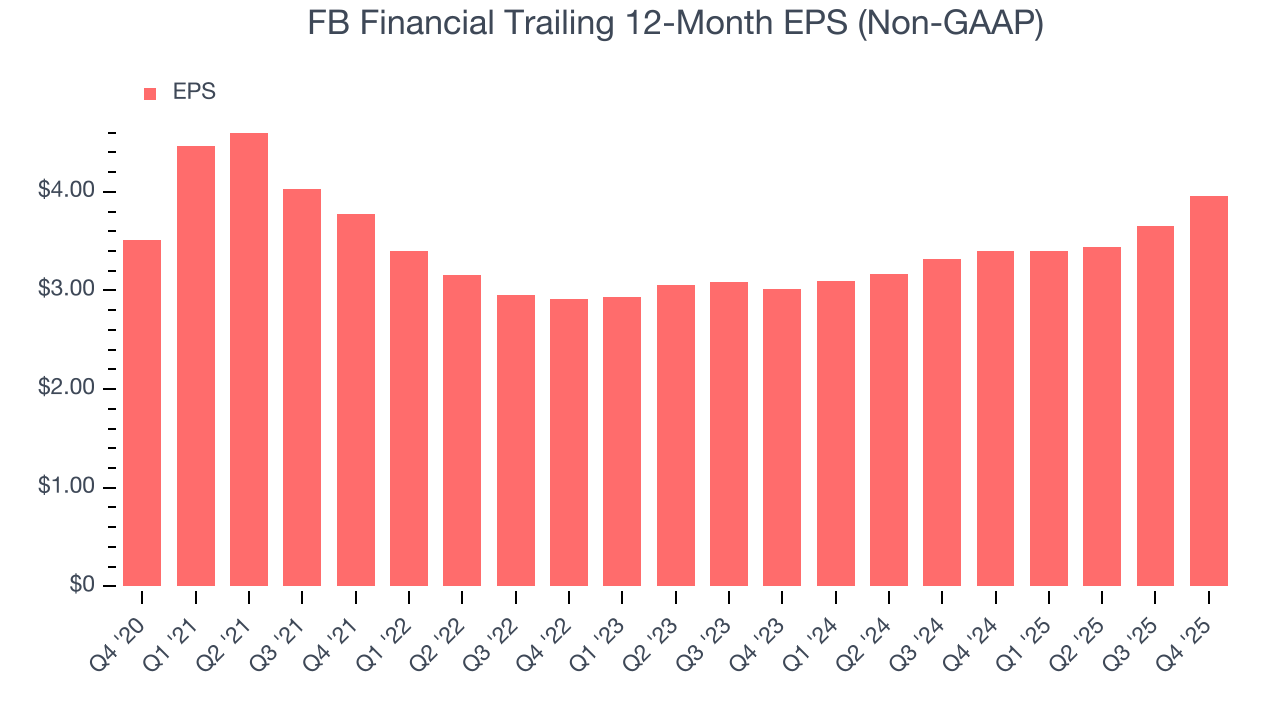
- Earnings growth over the last five years fell short of the peer group average as its EPS only increased by 2.4% annually
- Sales trends were unexciting over the last five years as its 1.9% annual growth was below the typical banking company
- The good news is that its exciting net interest income outlook for the upcoming 12 months calls for 19.3% growth, an acceleration from its five-year trend


FB Financial falls short of our expectations. There are more promising prospects in the market.
Why There Are Better Opportunities Than FB Financial


FB Financial is trading at $57.53 per share, or 1.4x forward P/B. This multiple is higher than most banking companies, and we think it’s quite expensive for the weaker revenue growth you get.
There are stocks out there similarly priced with better business quality. We prefer owning these.
3. FB Financial (FBK) Research Report: Q4 CY2025 Update
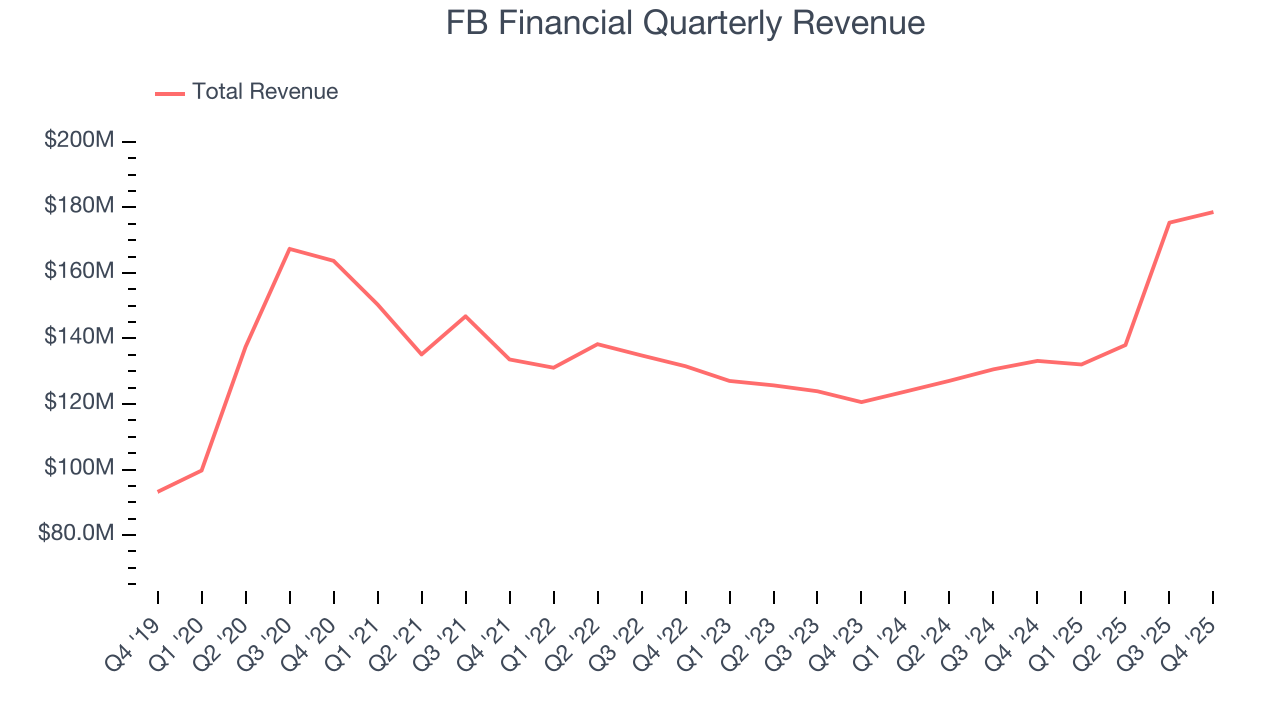
Regional banking company FB Financial (NYSE:FBK) announced better-than-expected revenue in Q4 CY2025, with sales up 34.1% year on year to $178.6 million. Its non-GAAP profit of $1.16 per share was 3.3% above analysts’ consensus estimates.
FB Financial (FBK) Q4 CY2025 Highlights:
- Net Interest Income: $149.8 million vs analyst estimates of $148.4 million (38.2% year-on-year growth, 0.9% beat)
- Net Interest Margin: 4% vs analyst estimates of 3.9% (12 basis point beat)
- Revenue: $178.6 million vs analyst estimates of $175.1 million (34.1% year-on-year growth, 2% beat)
- Efficiency Ratio: 60.2% vs analyst estimates of 53.1% (713.3 basis point miss)
- Adjusted EPS: $1.16 vs analyst estimates of $1.12 (3.3% beat)
- Tangible Book Value per Share: $30.27 vs analyst estimates of $30.56 (7.2% year-on-year growth, 0.9% miss)
- Market Capitalization: $3.13 billion
Company Overview
Founded in 1906 and operating through more than a century of economic cycles, FB Financial (NYSE:FBK) operates FirstBank, providing commercial and consumer banking services across Tennessee, Kentucky, Alabama, and North Georgia.
FB Financial serves both individuals and businesses through its network of full-service bank branches and mortgage offices. The company's banking services include deposit accounts, commercial and industrial loans, construction financing, residential mortgages, and consumer lending products. For business clients, FB Financial typically targets established companies with substantial operating histories, offering them commercial loans, treasury management services, and specialized financing solutions.
The bank's loan portfolio is diversified across several categories, including commercial real estate (both owner-occupied and investment properties), residential mortgages, construction loans, and consumer loans. A typical business client might use FB Financial for a commercial real estate loan to purchase a warehouse, establish operating lines of credit for working capital needs, and maintain business deposit accounts—while the business owner might also use personal banking services.
FB Financial generates revenue primarily through interest income on loans and investments, as well as through fees from deposit accounts, mortgage originations, and other banking services. The company operates under a community banking model, leveraging local knowledge and relationships to serve clients in metropolitan markets like Nashville, Chattanooga, and Birmingham, as well as smaller community markets throughout its footprint.
As a regulated financial institution, FB Financial must comply with extensive federal and state banking regulations designed to protect depositors and maintain the safety and soundness of the banking system. The company's deposits are insured by the FDIC up to applicable legal limits.
4. Regional Banks
Regional banks, financial institutions operating within specific geographic areas, serve as intermediaries between local depositors and borrowers. They benefit from rising interest rates that improve net interest margins (the difference between loan yields and deposit costs), digital transformation reducing operational expenses, and local economic growth driving loan demand. However, these banks face headwinds from fintech competition, deposit outflows to higher-yielding alternatives, credit deterioration (increasing loan defaults) during economic slowdowns, and regulatory compliance costs. Recent concerns about regional bank stability following high-profile failures and significant commercial real estate exposure present additional challenges.
FB Financial competes with other regional banks operating in the Southeast, including Pinnacle Financial Partners (NASDAQ:PNFP), First Horizon (NYSE:FHN), Regions Financial (NYSE:RF), and Truist Financial (NYSE:TFC), as well as national banks and local community banks throughout its markets.
5. Sales Growth
From lending activities to service fees, most banks build their revenue model around two income sources. Interest rate spreads between loans and deposits create the first stream, with the second coming from charges on everything from basic bank accounts to complex investment banking transactions. Unfortunately, FB Financial’s 1.9% annualized revenue growth over the last five years was weak. This fell short of our benchmarks and is a poor baseline for our analysis.
We at StockStory place the most emphasis on long-term growth, but within financials, a half-decade historical view may miss recent interest rate changes, market returns, and industry trends. FB Financial’s annualized revenue growth of 12% over the last two years is above its five-year trend, suggesting its demand recently accelerated. 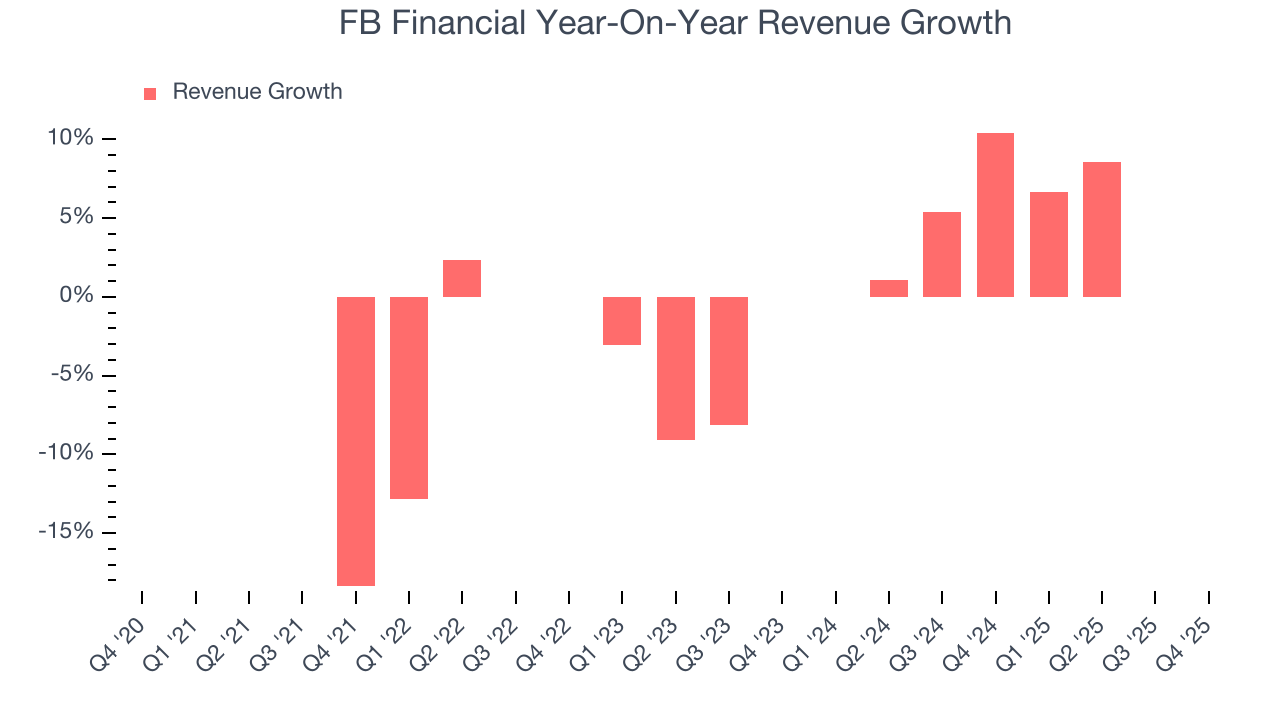 Note: Quarters not shown were determined to be outliers, impacted by outsized investment gains/losses that are not indicative of the recurring fundamentals of the business.
This quarter, FB Financial reported wonderful year-on-year revenue growth of 34.1%, and its $178.6 million of revenue exceeded Wall Street’s estimates by 2%.
Net interest income made up 76.8% of the company’s total revenue during the last five years, meaning lending operations are FB Financial’s largest source of revenue.
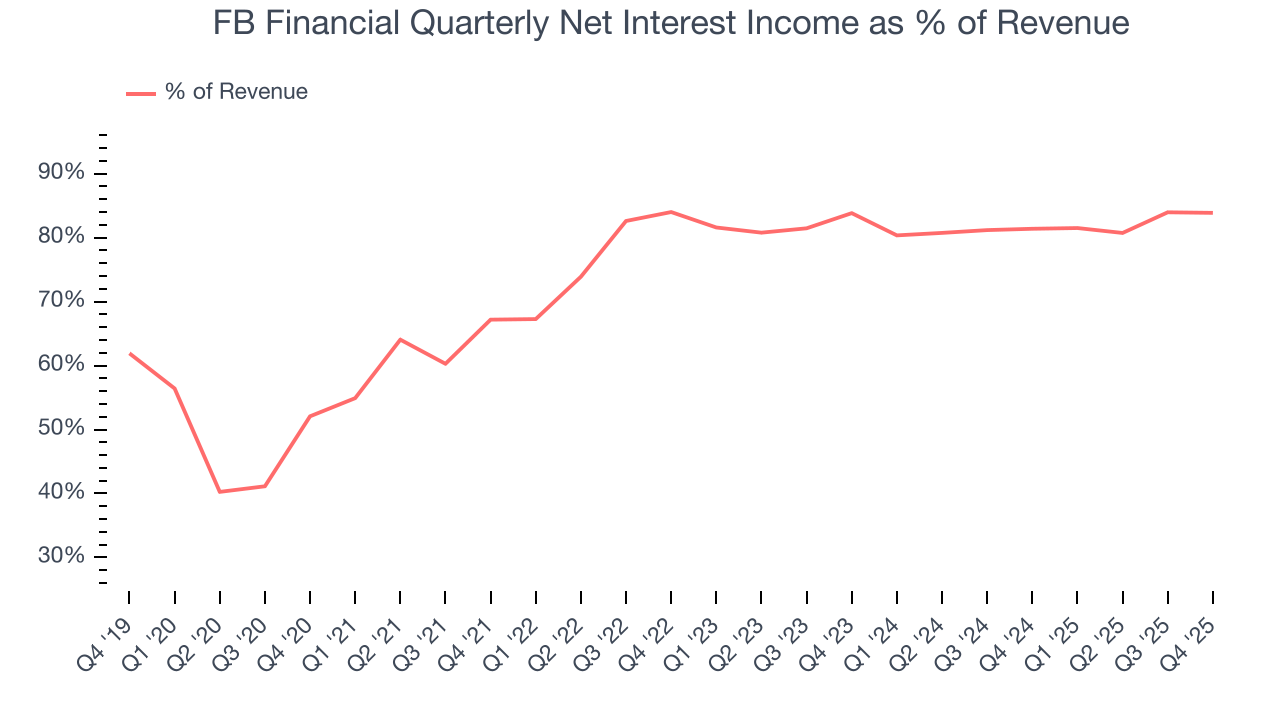
Net interest income commands greater market attention due to its reliability and consistency, whereas non-interest income is often seen as lower-quality revenue that lacks the same dependable characteristics.
6. Efficiency Ratio
The underlying profitability of top-line growth determines the actual bottom-line impact. Banking institutions measure this dynamic using the efficiency ratio, which is calculated by dividing non-interest expenses like personnel, facilities, technology, and marketing by total revenue.
Markets understand that a bank’s expense base depends on its revenue mix and what mostly drives share price performance is the change in this ratio, rather than its absolute value. It’s somewhat counterintuitive, but a lower efficiency ratio is better.
Over the last five years, FB Financial’s efficiency ratio has swelled by 2.6 percentage points, going from 65.5% to 57.6%. Said differently, the company’s expenses have grown at a slower rate than revenue, which typically signals prudent management.
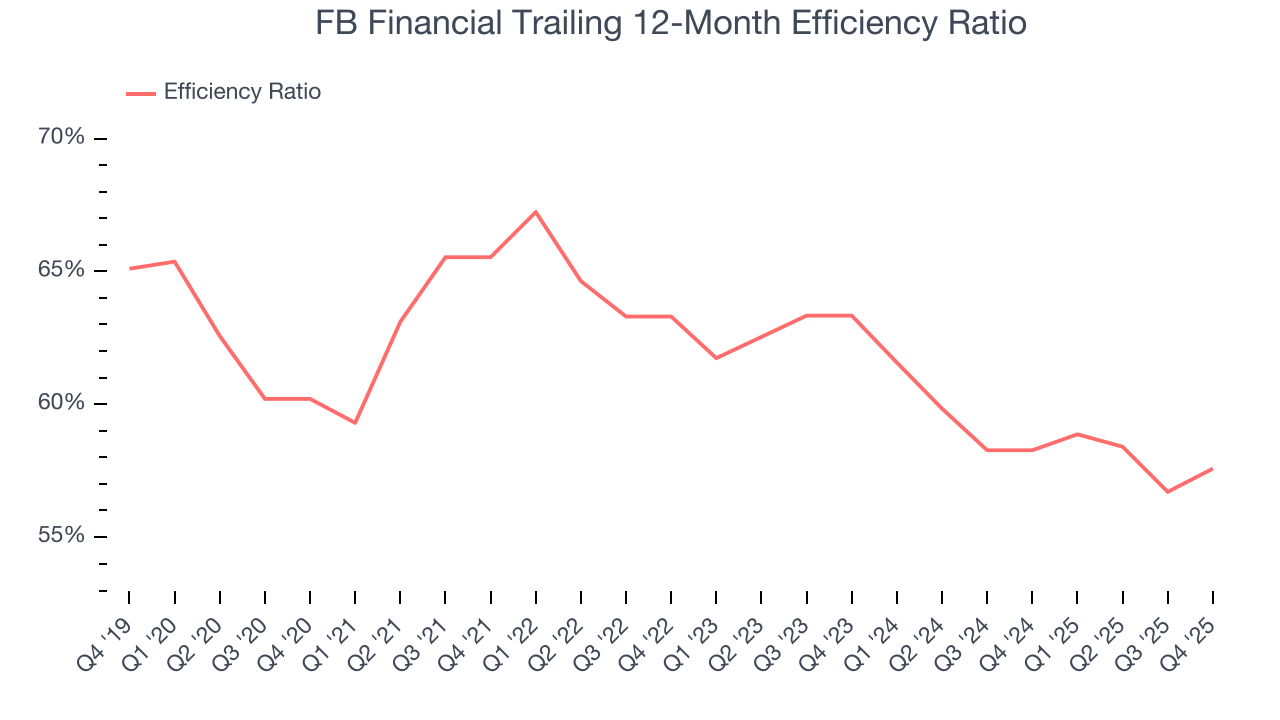
FB Financial’s efficiency ratio came in at 60.2% this quarter, falling short of analysts’ expectations by 713.3 basis points (100 basis points = 1 percentage point).
For the next 12 months, Wall Street expects FB Financial to rein in some of its expenses as it anticipates an efficiency ratio of 52.5%.
7. Earnings Per Share
We track the long-term change in earnings per share (EPS) for the same reason as long-term revenue growth. Compared to revenue, however, EPS highlights whether a company’s growth is profitable.
FB Financial’s weak 2.4% annual EPS growth over the last five years aligns with its revenue performance. This tells us it maintained its per-share profitability as it expanded.
Like with revenue, we analyze EPS over a shorter period to see if we are missing a change in the business.
For FB Financial, its two-year annual EPS growth of 14.7% was higher than its five-year trend. Accelerating earnings growth is almost always an encouraging data point.
In Q4, FB Financial reported adjusted EPS of $1.16, up from $0.85 in the same quarter last year. This print beat analysts’ estimates by 3.3%. Over the next 12 months, Wall Street expects FB Financial’s full-year EPS of $3.96 to grow 18.9%.
8. Tangible Book Value Per Share (TBVPS)
Banks are balance sheet-driven businesses because they generate earnings primarily through borrowing and lending. They’re also valued based on their balance sheet strength and ability to compound book value (another name for shareholders’ equity) over time.
This is why we consider tangible book value per share (TBVPS) the most important metric to track for banks. TBVPS represents the real, liquid net worth per share of a bank, excluding intangible assets that have debatable value upon liquidation. Traditional metrics like EPS are helpful but face distortion from M&A activity and loan loss accounting rules.
FB Financial’s TBVPS grew at a solid 6.9% annual clip over the last five years. TBVPS growth has also accelerated recently, growing by 8.6% annually over the last two years from $25.68 to $30.27 per share.
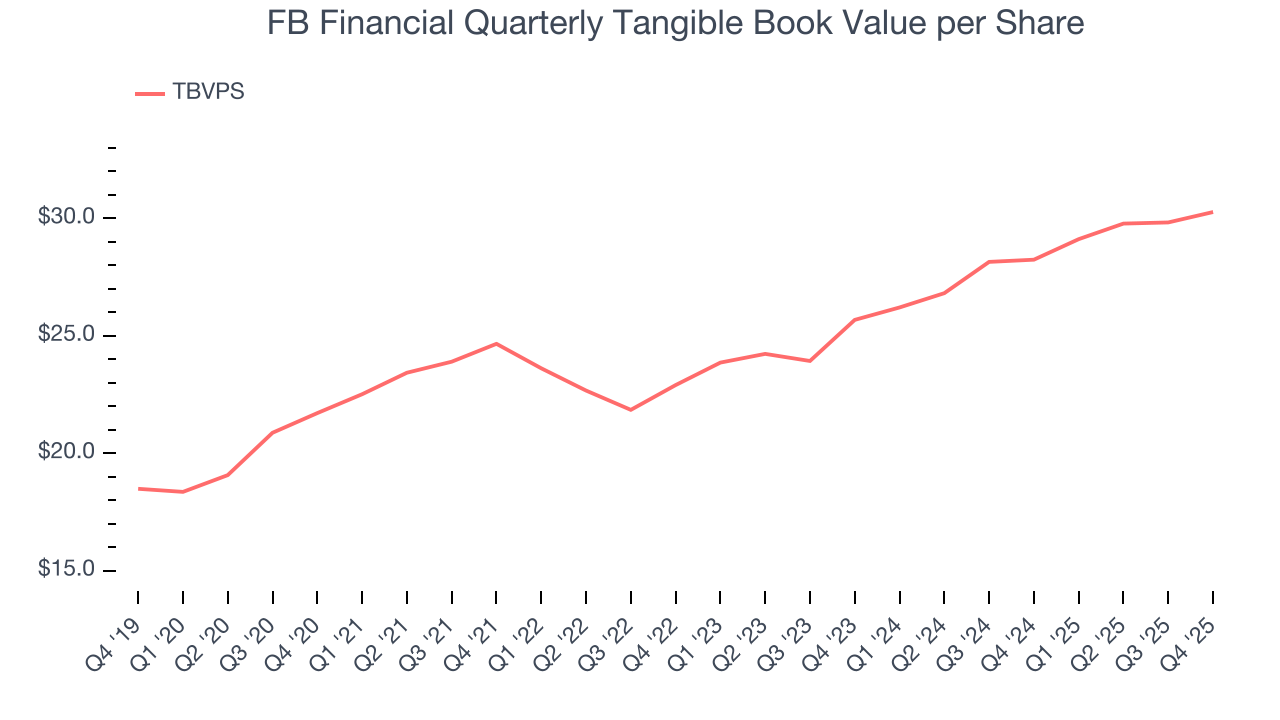
Over the next 12 months, Consensus estimates call for FB Financial’s TBVPS to grow by 14.4% to $34.63, decent growth rate.
9. Balance Sheet Assessment
Leverage is core to a financial firm’s business model (loans funded by deposits). To ensure economic stability and avoid a repeat of the 2008 GFC, regulators require certain levels of capital and liquidity, focusing on the Tier 1 capital ratio.
Tier 1 capital is the highest-quality capital that a firm holds, consisting primarily of common stock and retained earnings, but also physical gold. It serves as the primary cushion against losses and is the first line of defense in times of financial distress.
This capital is divided by risk-weighted assets to derive the Tier 1 capital ratio. Risk-weighted means that cash and US treasury securities are assigned little risk while unsecured consumer loans and equity investments get much higher risk weights, for example.
New regulation after the 2008 financial crisis requires that all firms must maintain a Tier 1 capital ratio greater than 4.5%. On top of this, there are additional buffers based on scale, risk profile, and other regulatory classifications, so that at the end of the day, firms generally must maintain a 7-10% ratio at minimum.
Over the last two years, FB Financial has averaged a Tier 1 capital ratio of 12.4%, which is considered safe and well capitalized in the event that macro or market conditions suddenly deteriorate.
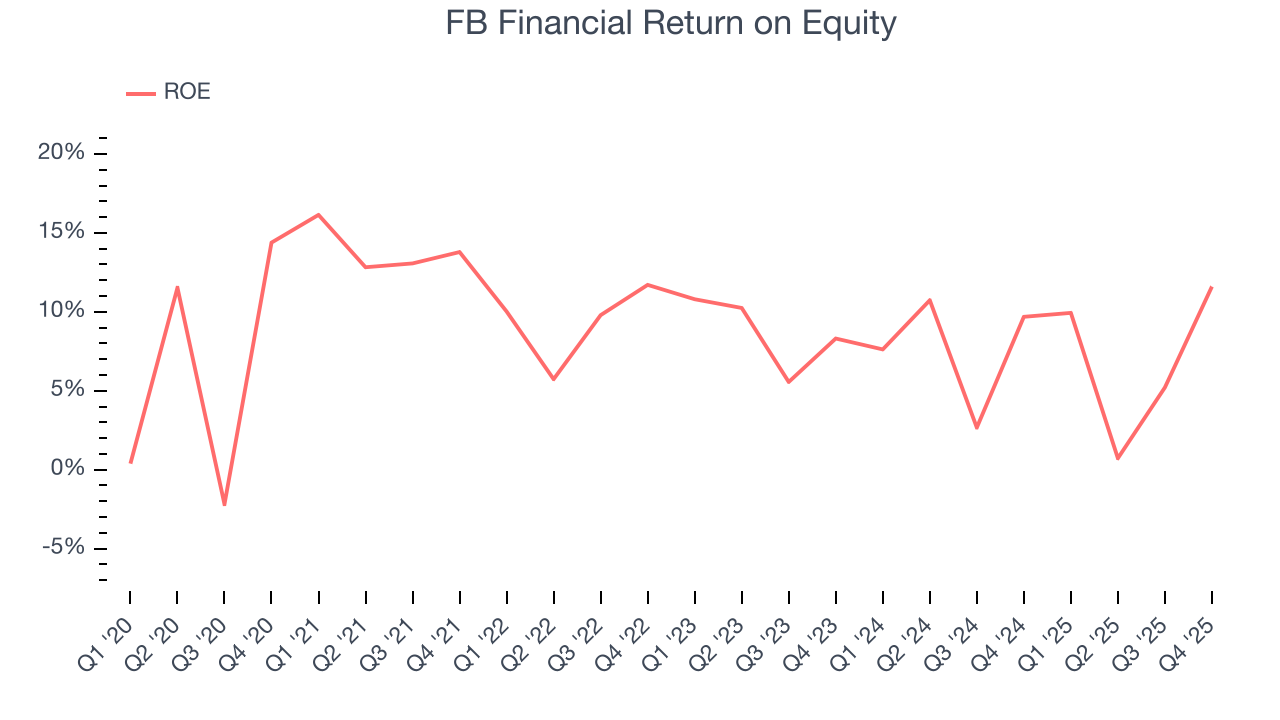
10. Return on Equity
Return on equity (ROE) measures how effectively banks generate profit from each dollar of shareholder equity - a critical funding source. High-ROE institutions typically compound shareholder wealth faster over time through retained earnings, share repurchases, and dividend payments.
Over the last five years, FB Financial has averaged an ROE of 9.3%, uninspiring for a company operating in a sector where the average shakes out around 7.5%.
11. Key Takeaways from FB Financial’s Q4 Results
It was encouraging to see FB Financial beat analysts’ revenue expectations this quarter. We were also happy its net interest income narrowly outperformed Wall Street’s estimates. On the other hand, its tangible book value per share slightly missed and its EPS slightly exceeded Wall Street’s estimates. Zooming out, we think this was a mixed quarter. The stock remained flat at $61.82 immediately following the results.
12. Is Now The Time To Buy FB Financial?
Updated: January 30, 2026 at 11:46 PM EST
Before deciding whether to buy FB Financial or pass, we urge investors to consider business quality, valuation, and the latest quarterly results.
FB Financial isn’t a terrible business, but it doesn’t pass our bar. For starters, its revenue growth was weak over the last five years. And while FB Financial’s estimated net interest income growth for the next 12 months is great, its weak EPS growth over the last five years shows it’s failed to produce meaningful profits for shareholders.
FB Financial’s P/B ratio based on the next 12 months is 1.4x. This valuation multiple is fair, but we don’t have much faith in the company. We're fairly confident there are better stocks to buy right now.
Wall Street analysts have a consensus one-year price target of $66 on the company (compared to the current share price of $57.53).