FedEx (FDX)
We wouldn’t buy FedEx. Its weak sales growth and low returns on capital show it struggled to generate demand and profits.― StockStory Analyst Team
1. News


2. Summary
Why We Think FedEx Will Underperform
Sporting one of the largest air cargo fleets in the world, FedEx (NYSE:FDX) is a global provider of parcel and cargo delivery services.
- Sales were flat over the last two years, indicating it’s failed to expand this cycle
- Low free cash flow margin gives it little breathing room, constraining its ability to self-fund growth or return capital to shareholders
- Anticipated sales growth of 4.5% for the next year implies demand will be shaky


FedEx doesn’t live up to our standards. We’re on the lookout for more interesting opportunities.
Why There Are Better Opportunities Than FedEx


FedEx’s stock price of $282.95 implies a valuation ratio of 15x forward P/E. FedEx’s multiple may seem like a great deal among industrials peers, but we think there are valid reasons why it’s this cheap.
It’s better to pay up for high-quality businesses with higher long-term earnings potential rather than to buy lower-quality stocks because they appear cheap. These challenged businesses often don’t re-rate, a phenomenon known as a “value trap”.
3. FedEx (FDX) Research Report: Q4 CY2025 Update
Parcel and cargo delivery company FedEx (NYSE:FDX) reported Q4 CY2025 results beating Wall Street’s revenue expectations, with sales up 6.8% year on year to $23.47 billion. Its non-GAAP profit of $4.82 per share was 17.2% above analysts’ consensus estimates.
FedEx (FDX) Q4 CY2025 Highlights:
- Revenue: $23.47 billion vs analyst estimates of $22.79 billion (6.8% year-on-year growth, 3% beat)
- Adjusted EPS: $4.82 vs analyst estimates of $4.11 (17.2% beat)
- Management raised its full-year Adjusted EPS guidance to $18.40 at the midpoint, a 1.7% increase
- Operating Margin: 5.9%, up from 4.8% in the same quarter last year
- Free Cash Flow Margin: 6.5%, up from 0.8% in the same quarter last year
- Market Capitalization: $66.59 billion
Company Overview
Sporting one of the largest air cargo fleets in the world, FedEx (NYSE:FDX) is a global provider of parcel and cargo delivery services.
FedEx was founded in 1962 by Fred Smith after he devised a business idea for delivering packages at his Yale economics class. Despite facing challenges in being profitable early on, the company overcame its hurdles and has evolved into one of the largest logistics companies today. Specifically, much of the company’s growth has been fueled by acquisitions of companies such as TNT Express, an express delivery company it acquired for €4.4 billion in 2016 to expand its presence in Europe.
Today, FedEx provides pickup and delivery services for anything ranging from mail to large cargo. The company executes these services by leveraging its retail locations as drop-off/pick-up points and its network of distribution centers, ships, planes, and trucks to fulfill orders.
Its express offerings connect markets that generate more than 99% of the world’s gross domestic product through door-to-door. The company has implemented Network 2.0, a program to improve profitability by improving efficiency with which it picks up, transports, and delivers packages. Network 2.0 improves delivery routes and uses new technology to move packages faster and cheaper.
The company reaches its customers through its online platform and various brick-and-mortar locations where customers can access printing and shipping services. FedEx engages in contracts with businesses and offers volume discounts dependent on volume and frequency, incentivizing long-term partnerships. It offers several shipping speed options that vary in price.
4. Air Freight and Logistics
The growth of e-commerce and global trade continues to drive demand for expedited shipping services, presenting opportunities for air freight companies. The industry continues to invest in advanced technologies such as automated sorting systems and real-time tracking solutions to enhance operational efficiency. Despite the advantages of speed and global reach, air freight and logistics companies are still at the whim of economic cycles. Consumer spending, for example, can greatly impact the demand for these companies’ offerings while fuel costs can influence profit margins.
Competitors offering similar products include UPS (NYSE:UPS), GXO (NYSE:GXO), and Amazon (NASDAQ:AMZN).
5. Revenue Growth
A company’s long-term sales performance is one signal of its overall quality. Even a bad business can shine for one or two quarters, but a top-tier one grows for years. Unfortunately, FedEx’s 3.8% annualized revenue growth over the last five years was sluggish. This fell short of our benchmark for the industrials sector and is a rough starting point for our analysis.
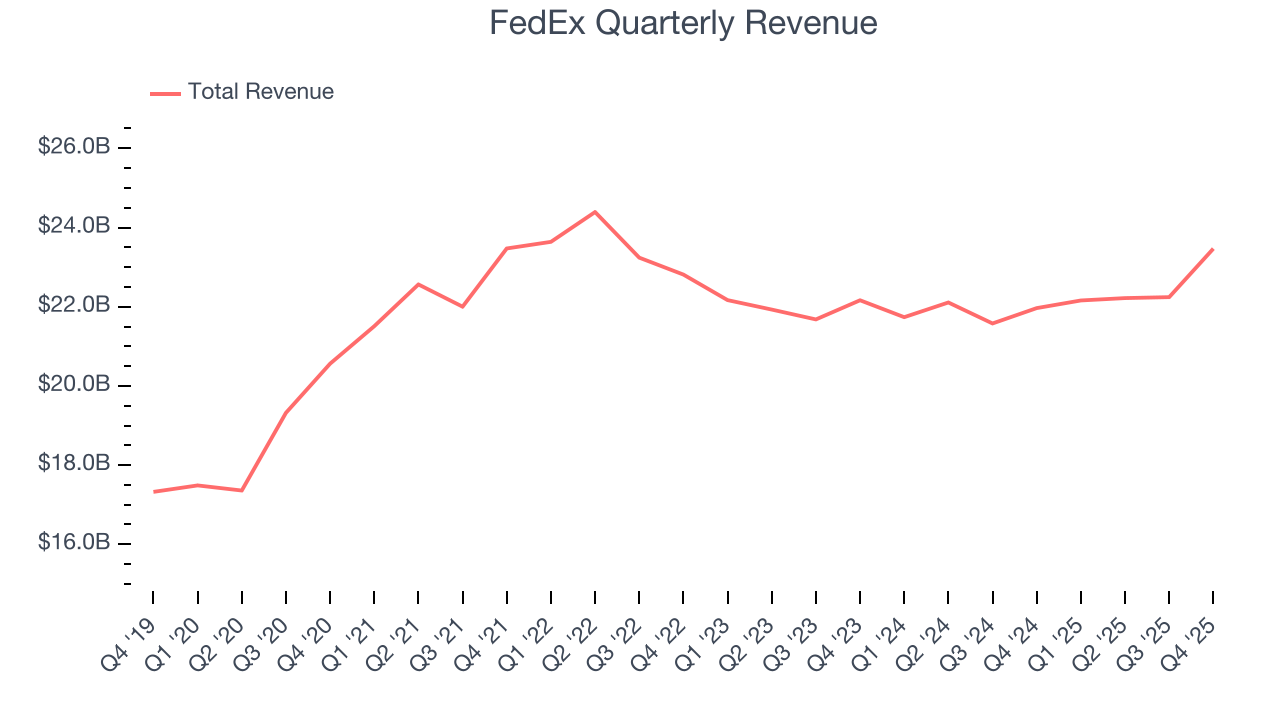
Long-term growth is the most important, but within industrials, a half-decade historical view may miss new industry trends or demand cycles. FedEx’s recent performance shows its demand has slowed as its annualized revenue growth of 1.2% over the last two years was below its five-year trend. We also note many other Air Freight and Logistics businesses have faced declining sales because of cyclical headwinds. While FedEx grew slower than we’d like, it did do better than its peers. 
This quarter, FedEx reported year-on-year revenue growth of 6.8%, and its $23.47 billion of revenue exceeded Wall Street’s estimates by 3%.
Looking ahead, sell-side analysts expect revenue to grow 3.9% over the next 12 months. While this projection suggests its newer products and services will fuel better top-line performance, it is still below the sector average.
6. Gross Margin & Pricing Power
Cost of sales for an industrials business is usually comprised of the direct labor, raw materials, and supplies needed to offer a product or service. These costs can be impacted by inflation and supply chain dynamics.
FedEx’s gross margin is slightly below the average industrials company, giving it less room to invest in areas such as research and development. As you can see below, it averaged a 27.1% gross margin over the last five years. Said differently, FedEx had to pay a chunky $72.92 to its suppliers for every $100 in revenue. 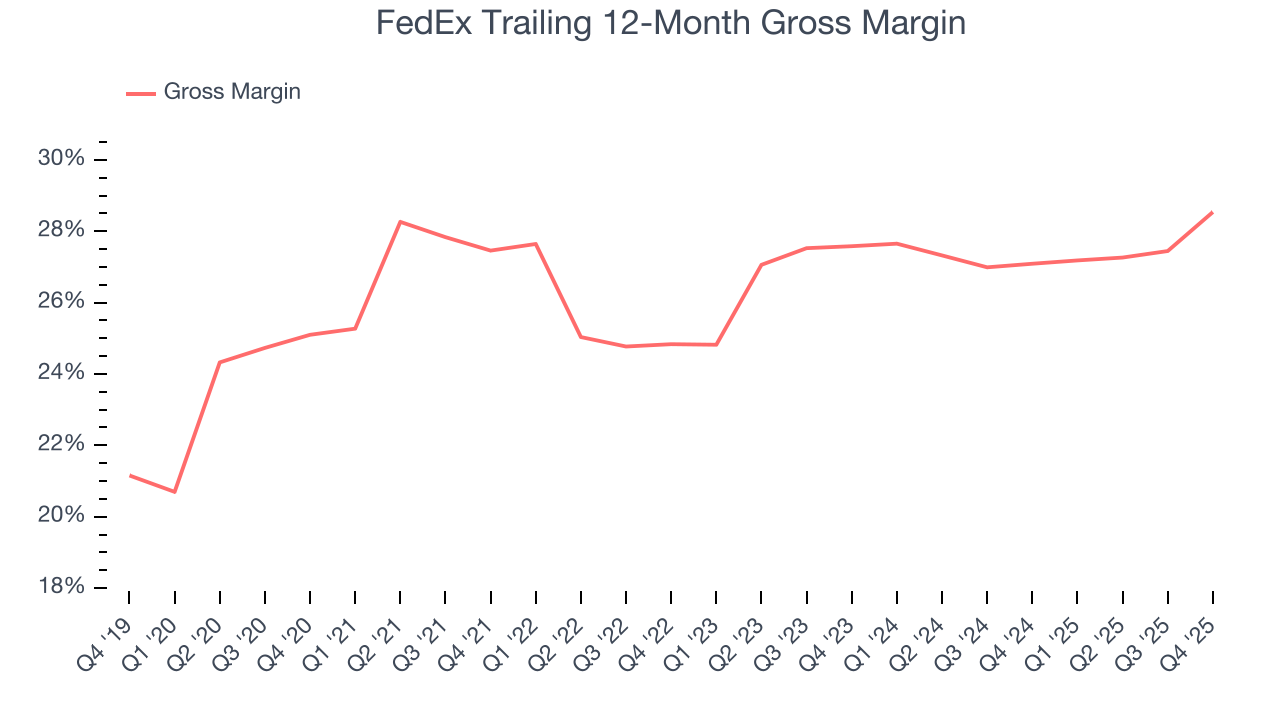
FedEx’s gross profit margin came in at 30.2% this quarter, up 4.3 percentage points year on year. FedEx’s full-year margin has also been trending up over the past 12 months, increasing by 1.4 percentage points. If this move continues, it could suggest better unit economics due to more leverage from its growing sales on the fixed portion of its cost of goods sold (such as manufacturing expenses).
7. Operating Margin
Operating margin is an important measure of profitability as it shows the portion of revenue left after accounting for all core expenses – everything from the cost of goods sold to advertising and wages. It’s also useful for comparing profitability across companies with different levels of debt and tax rates because it excludes interest and taxes.
FedEx’s operating margin might fluctuated slightly over the last 12 months but has remained more or less the same, averaging 6.1% over the last five years. This profitability was paltry for an industrials business and caused by its suboptimal cost structureand low gross margin.
Analyzing the trend in its profitability, FedEx’s operating margin might fluctuated slightly but has generally stayed the same over the last five years. This raises questions about the company’s expense base because its revenue growth should have given it leverage on its fixed costs, resulting in better economies of scale and profitability. FedEx’s performance was poor, but we noticed this is a broad theme as many similar Air Freight and Logistics companies saw their margins fall (along with revenue, as mentioned above) because the cycle turned in the wrong direction.
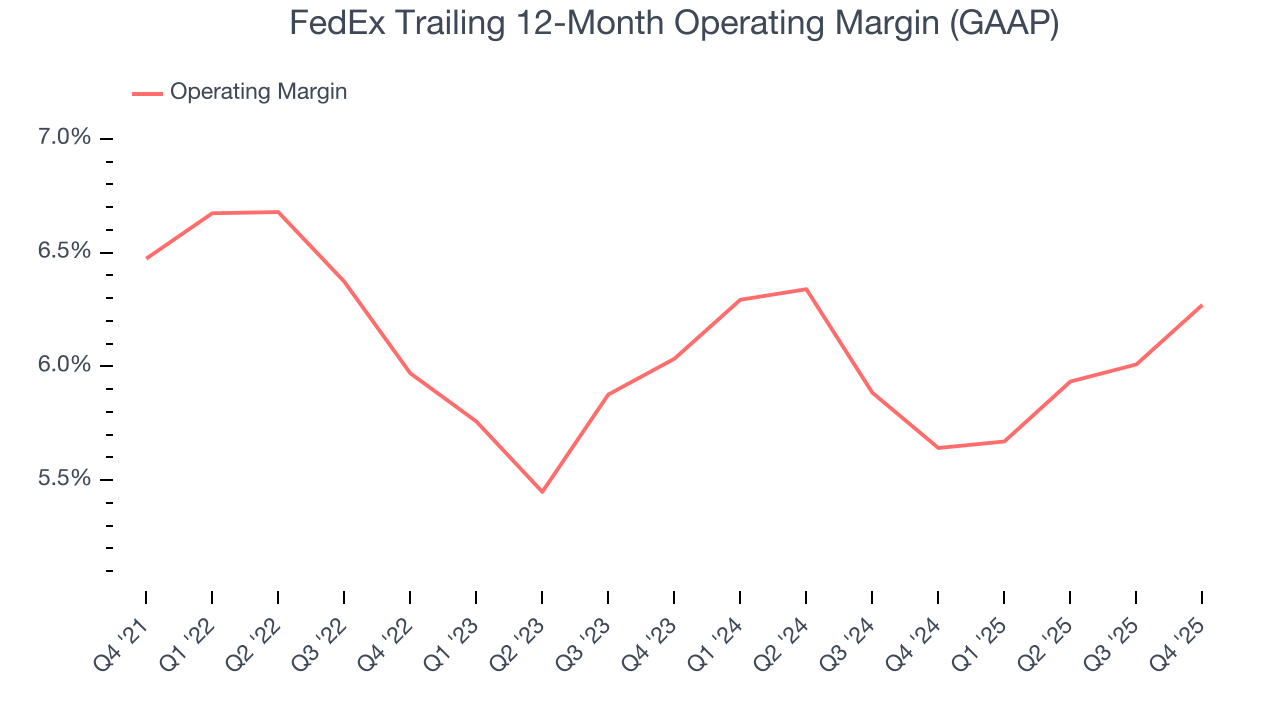
In Q4, FedEx generated an operating margin profit margin of 5.9%, up 1.1 percentage points year on year. Since its gross margin expanded more than its operating margin, we can infer that leverage on its cost of sales was the primary driver behind the recently higher efficiency.
8. Earnings Per Share
Revenue trends explain a company’s historical growth, but the long-term change in earnings per share (EPS) points to the profitability of that growth – for example, a company could inflate its sales through excessive spending on advertising and promotions.
FedEx’s EPS grew at an unimpressive 7.1% compounded annual growth rate over the last five years. This performance was better than its flat revenue but doesn’t tell us much about its business quality because its operating margin didn’t improve.
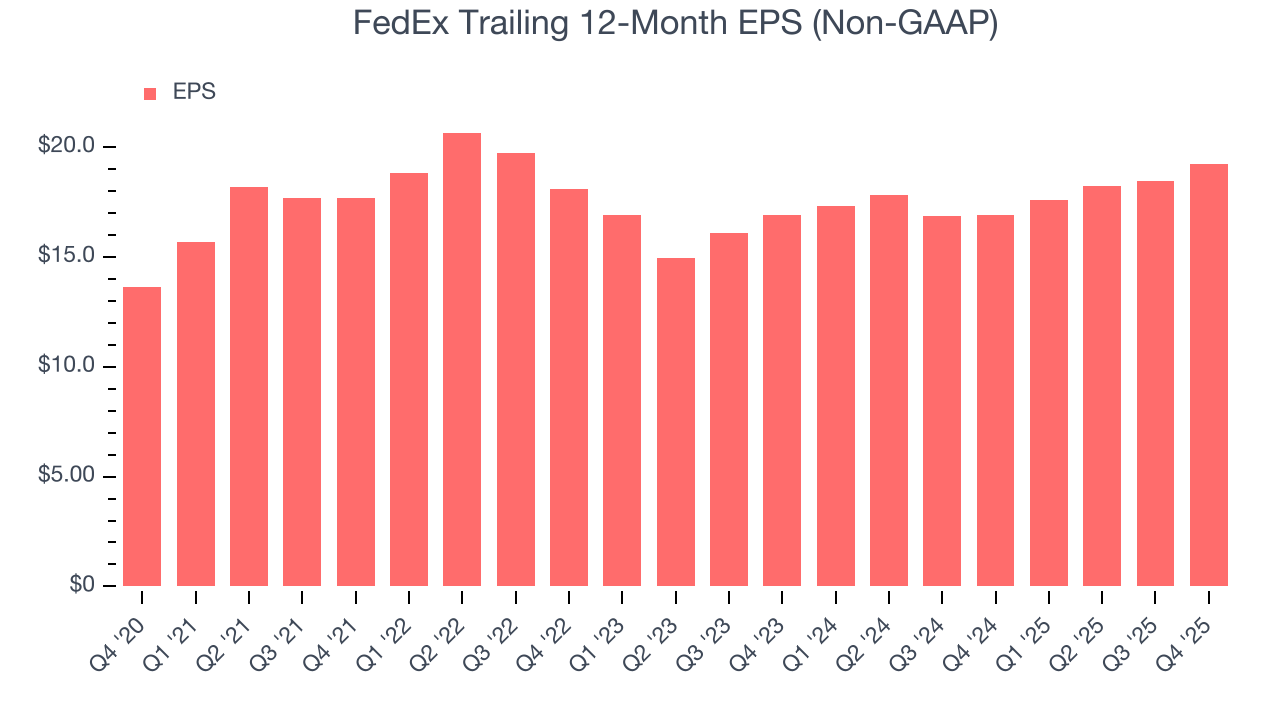
We can take a deeper look into FedEx’s earnings to better understand the drivers of its performance. A five-year view shows that FedEx has repurchased its stock, shrinking its share count by 12.3%. This tells us its EPS outperformed its revenue not because of increased operational efficiency but financial engineering, as buybacks boost per share earnings. 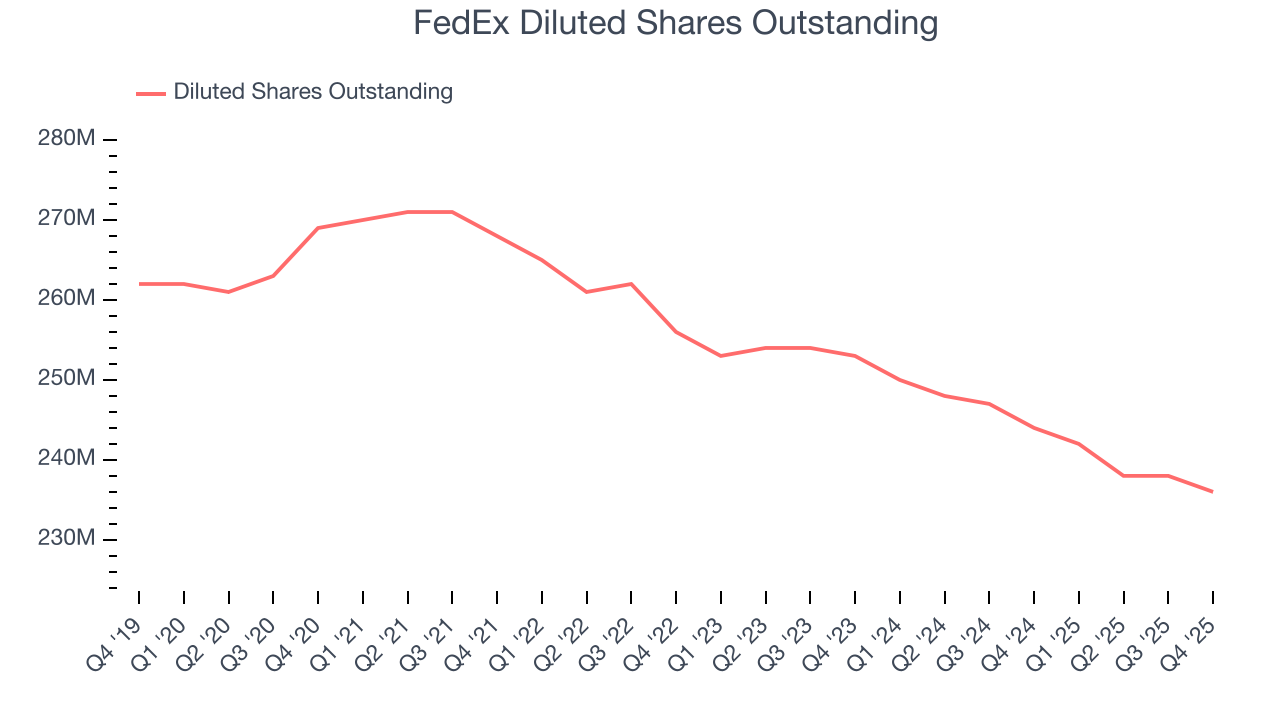
Like with revenue, we analyze EPS over a more recent period because it can provide insight into an emerging theme or development for the business.
For FedEx, its two-year annual EPS growth of 6.7% is similar to its five-year trend, implying stable earnings.
In Q4, FedEx reported adjusted EPS of $4.82, up from $4.05 in the same quarter last year. This print easily cleared analysts’ estimates, and shareholders should be content with the results. Over the next 12 months, Wall Street expects FedEx’s full-year EPS of $19.23 to grow 1.8%.
9. Cash Is King
Free cash flow isn't a prominently featured metric in company financials and earnings releases, but we think it's telling because it accounts for all operating and capital expenses, making it tough to manipulate. Cash is king.
FedEx has shown poor cash profitability over the last five years, giving the company limited opportunities to return capital to shareholders. Its free cash flow margin averaged 2.5%, lousy for an industrials business.
Taking a step back, an encouraging sign is that FedEx’s margin expanded by 1.8 percentage points during that time. The company’s improvement shows it’s heading in the right direction, and we can see it became a less capital-intensive business because its free cash flow profitability rose while its operating profitability was flat.
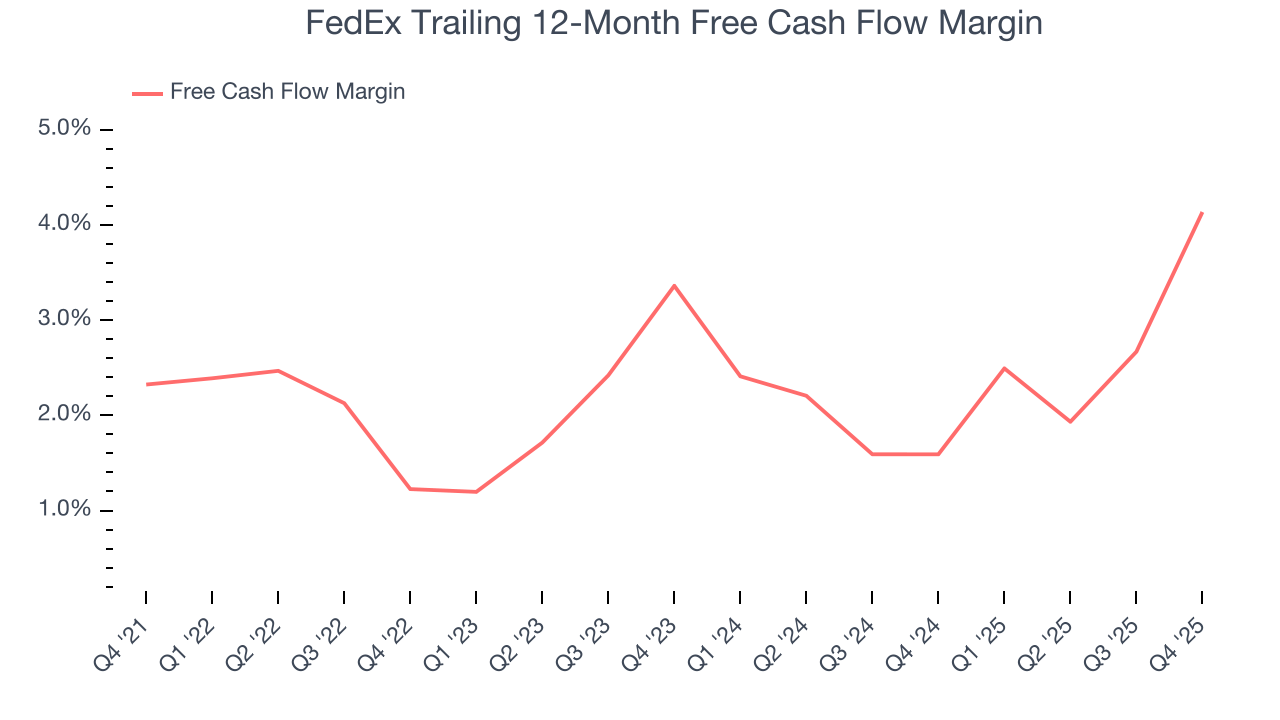
FedEx’s free cash flow clocked in at $1.54 billion in Q4, equivalent to a 6.5% margin. This result was good as its margin was 5.8 percentage points higher than in the same quarter last year, building on its favorable historical trend.
10. Return on Invested Capital (ROIC)
EPS and free cash flow tell us whether a company was profitable while growing its revenue. But was it capital-efficient? A company’s ROIC explains this by showing how much operating profit it makes compared to the money it has raised (debt and equity).
FedEx historically did a mediocre job investing in profitable growth initiatives. Its five-year average ROIC was 8.8%, somewhat low compared to the best industrials companies that consistently pump out 20%+.
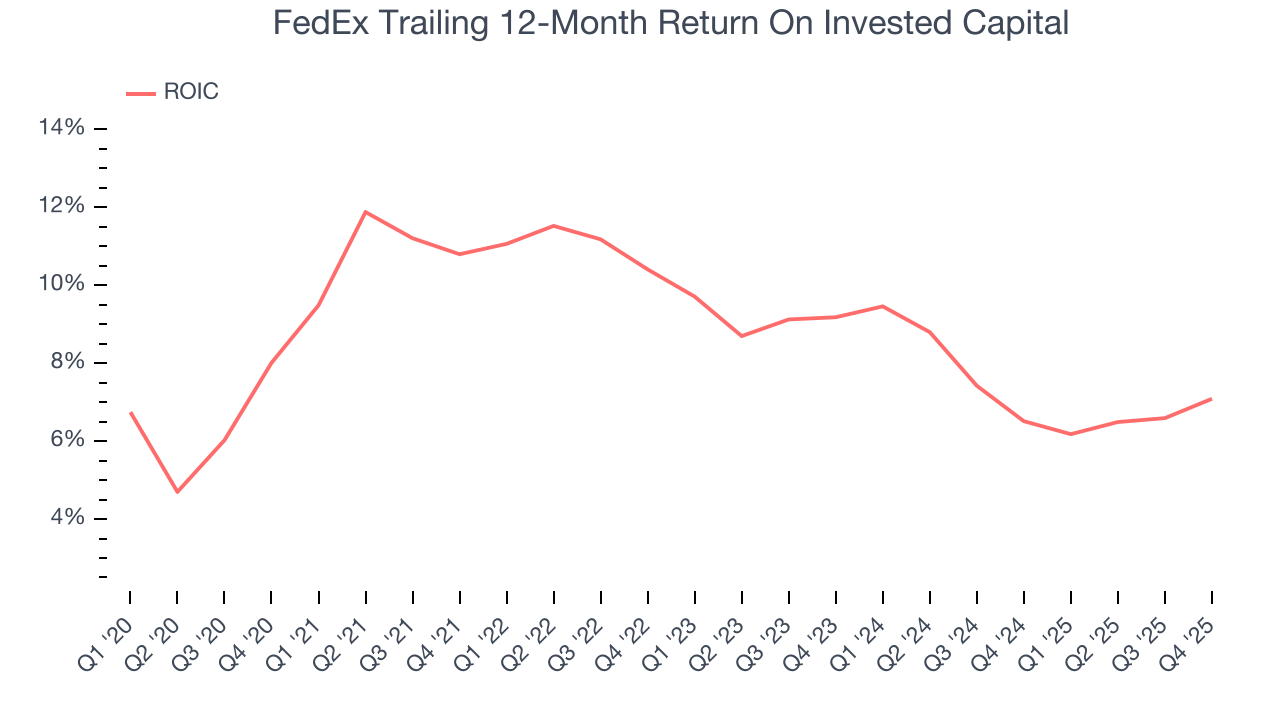
We like to invest in businesses with high returns, but the trend in a company’s ROIC is what often surprises the market and moves the stock price. Unfortunately, FedEx’s ROIC averaged 3.8 percentage point decreases over the last few years. Paired with its already low returns, these declines suggest its profitable growth opportunities are few and far between.
11. Balance Sheet Assessment
FedEx reported $6.57 billion of cash and $37.77 billion of debt on its balance sheet in the most recent quarter. As investors in high-quality companies, we primarily focus on two things: 1) that a company’s debt level isn’t too high and 2) that its interest payments are not excessively burdening the business.
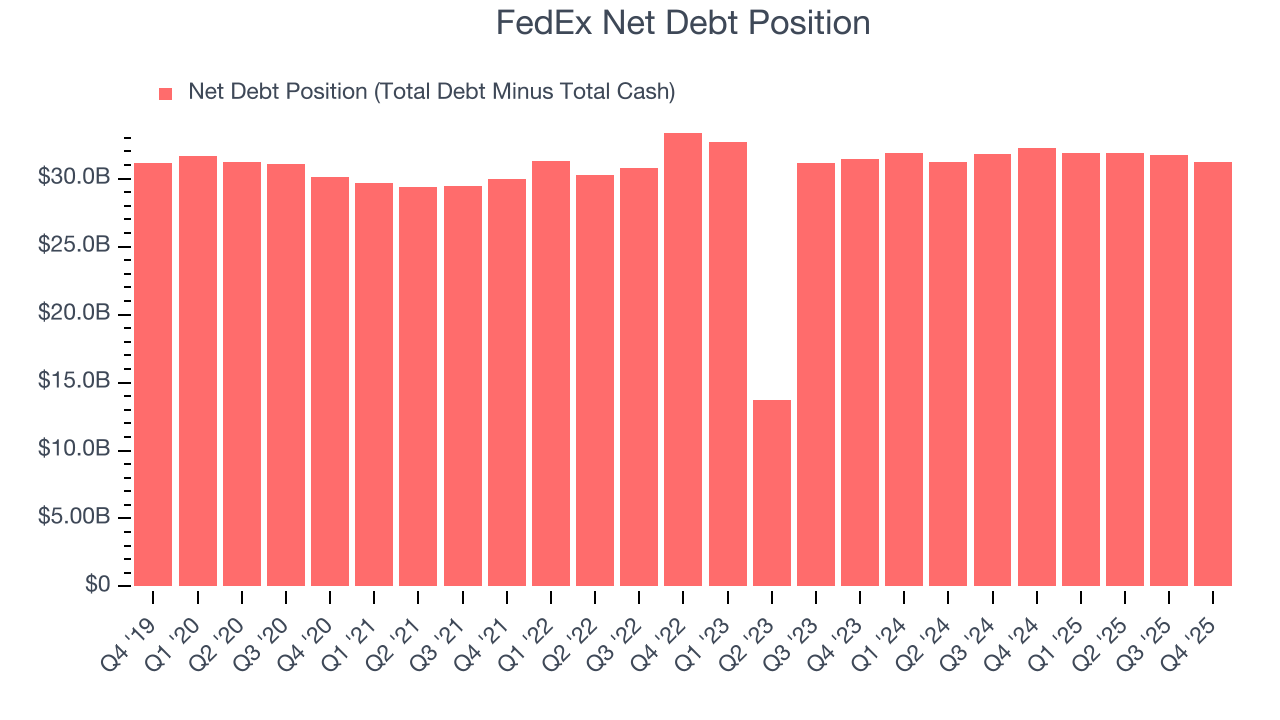
With $10.49 billion of EBITDA over the last 12 months, we view FedEx’s 3.0× net-debt-to-EBITDA ratio as safe. We also see its $494 million of annual interest expenses as appropriate. The company’s profits give it plenty of breathing room, allowing it to continue investing in growth initiatives.
12. Key Takeaways from FedEx’s Q4 Results
We enjoyed seeing FedEx beat analysts’ revenue expectations this quarter. We were also glad its EPS outperformed Wall Street’s estimates. Looking ahead, full-year EPS guidance was also raised. Overall, we think this was a solid quarter with some key metrics above expectations. The stock traded up 1.7% to $292.91 immediately following the results.
13. Is Now The Time To Buy FedEx?
Updated: December 18, 2025 at 4:31 PM EST
Before deciding whether to buy FedEx or pass, we urge investors to consider business quality, valuation, and the latest quarterly results.
FedEx doesn’t pass our quality test. To kick things off, its revenue growth was uninspiring over the last five years, and analysts don’t see anything changing over the next 12 months. And while its rising cash profitability gives it more optionality, the downside is its projected EPS for the next year is lacking. On top of that, its diminishing returns show management's prior bets haven't worked out.
FedEx’s P/E ratio based on the next 12 months is 14.7x. While this valuation is reasonable, we don’t see a big opportunity at the moment. There are more exciting stocks to buy at the moment.
Wall Street analysts have a consensus one-year price target of $286.43 on the company (compared to the current share price of $292.91).