
Flutter Entertainment (FLUT)
Flutter Entertainment is in for a bumpy ride. Not only has its sales growth been weak but also its negative returns on capital show it destroyed value.― StockStory Analyst Team
1. News

2. Summary
Why We Think Flutter Entertainment Will Underperform
With its digital fingerprints on nearly every aspect of global gambling, from the Super Bowl bettor to the online poker aficionado, Flutter Entertainment (NASDAQ:FLUT) operates a portfolio of leading online sports betting and gaming brands including FanDuel, PokerStars, Paddy Power, and Sky Betting & Gaming.
- Large revenue base makes it harder to increase sales quickly, and its annual revenue growth of 16.8% over the last two years was below our standards for the consumer discretionary sector
- Earnings per share lagged its peers over the last four years as they only grew by 14% annually
- Subpar operating margin constrains its ability to invest in process improvements or effectively respond to new competitive threats


Flutter Entertainment is skating on thin ice. There are more promising prospects in the market.
Why There Are Better Opportunities Than Flutter Entertainment


At $125.20 per share, Flutter Entertainment trades at 18.3x forward P/E. The current valuation may be fair, but we’re still passing on this stock due to better alternatives out there.
There are stocks out there similarly priced with better business quality. We prefer owning these.
3. Flutter Entertainment (FLUT) Research Report: Q3 CY2025 Update
Global online betting powerhouse Flutter Entertainment (NASDAQ:FLUT) missed Wall Street’s revenue expectations in Q3 CY2025, but sales rose 16.8% year on year to $3.79 billion. Its GAAP loss of $3.92 per share was significantly below analysts’ consensus estimates.
Flutter Entertainment (FLUT) Q3 CY2025 Highlights:
- Revenue: $3.79 billion vs analyst estimates of $3.85 billion (16.8% year-on-year growth, 1.4% miss)
- EPS (GAAP): -$3.92 vs analyst estimates of -$0.65 (significant miss)
- Adjusted EBITDA: $478 million vs analyst estimates of $353.9 million (12.6% margin, 35.1% beat)
- Operating Margin: -22%, down from 3% in the same quarter last year
- Free Cash Flow Margin: 2.3%, down from 5% in the same quarter last year
- : 14.13 million, up 1.21 million year on year
- Market Capitalization: $38.05 billion
Company Overview
With its digital fingerprints on nearly every aspect of global gambling, from the Super Bowl bettor to the online poker aficionado, Flutter Entertainment (NASDAQ:FLUT) operates a portfolio of leading online sports betting and gaming brands including FanDuel, PokerStars, Paddy Power, and Sky Betting & Gaming.
Flutter organizes its business across four geographic segments: U.S., UK & Ireland, Australia, and International, with 91% of revenue generated online. The company offers three core product categories: sportsbook (56% of revenue), where customers bet on sporting events at fixed odds; iGaming (40%), which includes casino games, poker, and lottery products; and other offerings (4%) like betting exchanges and daily fantasy sports.
In the crucial U.S. market, Flutter's FanDuel has established itself as a market leader, operating in 23 states for sports betting and 5 states for online casino. FanDuel has secured partnerships with major sports leagues including the NBA, NFL, MLB, and NHL, enhancing its brand visibility and customer acquisition.
Internationally, Flutter's portfolio includes country-specific powerhouses like Sportsbet in Australia, Paddy Power in Ireland and the UK, and Sisal in Italy. The company typically enters markets through local licensing arrangements, partnerships with land-based casinos, or via multi-jurisdictional licenses from regulatory hubs like Malta.
Flutter's technology platform allows customers to seamlessly move between betting products. For instance, a FanDuel sportsbook user in states where iGaming is permitted can access casino games directly within the sportsbook app. This cross-selling approach increases customer lifetime value while reducing acquisition costs, as a sports bettor placing wagers on Sunday football might also try blackjack or roulette during halftime.
4. Casino Operator
Casino operators enjoy limited competition because gambling is a highly regulated industry. These companies can also enjoy healthy margins and profits. Have you ever heard the phrase ‘the house always wins’? Regulation cuts both ways, however, and casinos may face stroke-of-the-pen risk that suddenly limits what they can or can't do and where they can do it. Furthermore, digitization is changing the game, pun intended. Whether it’s online poker or sports betting on your smartphone, innovation is forcing these players to adapt to changing consumer preferences, such as being able to wager anywhere on demand.
Flutter Entertainment competes with other global gambling companies including DraftKings (NASDAQ:DKNG), MGM Resorts International's BetMGM (NYSE:MGM), Entain (OTCMKTS:GMVHY), Caesars Entertainment (NASDAQ:CZR), and privately-held Bet365.
5. Revenue Growth
A company’s long-term performance is an indicator of its overall quality. Any business can put up a good quarter or two, but the best consistently grow over the long haul. Over the last five years, Flutter Entertainment grew its sales at a 29.3% compounded annual growth rate. Although this growth is acceptable on an absolute basis, it fell slightly short of our standards for the consumer discretionary sector, which enjoys a number of secular tailwinds.
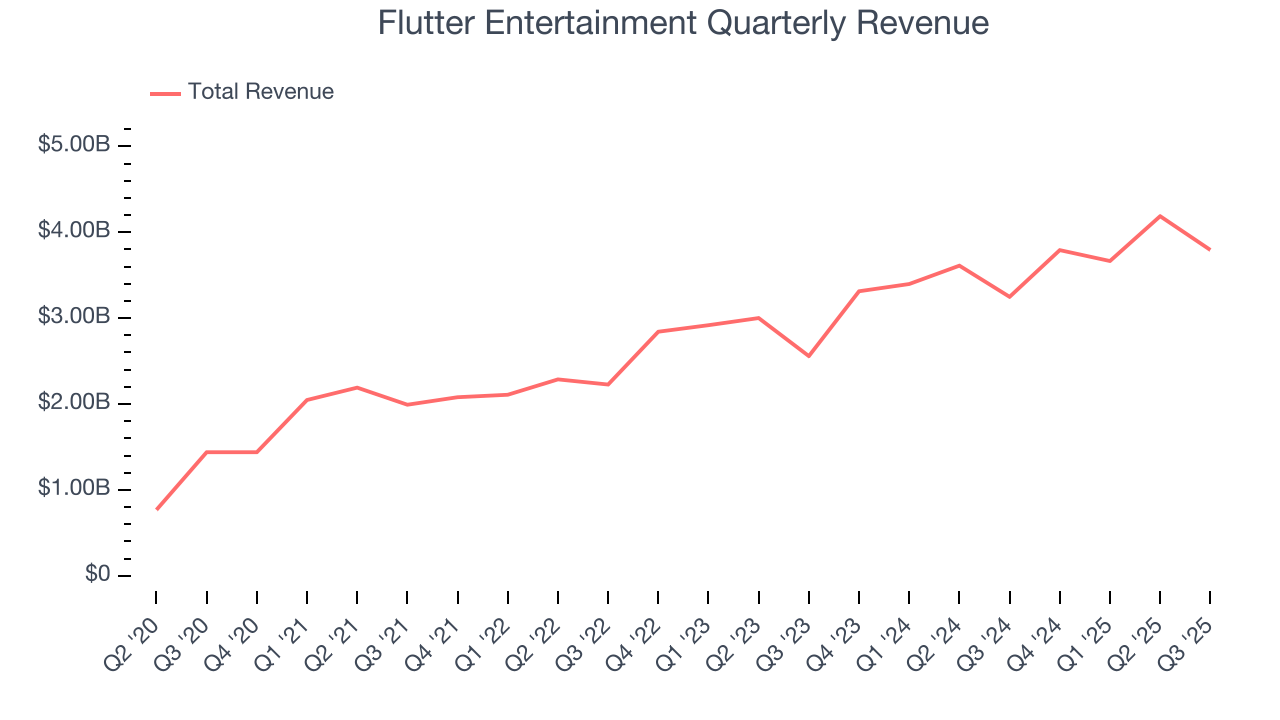
We at StockStory place the most emphasis on long-term growth, but within consumer discretionary, a stretched historical view may miss a company riding a successful new product or trend. Flutter Entertainment’s recent performance shows its demand has slowed as its annualized revenue growth of 16.8% over the last two years was below its five-year trend. Note that COVID hurt Flutter Entertainment’s business in 2020 and part of 2021, and it bounced back in a big way thereafter. 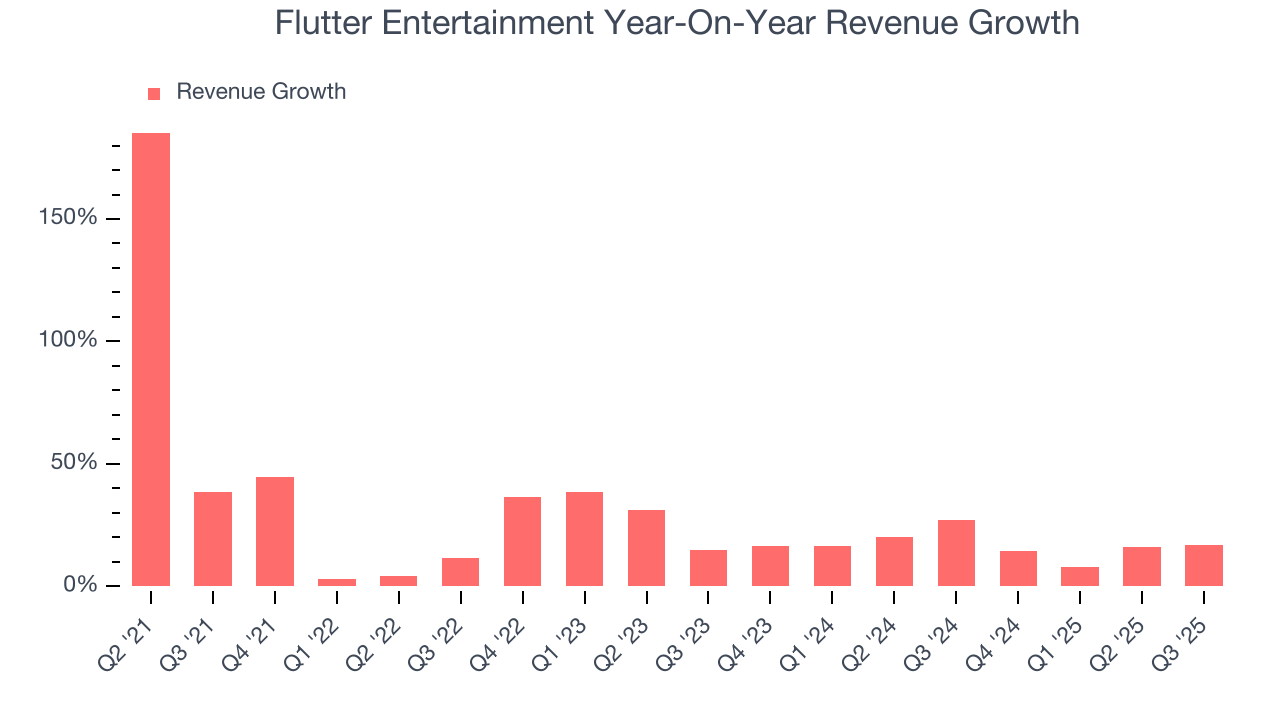
This quarter, Flutter Entertainment’s revenue grew by 16.8% year on year to $3.79 billion but fell short of Wall Street’s estimates.
Looking ahead, sell-side analysts expect revenue to grow 20.7% over the next 12 months, an improvement versus the last two years. This projection is particularly healthy for a company of its scale and suggests its newer products and services will fuel better top-line performance.
6. Operating Margin
Operating margin is an important measure of profitability as it shows the portion of revenue left after accounting for all core expenses – everything from the cost of goods sold to advertising and wages. It’s also useful for comparing profitability across companies with different levels of debt and tax rates because it excludes interest and taxes.
Flutter Entertainment’s operating margin might fluctuated slightly over the last 12 months but has generally stayed the same. The company broke even over the last two years, inadequate for a consumer discretionary business. Its large expense base and inefficient cost structure were the main culprits behind this performance.
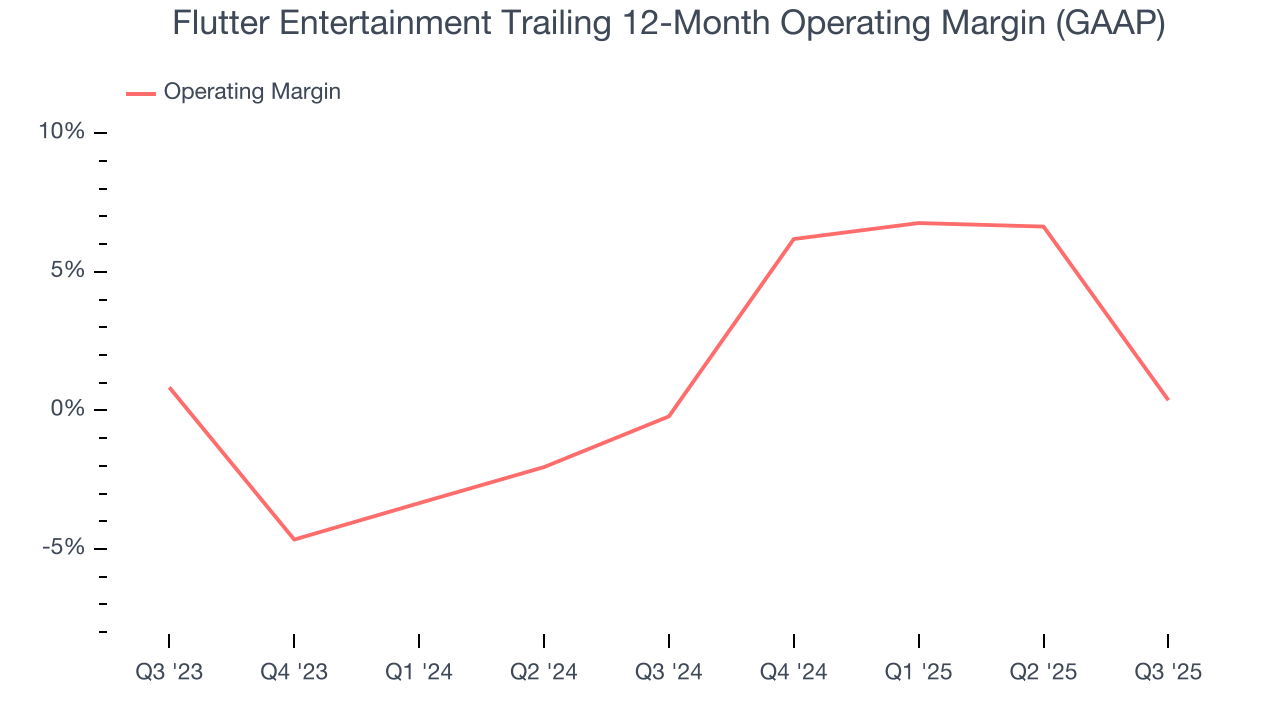
This quarter, Flutter Entertainment generated an operating margin profit margin of negative 22%, down 25 percentage points year on year. This contraction shows it was less efficient because its expenses grew faster than its revenue.
7. Earnings Per Share
Revenue trends explain a company’s historical growth, but the long-term change in earnings per share (EPS) points to the profitability of that growth – for example, a company could inflate its sales through excessive spending on advertising and promotions.
Although Flutter Entertainment’s full-year earnings are still negative, it reduced its losses and improved its EPS by 14% annually over the last four years. The next few quarters will be critical for assessing its long-term profitability.
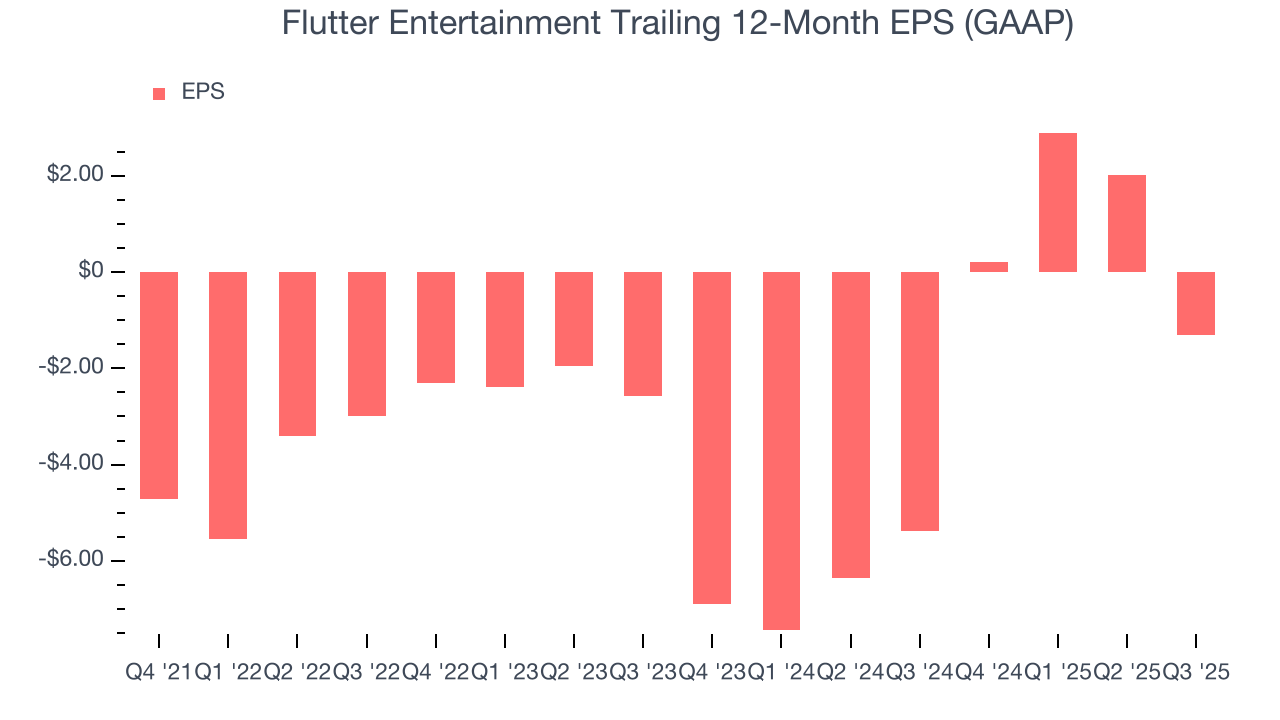
In Q3, Flutter Entertainment reported EPS of negative $3.92, down from negative $0.58 in the same quarter last year. This print missed analysts’ estimates. Over the next 12 months, Wall Street is optimistic. Analysts forecast Flutter Entertainment’s full-year EPS of negative $1.31 will flip to positive $4.46.
8. Cash Is King
Although earnings are undoubtedly valuable for assessing company performance, we believe cash is king because you can’t use accounting profits to pay the bills.
Flutter Entertainment has shown poor cash profitability over the last two years, giving the company limited opportunities to return capital to shareholders. Its free cash flow margin averaged 5.8%, lousy for a consumer discretionary business.
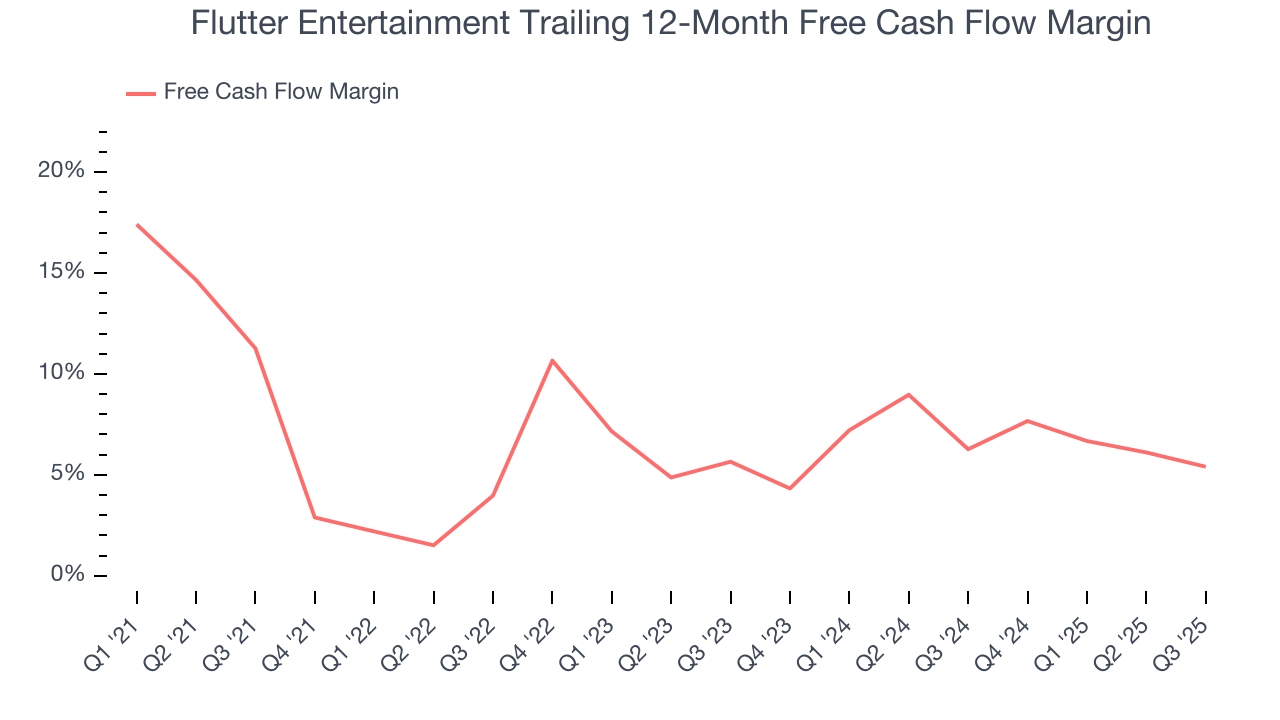
Flutter Entertainment’s free cash flow clocked in at $88 million in Q3, equivalent to a 2.3% margin. The company’s cash profitability regressed as it was 2.7 percentage points lower than in the same quarter last year, prompting us to pay closer attention. Short-term fluctuations typically aren’t a big deal because investment needs can be seasonal, but we’ll be watching to see if the trend extrapolates into future quarters.
9. Return on Invested Capital (ROIC)
EPS and free cash flow tell us whether a company was profitable while growing its revenue. But was it capital-efficient? Enter ROIC, a metric showing how much operating profit a company generates relative to the money it has raised (debt and equity).
Flutter Entertainment’s five-year average ROIC was negative 2.1%, meaning management lost money while trying to expand the business. Its returns were among the worst in the consumer discretionary sector.
We like to invest in businesses with high returns, but the trend in a company’s ROIC is what often surprises the market and moves the stock price. Fortunately, Flutter Entertainment’s ROIC averaged 2 percentage point increases over the last few years. This is a good sign, and we hope the company can continue improving.
10. Balance Sheet Assessment
Flutter Entertainment reported $3.69 billion of cash and $12.68 billion of debt on its balance sheet in the most recent quarter. As investors in high-quality companies, we primarily focus on two things: 1) that a company’s debt level isn’t too high and 2) that its interest payments are not excessively burdening the business.
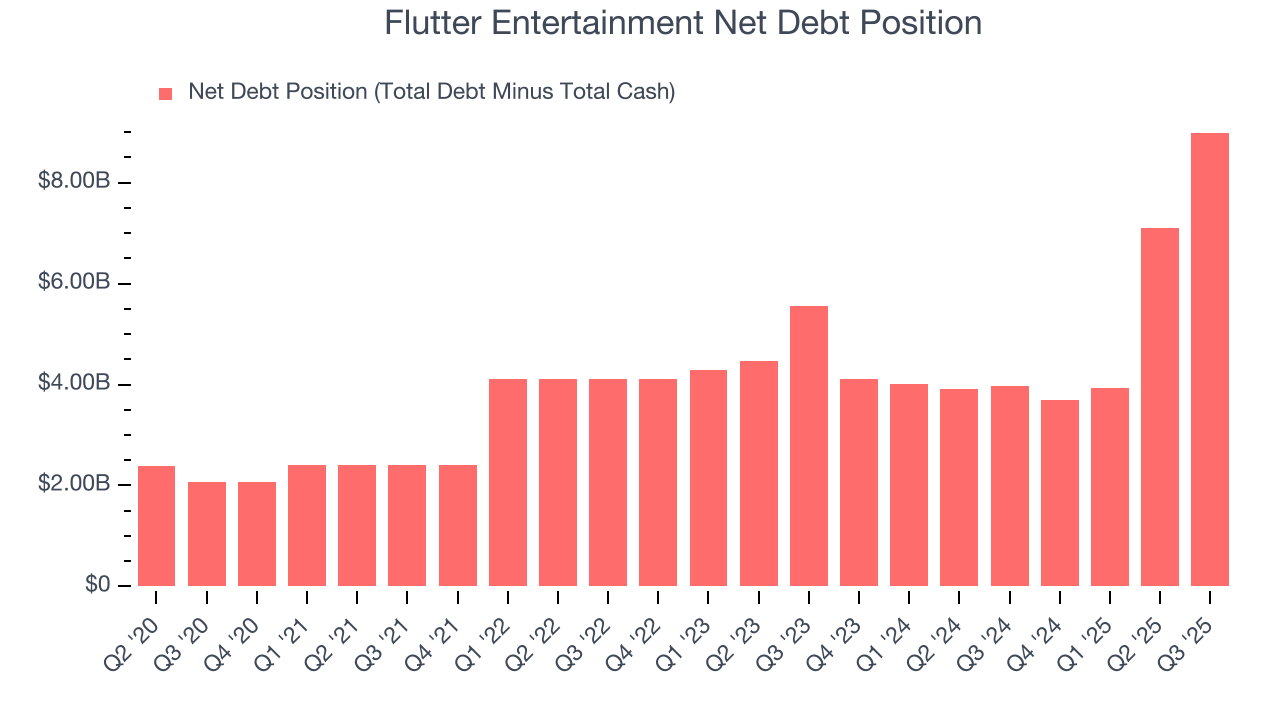
With $2.67 billion of EBITDA over the last 12 months, we view Flutter Entertainment’s 3.4× net-debt-to-EBITDA ratio as safe. We also see its $441 million of annual interest expenses as appropriate. The company’s profits give it plenty of breathing room, allowing it to continue investing in growth initiatives.
11. Key Takeaways from Flutter Entertainment’s Q3 Results
We were impressed by how significantly Flutter Entertainment blew past analysts’ EBITDA expectations this quarter. We were also excited its adjusted operating income outperformed Wall Street’s estimates by a wide margin. On the other hand, its EPS missed and its revenue fell slightly short of Wall Street’s estimates. Overall, this print was mixed but still had some key positives. The stock remained flat at $216.05 immediately following the results.
12. Is Now The Time To Buy Flutter Entertainment?
Updated: February 16, 2026 at 12:02 AM EST
We think that the latest earnings result is only one piece of the bigger puzzle. If you’re deciding whether to own Flutter Entertainment, you should also grasp the company’s longer-term business quality and valuation.
Flutter Entertainment doesn’t pass our quality test. While its projected EPS for the next year implies the company’s fundamentals will improve, the downside is its Forecasted free cash flow margin suggests the company will have more capital to invest or return to shareholders next year. On top of that, its weak EPS growth over the last four years shows it’s failed to produce meaningful profits for shareholders.
Flutter Entertainment’s P/E ratio based on the next 12 months is 18.3x. While this valuation is fair, the upside isn’t great compared to the potential downside. There are better investments elsewhere.
Wall Street analysts have a consensus one-year price target of $273.63 on the company (compared to the current share price of $125.20).
Although the price target is bullish, readers should exercise caution because analysts tend to be overly optimistic. The firms they work for, often big banks, have relationships with companies that extend into fundraising, M&A advisory, and other rewarding business lines. As a result, they typically hesitate to say bad things for fear they will lose out. We at StockStory do not suffer from such conflicts of interest, so we’ll always tell it like it is.