
F.N.B. Corporation (FNB)
We’re wary of F.N.B. Corporation. Its weak sales growth and low returns on capital show it struggled to generate demand and profits.― StockStory Analyst Team
1. News


2. Summary
Why We Think F.N.B. Corporation Will Underperform
Tracing its roots back to 1864 during the Civil War era, F.N.B. Corporation (NYSE:FNB) is a diversified financial services holding company that provides banking, wealth management, and insurance services to consumers and businesses across seven states and Washington, D.C.
- Net interest margin of 3.2% reflects its high servicing and capital costs
- 7.3% annual revenue growth over the last five years was slower than its banking peers
- A positive is that its annual tangible book value per share growth of 8.5% over the last five years was superb and indicates its capital strength increased during this cycle


F.N.B. Corporation lacks the business quality we seek. We’re redirecting our focus to better businesses.
Why There Are Better Opportunities Than F.N.B. Corporation


F.N.B. Corporation’s stock price of $16.03 implies a valuation ratio of 0.8x forward P/B. This sure is a cheap multiple, but you get what you pay for.
Cheap stocks can look like great bargains at first glance, but you often get what you pay for. These mediocre businesses often have less earnings power, meaning there is more reliance on a re-rating to generate good returns - an unlikely scenario for low-quality companies.
3. F.N.B. Corporation (FNB) Research Report: Q4 CY2025 Update
Regional banking company F.N.B. Corporation (NYSE:FNB) met Wall Streets revenue expectations in Q4 CY2025, with sales up 11.6% year on year to $457.8 million. Its non-GAAP profit of $0.50 per share was 22.7% above analysts’ consensus estimates.
F.N.B. Corporation (FNB) Q4 CY2025 Highlights:
- Net Interest Income: $365.4 million vs analyst estimates of $367.2 million (13.5% year-on-year growth, in line)
- Net Interest Margin: 3.3% vs analyst estimates of 3.3% (in line)
- Revenue: $457.8 million vs analyst estimates of $458.3 million (11.6% year-on-year growth, in line)
- Efficiency Ratio: 53.8% vs analyst estimates of 53.3% (54.7 basis point miss)
- Adjusted EPS: $0.50 vs analyst estimates of $0.41 (22.7% beat)
- Tangible Book Value per Share: $11.87 vs analyst estimates of $11.78 (13.1% year-on-year growth, 0.8% beat)
- Market Capitalization: $6.22 billion
Company Overview
Tracing its roots back to 1864 during the Civil War era, F.N.B. Corporation (NYSE:FNB) is a diversified financial services holding company that provides banking, wealth management, and insurance services to consumers and businesses across seven states and Washington, D.C.
F.N.B. operates primarily through its largest subsidiary, First National Bank of Pennsylvania (FNBPA), which forms the core of its Community Banking segment. This segment offers a comprehensive range of financial products including commercial loans, small business banking, investment real estate financing, and consumer banking services like mortgages and personal loans. The bank maintains a significant presence in major metropolitan areas including Pittsburgh, Baltimore, Cleveland, Washington D.C., and several cities in North Carolina and South Carolina.
Beyond traditional banking, F.N.B. provides wealth management services through three subsidiaries that offer fiduciary services, investment products, and registered investment advisory services. These entities primarily serve individuals, corporations, and retirement funds within F.N.B.'s geographic footprint. For example, a business owner might use F.N.B.'s commercial banking services for company operations while simultaneously working with their wealth management division for personal retirement planning.
The company's Insurance segment operates through a full-service brokerage agency offering commercial and personal insurance products from major carriers. F.N.B. also maintains specialized subsidiaries like F.N.B. Capital Corporation, which provides mezzanine financing for businesses that need funding beyond typical commercial loans. The company generates revenue primarily through interest income on loans, fees from banking services, commissions from wealth management and insurance products, and merchant banking activities.
4. Regional Banks
Regional banks, financial institutions operating within specific geographic areas, serve as intermediaries between local depositors and borrowers. They benefit from rising interest rates that improve net interest margins (the difference between loan yields and deposit costs), digital transformation reducing operational expenses, and local economic growth driving loan demand. However, these banks face headwinds from fintech competition, deposit outflows to higher-yielding alternatives, credit deterioration (increasing loan defaults) during economic slowdowns, and regulatory compliance costs. Recent concerns about regional bank stability following high-profile failures and significant commercial real estate exposure present additional challenges.
F.N.B. Corporation competes with other regional banks operating in the Mid-Atlantic and Southeast regions, including PNC Financial Services (NYSE:PNC), Truist Financial (NYSE:TFC), M&T Bank (NYSE:MTB), and KeyCorp (NYSE:KEY).
5. Sales Growth
Net interest income and and fee-based revenue are the two pillars supporting bank earnings. The former captures profit from the gap between lending rates and deposit costs, while the latter encompasses charges for banking services, credit products, wealth management, and trading activities. Unfortunately, F.N.B. Corporation’s 7.3% annualized revenue growth over the last five years was tepid. This was below our standard for the banking sector and is a tough starting point for our analysis.
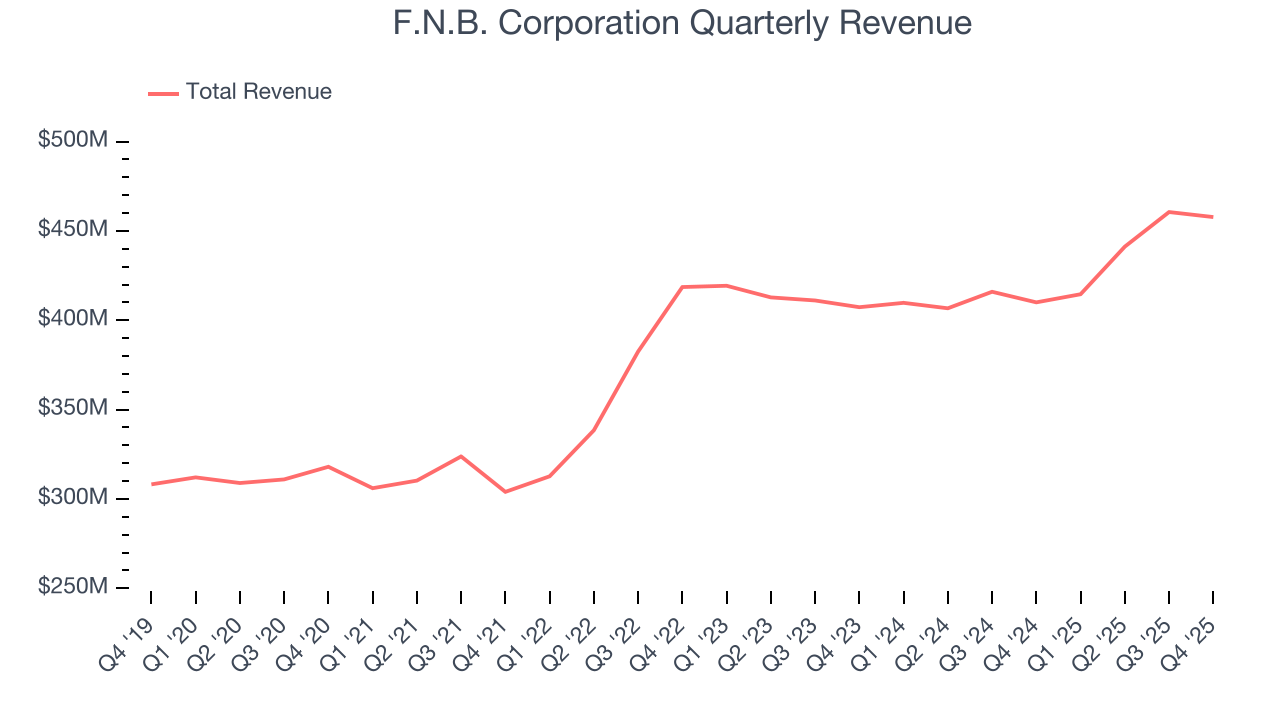
We at StockStory place the most emphasis on long-term growth, but within financials, a half-decade historical view may miss recent interest rate changes, market returns, and industry trends. F.N.B. Corporation’s recent performance shows its demand has slowed as its annualized revenue growth of 3.7% over the last two years was below its five-year trend. 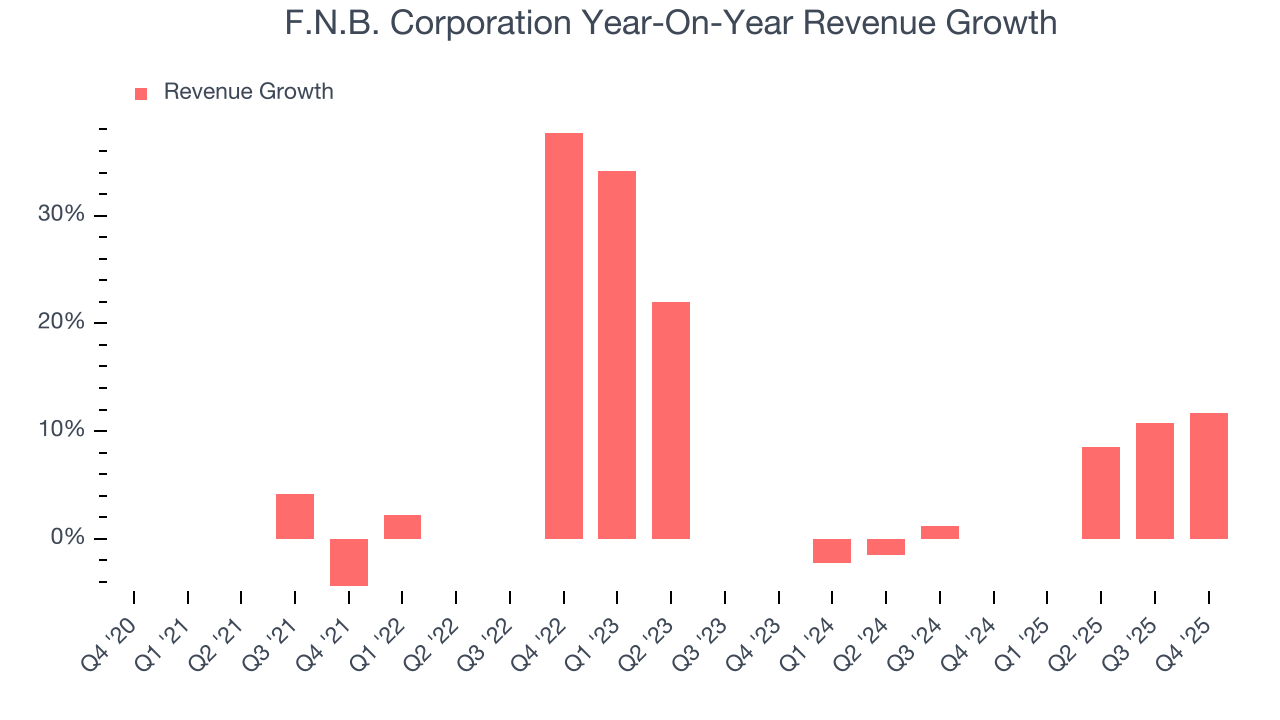 Note: Quarters not shown were determined to be outliers, impacted by outsized investment gains/losses that are not indicative of the recurring fundamentals of the business.
This quarter, F.N.B. Corporation’s year-on-year revenue growth was 11.6%, and its $457.8 million of revenue was in line with Wall Street’s estimates.
Net interest income made up 77.2% of the company’s total revenue during the last five years, meaning lending operations are F.N.B. Corporation’s largest source of revenue.
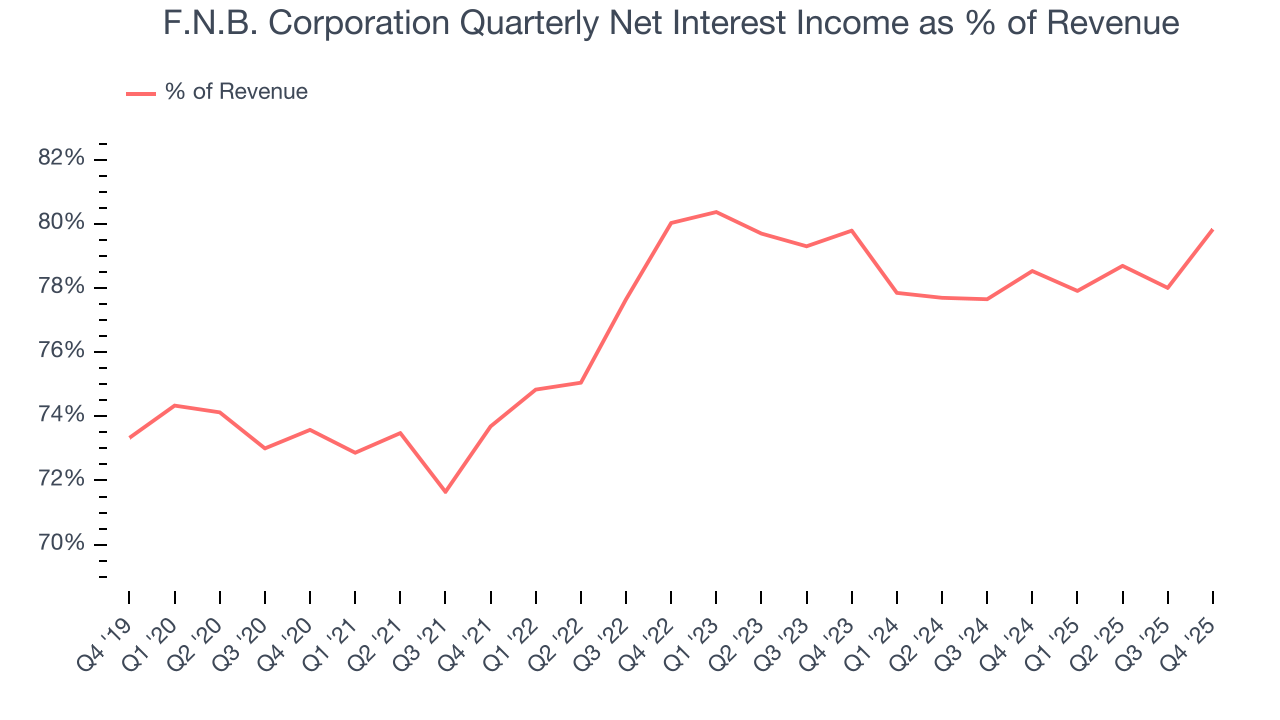
Net interest income commands greater market attention due to its reliability and consistency, whereas non-interest income is often seen as lower-quality revenue that lacks the same dependable characteristics.
6. Efficiency Ratio
The underlying profitability of top-line growth determines the actual bottom-line impact. Banking institutions measure this dynamic using the efficiency ratio, which is calculated by dividing non-interest expenses like personnel, facilities, technology, and marketing by total revenue.
Investors place greater emphasis on efficiency ratio movements than absolute values, understanding that expense structures reflect revenue mix variations. Lower ratios represent better operational performance since they show banks generating more revenue per dollar of expense.
Over the last four years, F.N.B. Corporation’s efficiency ratio has swelled by 2.1 percentage points, going from 57% to 54.9%. Said differently, the company’s expenses have grown at a slower rate than revenue, which typically signals prudent management.
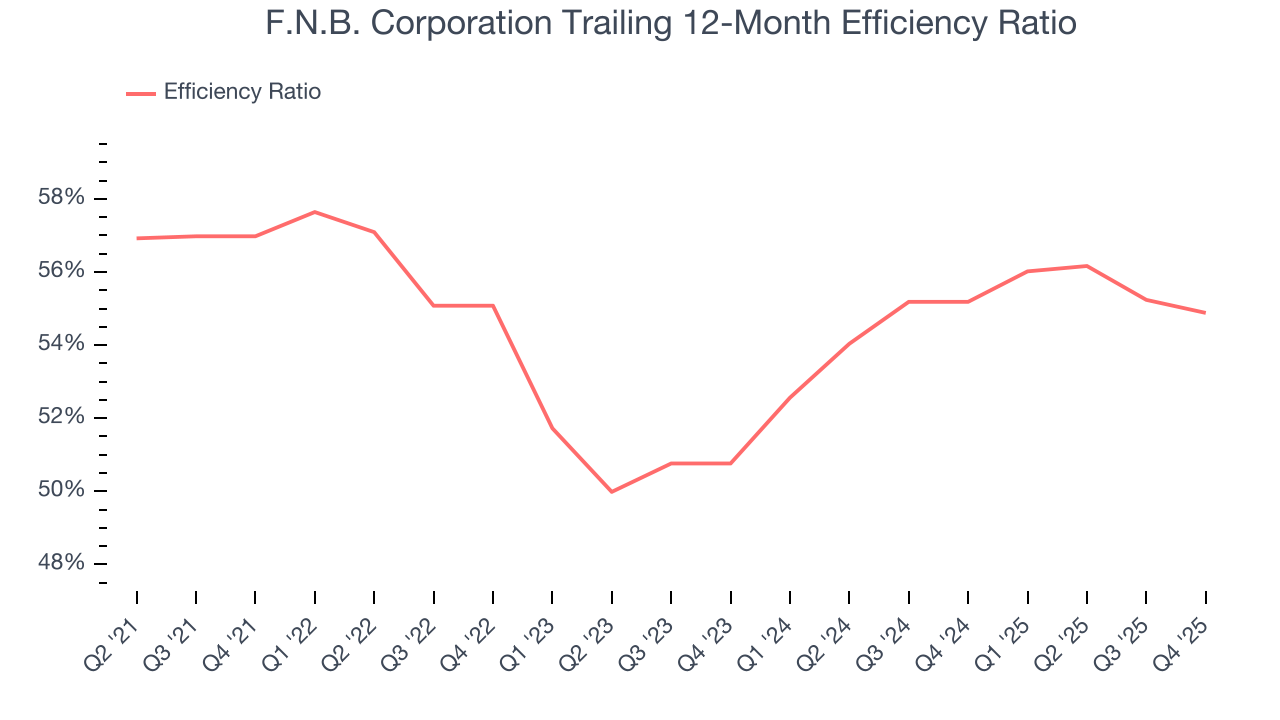
F.N.B. Corporation’s efficiency ratio came in at 53.8% this quarter, falling short of analysts’ expectations by 54.7 basis points (100 basis points = 1 percentage point).
For the next 12 months, Wall Street expects F.N.B. Corporation to rein in some of its expenses as it anticipates an efficiency ratio of 53.1%.
7. Earnings Per Share
We track the long-term change in earnings per share (EPS) for the same reason as long-term revenue growth. Compared to revenue, however, EPS highlights whether a company’s growth is profitable.
F.N.B. Corporation’s EPS grew at a decent 10.6% compounded annual growth rate over the last five years, higher than its 7.3% annualized revenue growth. However, we take this with a grain of salt because its efficiency ratio didn’t improve and it didn’t repurchase its shares, meaning the delta came from factors we consider non-core or less sustainable over the long term.
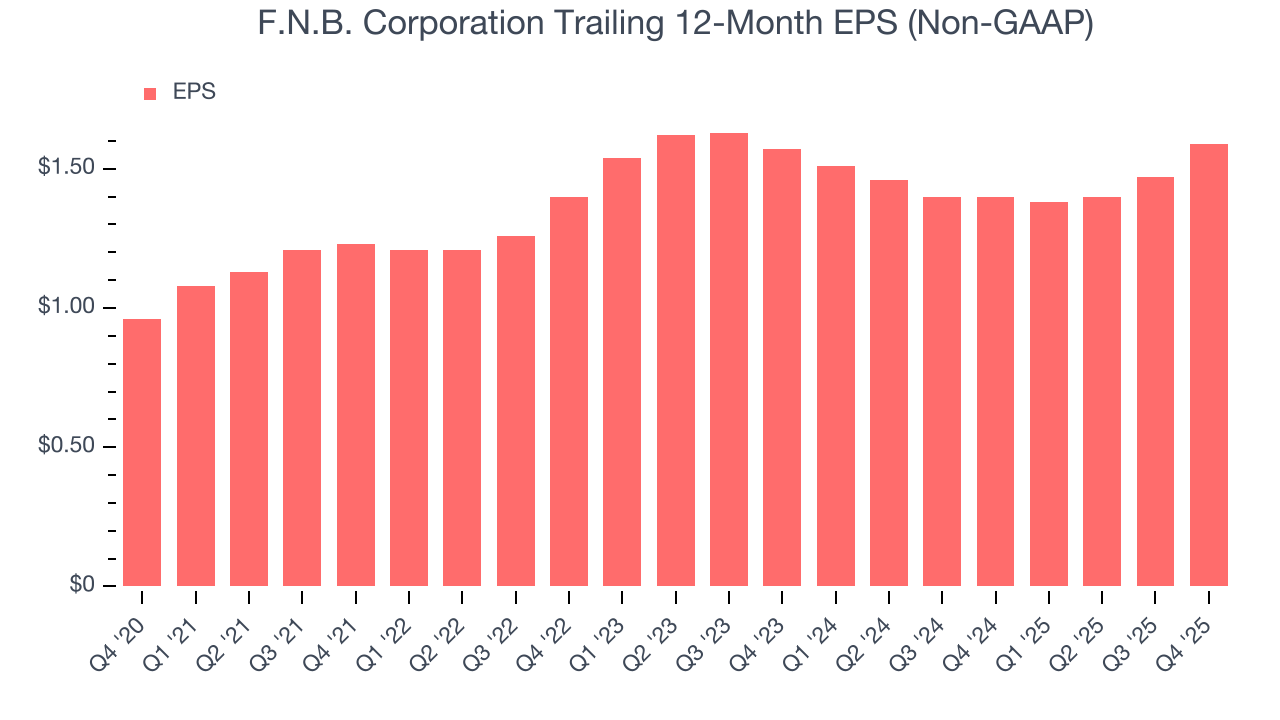
Like with revenue, we analyze EPS over a more recent period because it can provide insight into an emerging theme or development for the business.
For F.N.B. Corporation, EPS didn’t budge over the last two years, a regression from its five-year trend. We hope it can revert to earnings growth in the coming years.
In Q4, F.N.B. Corporation reported adjusted EPS of $0.50, up from $0.38 in the same quarter last year. This print easily cleared analysts’ estimates, and shareholders should be content with the results. Over the next 12 months, Wall Street expects F.N.B. Corporation’s full-year EPS of $1.59 to grow 7%.
8. Tangible Book Value Per Share (TBVPS)
The balance sheet drives banking profitability since earnings flow from the spread between borrowing and lending rates. As such, valuations for these companies concentrate on capital strength and sustainable equity accumulation potential.
When analyzing banks, tangible book value per share (TBVPS) takes precedence over many other metrics. This measure isolates genuine per-share value by removing intangible assets of debatable liquidation worth. EPS can become murky due to acquisition impacts or accounting flexibility around loan provisions, and TBVPS resists financial engineering manipulation.
F.N.B. Corporation’s TBVPS grew at an excellent 8.5% annual clip over the last five years. TBVPS growth has also accelerated recently, growing by 12% annually over the last two years from $9.47 to $11.87 per share.
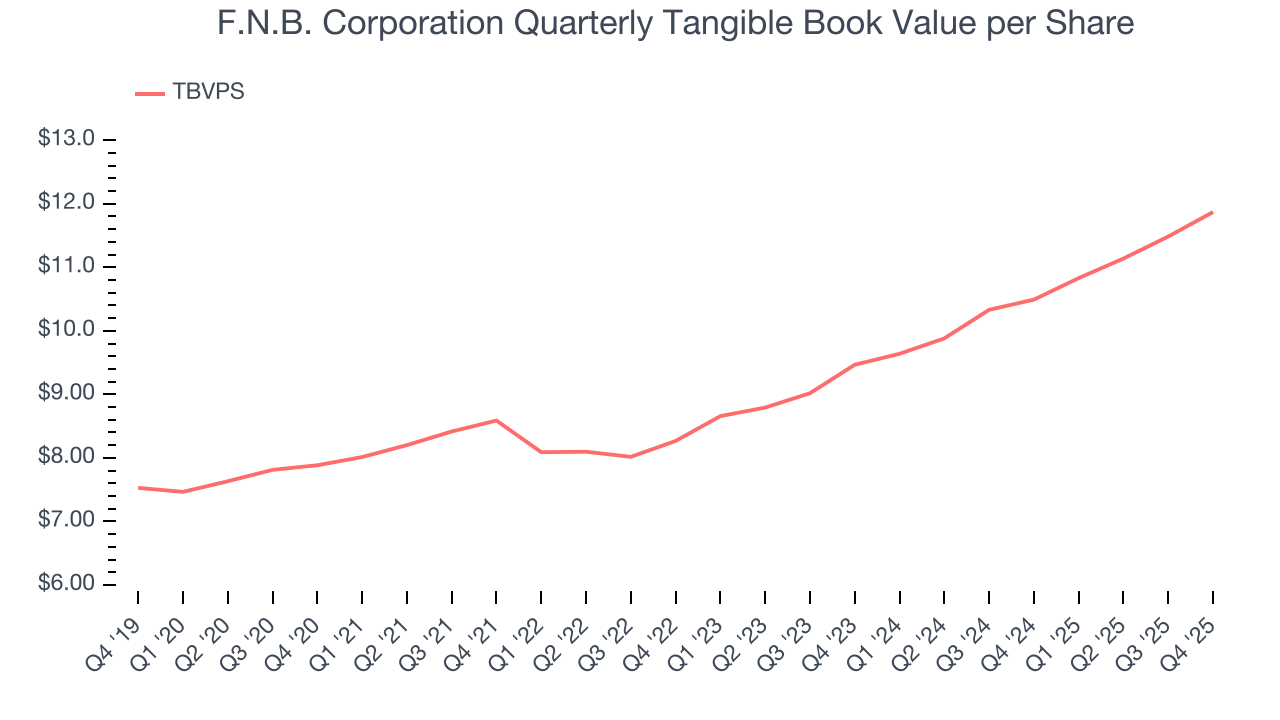
Over the next 12 months, Consensus estimates call for F.N.B. Corporation’s TBVPS to grow by 9.5% to $12.99, paltry growth rate.
9. Balance Sheet Assessment
Leverage is core to a financial firm’s business model (loans funded by deposits). To ensure economic stability and avoid a repeat of the 2008 GFC, regulators require certain levels of capital and liquidity, focusing on the Tier 1 capital ratio.
Tier 1 capital is the highest-quality capital that a firm holds, consisting primarily of common stock and retained earnings, but also physical gold. It serves as the primary cushion against losses and is the first line of defense in times of financial distress.
This capital is divided by risk-weighted assets to derive the Tier 1 capital ratio. Risk-weighted means that cash and US treasury securities are assigned little risk while unsecured consumer loans and equity investments get much higher risk weights, for example.
New regulation after the 2008 financial crisis requires that all firms must maintain a Tier 1 capital ratio greater than 4.5%. On top of this, there are additional buffers based on scale, risk profile, and other regulatory classifications, so that at the end of the day, firms generally must maintain a 7-10% ratio at minimum.
Over the last two years, F.N.B. Corporation has averaged a Tier 1 capital ratio of 10.7%, which is considered safe and well capitalized in the event that macro or market conditions suddenly deteriorate.
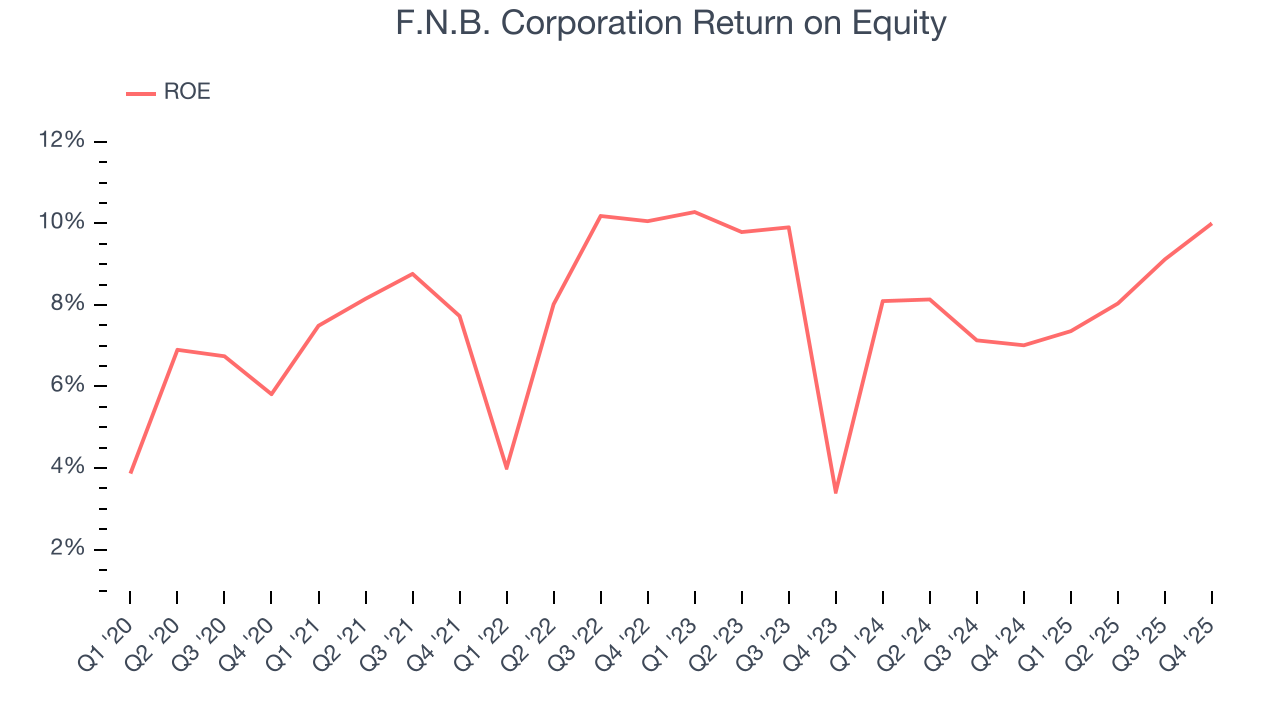
10. Return on Equity
Return on equity (ROE) reveals the profit generated per dollar of shareholder equity, which represents a key source of bank funding. Banks maintaining elevated ROE levels tend to accelerate wealth creation for shareholders via earnings retention, buybacks, and distributions.
Over the last five years, F.N.B. Corporation has averaged an ROE of 8.1%, uninspiring for a company operating in a sector where the average shakes out around 7.5%.
11. Key Takeaways from F.N.B. Corporation’s Q4 Results
It was good to see F.N.B. Corporation beat analysts’ EPS expectations this quarter. We were also happy its tangible book value per share narrowly outperformed Wall Street’s estimates. On the other hand, its net interest income was in line. Overall, this print had some key positives. The stock traded up 1.9% to $17.60 immediately after reporting.
12. Is Now The Time To Buy F.N.B. Corporation?
Updated: March 17, 2026 at 1:15 AM EDT
We think that the latest earnings result is only one piece of the bigger puzzle. If you’re deciding whether to own F.N.B. Corporation, you should also grasp the company’s longer-term business quality and valuation.
F.N.B. Corporation isn’t a terrible business, but it doesn’t pass our quality test. First off, its revenue growth was uninspiring over the last five years, and analysts don’t see anything changing over the next 12 months. While its TBVPS growth was impressive over the last five years, the downside is its declining net interest margin shows its loan book is becoming less profitable. On top of that, its net interest margin makes it more difficult to reach positive operating profits compared to other bank businesses.
F.N.B. Corporation’s P/B ratio based on the next 12 months is 0.8x. While this valuation is optically cheap, the potential downside is big given its shaky fundamentals. We're pretty confident there are superior stocks to buy right now.
Wall Street analysts have a consensus one-year price target of $20.06 on the company (compared to the current share price of $16.03).
Although the price target is bullish, readers should exercise caution because analysts tend to be overly optimistic. The firms they work for, often big banks, have relationships with companies that extend into fundraising, M&A advisory, and other rewarding business lines. As a result, they typically hesitate to say bad things for fear they will lose out. We at StockStory do not suffer from such conflicts of interest, so we’ll always tell it like it is.