Gap (GAP)
We’re skeptical of Gap. Not only are its sales cratering but also its low returns on capital suggest it struggles to generate profits.― StockStory Analyst Team
1. News
2. Summary
Why We Think Gap Will Underperform
Operating under the Gap, Old Navy, Banana Republic, and Athleta brands, Gap (NYSE:GAP) is an apparel and accessories retailer selling casual clothing to men, women, and children.
- Below-average returns on capital indicate management struggled to find compelling investment opportunities
- Operating margin falls short of the industry average, and the smaller profit dollars make it harder to react to unexpected market developments
- A positive is that its $15.28 billion in revenue gives its scale, which leads to bargaining power with suppliers and retailers


Gap lacks the business quality we seek. Better stocks can be found in the market.
Why There Are Better Opportunities Than Gap
High Quality
Investable
Underperform
Why There Are Better Opportunities Than Gap
Gap is trading at $28.63 per share, or 12.5x forward P/E. While valuation is appropriate for the quality you get, we’re still not buyers.
We’d rather invest in similarly-priced but higher-quality companies with more reliable earnings growth.
3. Gap (GAP) Research Report: Q3 CY2025 Update
Clothing and accessories retailer Gap (NYSE:GAP) beat Wall Street’s revenue expectations in Q3 CY2025, with sales up 3% year on year to $3.94 billion. Its GAAP profit of $0.62 per share was 5.6% above analysts’ consensus estimates.
Gap (GAP) Q3 CY2025 Highlights:
- Revenue: $3.94 billion vs analyst estimates of $3.91 billion (3% year-on-year growth, 0.8% beat)
- EPS (GAAP): $0.62 vs analyst estimates of $0.59 (5.6% beat)
- Adjusted EBITDA: $459 million vs analyst estimates of $398.8 million (11.6% margin, 15.1% beat)
- Operating Margin: 8.5%, in line with the same quarter last year
- Free Cash Flow Margin: 3.9%, similar to the same quarter last year
- Same-Store Sales rose 5% year on year (1% in the same quarter last year)
- Market Capitalization: $8.71 billion
Company Overview
Operating under the Gap, Old Navy, Banana Republic, and Athleta brands, Gap (NYSE:GAP) is an apparel and accessories retailer selling casual clothing to men, women, and children.
The core customer is therefore broad, and the aesthetic is a mix of timeless and trendy Americana. For example, Gap has always been a good place to find a classic pair of khakis for work. It can also be a destination for a jacket that is a bit more trendy and fashion-forward. Prices tend to be towards the affordable end of the spectrum, with frequent sales further enticing customers.
Old Navy features the lowest prices and is the most casual in style. Banana Republic is the most upscale and this is reflected in its prices. The Gap brand sits in the middle regarding price and style. Athleta, acquired in 2008, offers women’s athleisure clothing such as yoga pants and sports bras.
Gap’s stores, regardless of brand, are roughly 5,000 square feet and located in malls or shopping centers. They are organized in a similar manner to other clothing retailers, with sections for men, women, and children as well as centralized displays for promoted or seasonal items. Gap has an e-commerce presence for each of its brands that gives customers various shopping options.
4. Apparel Retailer
Apparel sales are not driven so much by personal needs but by seasons, trends, and innovation, and over the last few decades, the category has shifted meaningfully online. Retailers that once only had brick-and-mortar stores are responding with omnichannel presences. The online shopping experience continues to improve and retail foot traffic in places like shopping malls continues to stall, so the evolution of clothing sellers marches on.
Retailers offering casual yet trendy apparel for men, women, and children include H&M (OM:HMB), Inditex (BME:ITX) which owns Zara, Abercrombie & Fitch (NYSE:ANF), and American Eagle Outfitters (NYSE:AEO).
5. Revenue Growth
A company’s long-term sales performance can indicate its overall quality. Any business can have short-term success, but a top-tier one grows for years.
With $15.28 billion in revenue over the past 12 months, Gap is one of the larger companies in the consumer retail industry and benefits from a well-known brand that influences purchasing decisions. However, its scale is a double-edged sword because it’s harder to find incremental growth when you’ve penetrated most of the market. To accelerate sales, Gap likely needs to optimize its pricing or lean into international expansion.
As you can see below, Gap’s revenue declined by 1.1% per year over the last six years (we compare to 2019 to normalize for COVID-19 impacts) despite opening new stores and expanding its reach.
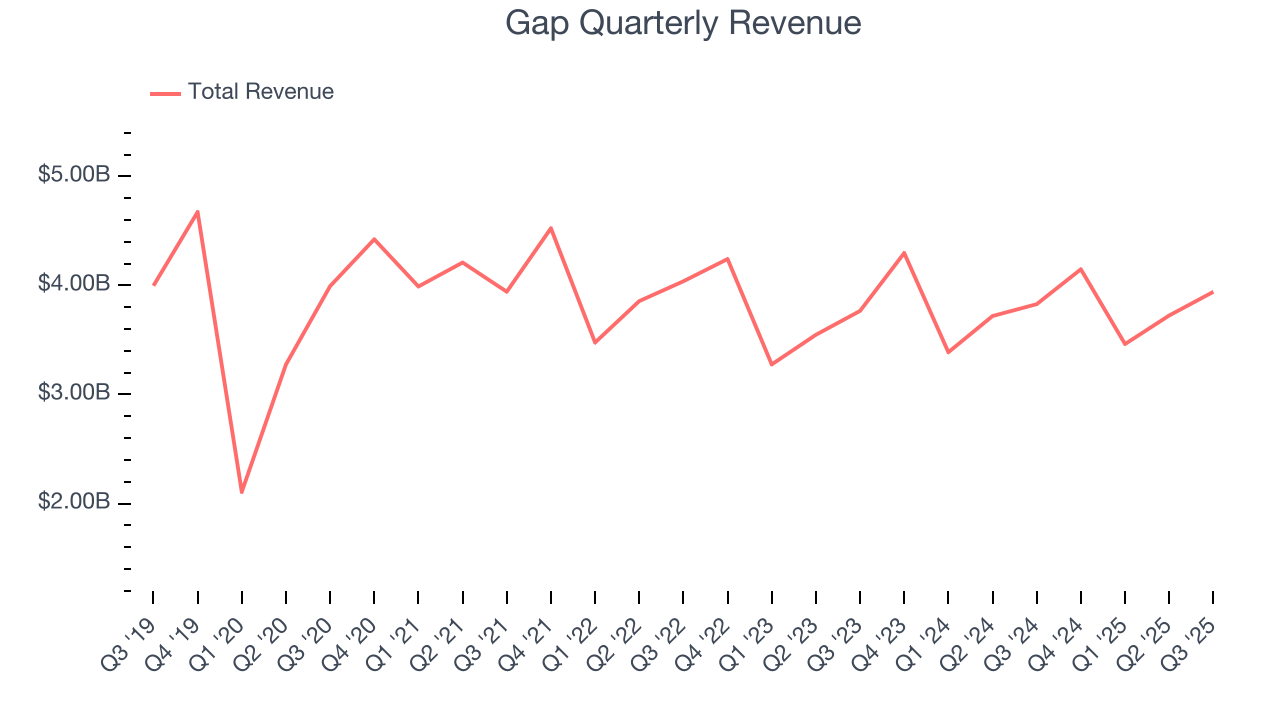
This quarter, Gap reported modest year-on-year revenue growth of 3% but beat Wall Street’s estimates by 0.8%.
Looking ahead, sell-side analysts expect revenue to grow 1.9% over the next 12 months. While this projection indicates its newer products will catalyze better top-line performance, it is still below average for the sector.
6. Store Performance
Number of Stores
A retailer’s store count often determines how much revenue it can generate.
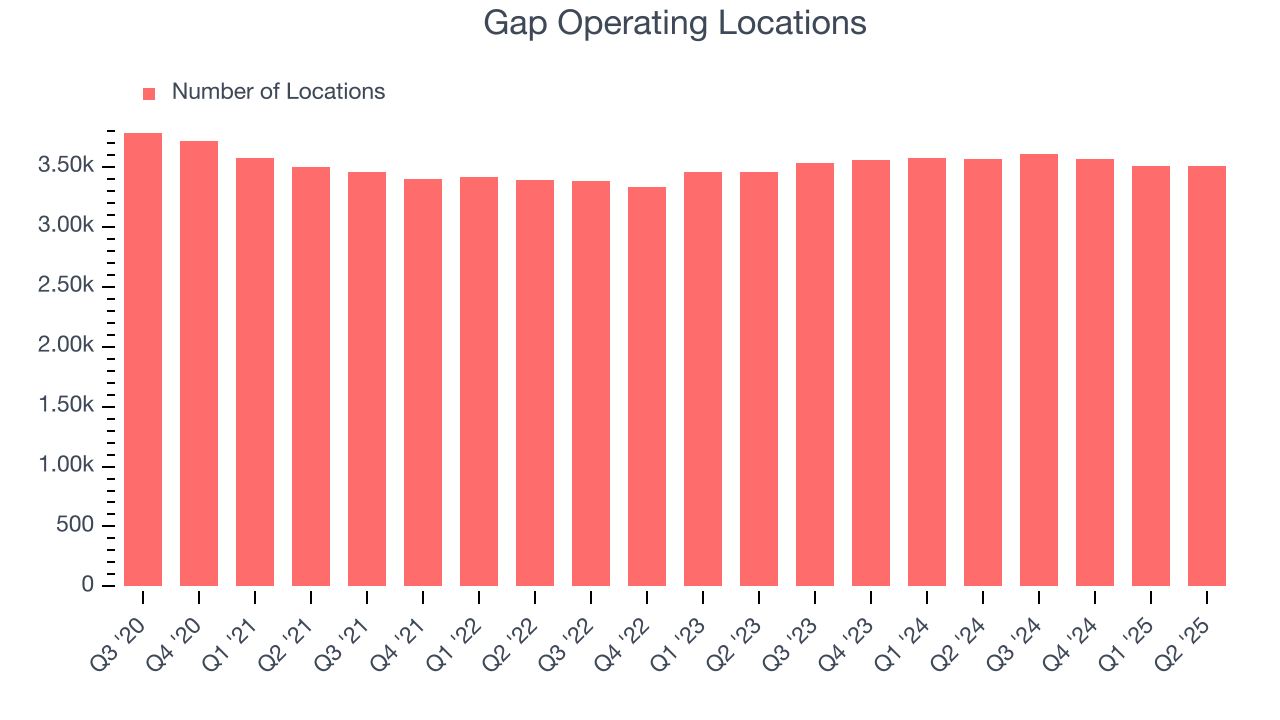
Gap opened new stores quickly over the last two years, averaging 1.8% annual growth, faster than the broader consumer retail sector.
When a retailer opens new stores, it usually means it’s investing for growth because demand is greater than supply, especially in areas where consumers may not have a store within reasonable driving distance.
Note that Gap reports its store count intermittently, so some data points are missing in the chart below.
Same-Store Sales
The change in a company's store base only tells one side of the story. The other is the performance of its existing locations and e-commerce sales, which informs management teams whether they should expand or downsize their physical footprints. Same-store sales gives us insight into this topic because it measures organic growth for a retailer's e-commerce platform and brick-and-mortar shops that have existed for at least a year.
Gap’s demand rose over the last two years and slightly outpaced the industry. On average, the company’s same-store sales have grown by 2.3% per year. This performance suggests its rollout of new stores could be beneficial for shareholders. When a retailer has demand, more locations should help it reach more customers and boost revenue growth.
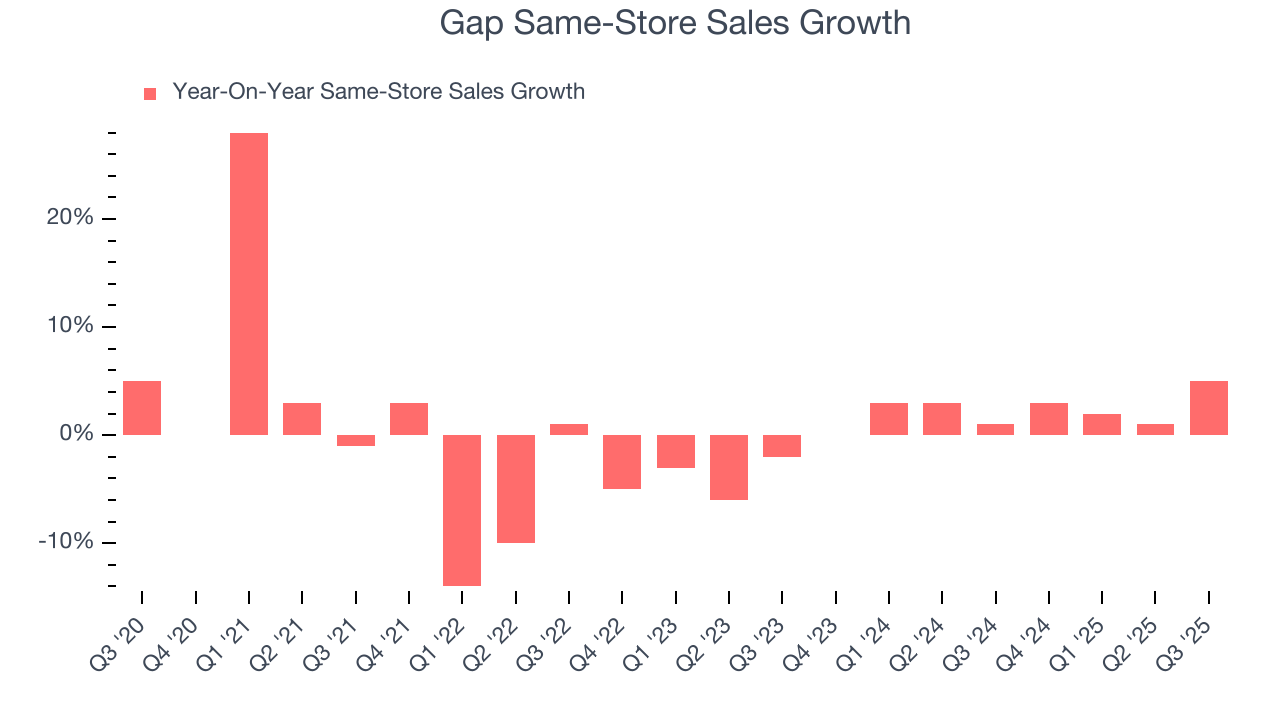
In the latest quarter, Gap’s same-store sales rose 5% year on year. This growth was an acceleration from its historical levels, which is always an encouraging sign.
7. Gross Margin & Pricing Power
At StockStory, we prefer high gross margin businesses because they indicate pricing power or differentiated products, giving the company a chance to generate higher operating profits.
Gap has great unit economics for a retailer, giving it ample room to invest in areas such as marketing and talent to grow its brand. As you can see below, it averaged an excellent 41.1% gross margin over the last two years. That means for every $100 in revenue, only $58.86 went towards paying for inventory, transportation, and distribution. 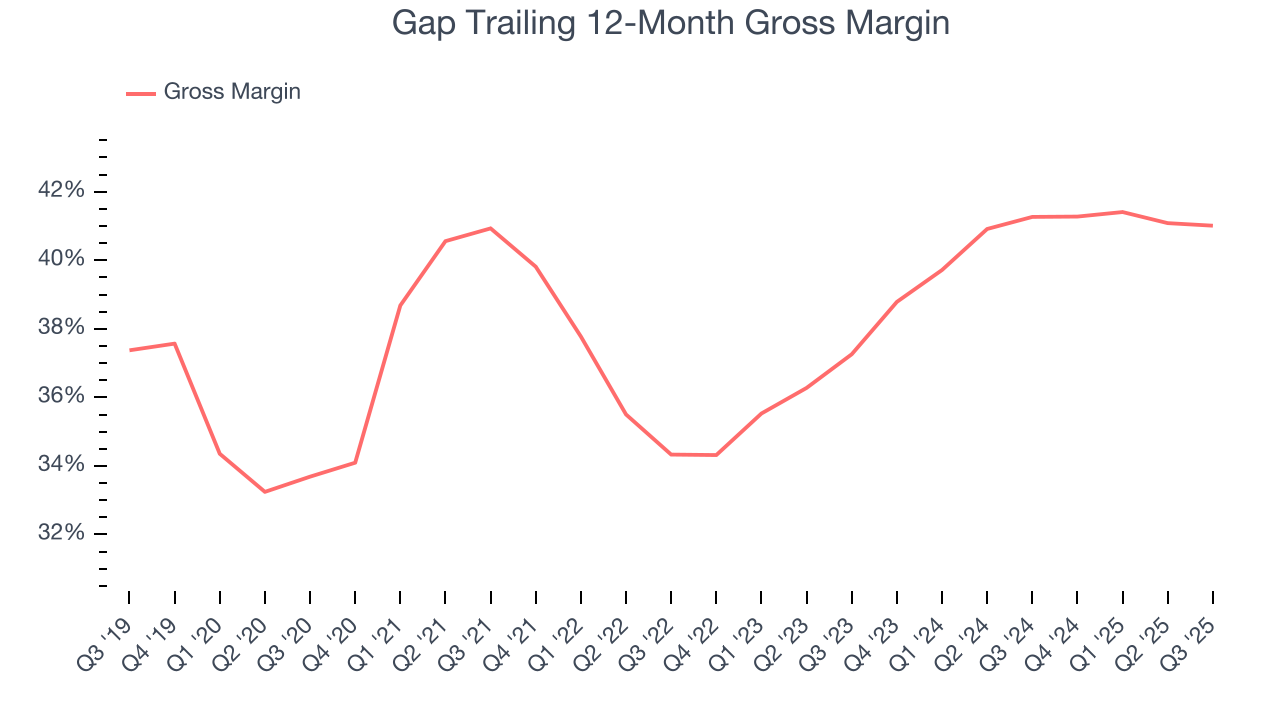
Gap’s gross profit margin came in at 42.4% this quarter, in line with the same quarter last year. On a wider time horizon, the company’s full-year margin has remained steady over the past four quarters, suggesting it strives to keep prices low for customers and has stable input costs (such as labor and freight expenses to transport goods).
8. Operating Margin
Gap’s operating margin might fluctuated slightly over the last 12 months but has generally stayed the same, averaging 7.2% over the last two years. This profitability was mediocre for a consumer retail business and caused by its suboptimal cost structure.
Looking at the trend in its profitability, Gap’s operating margin might fluctuated slightly but has generally stayed the same over the last year, meaning it will take a fundamental shift in the business model to change.
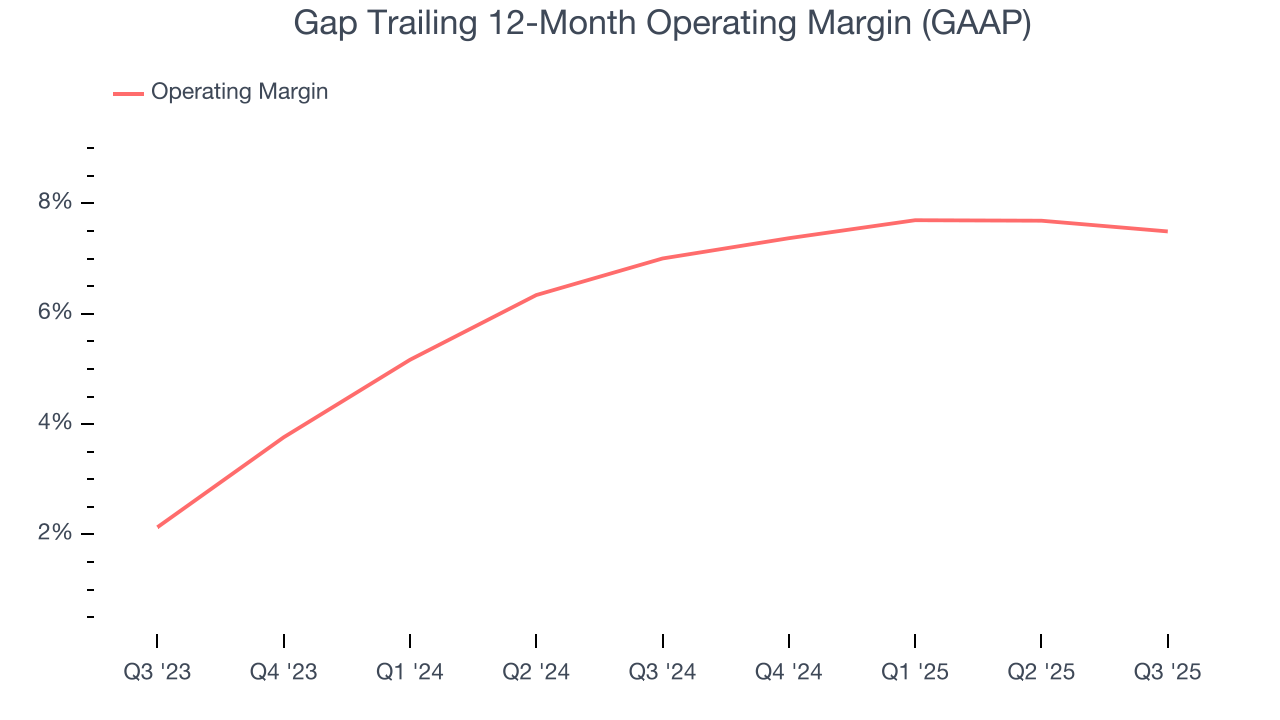
In Q3, Gap generated an operating margin profit margin of 8.5%, in line with the same quarter last year. This indicates the company’s cost structure has recently been stable.
9. Cash Is King
Although earnings are undoubtedly valuable for assessing company performance, we believe cash is king because you can’t use accounting profits to pay the bills.
Gap has shown robust cash profitability, driven by its attractive business model that enables it to reinvest or return capital to investors. The company’s free cash flow margin averaged 6.2% over the last two years, quite impressive for a consumer retail business. The divergence from its underwhelming operating margin stems from the add-back of non-cash charges like depreciation and stock-based compensation. GAAP operating profit expenses these line items, but free cash flow does not.
Taking a step back, we can see that Gap’s margin dropped by 2.2 percentage points over the last year. This decrease came from the higher costs associated with opening more stores.
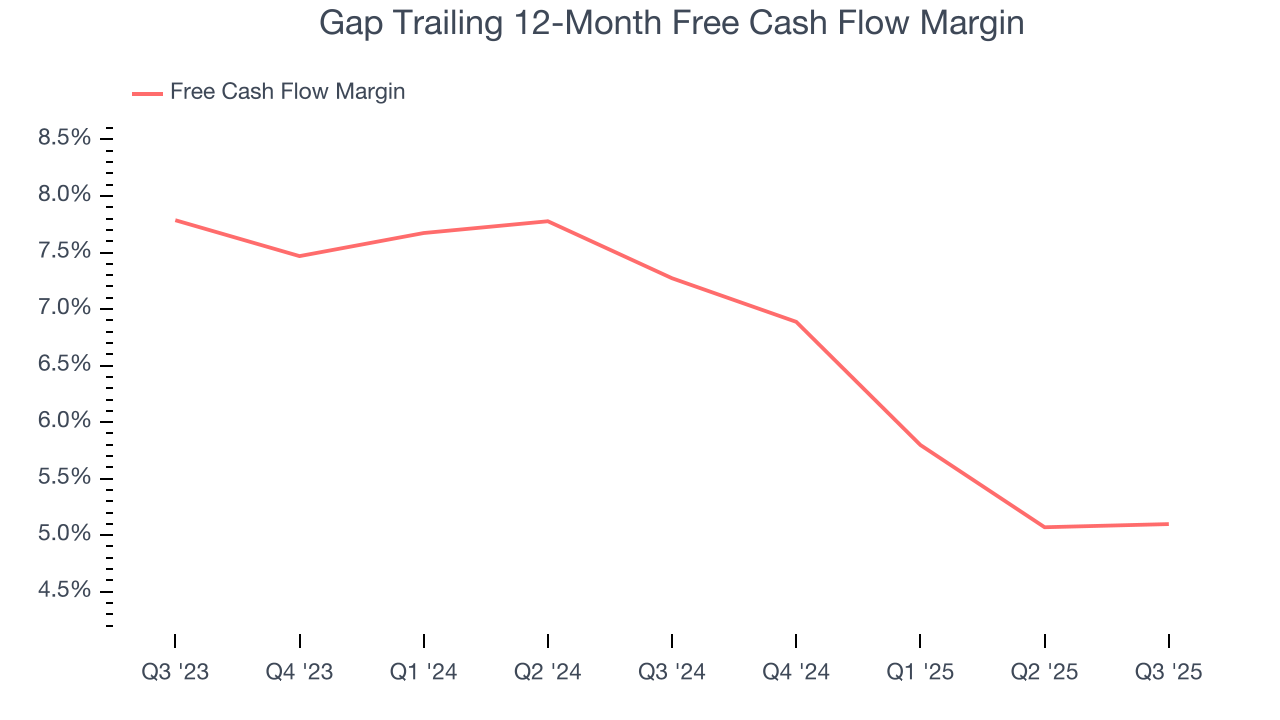
Gap’s free cash flow clocked in at $153 million in Q3, equivalent to a 3.9% margin. This cash profitability was in line with the comparable period last year but below its two-year average. In a silo, this isn’t a big deal because investment needs can be seasonal, but we’ll be watching to see if the trend extrapolates into future quarters.
10. Return on Invested Capital (ROIC)
EPS and free cash flow tell us whether a company was profitable while growing its revenue. But was it capital-efficient? A company’s ROIC explains this by showing how much operating profit it makes compared to the money it has raised (debt and equity).
Gap historically did a mediocre job investing in profitable growth initiatives. Its five-year average ROIC was 7.7%, somewhat low compared to the best consumer retail companies that consistently pump out 25%+.
11. Balance Sheet Assessment
Gap reported $2.52 billion of cash and $5.52 billion of debt on its balance sheet in the most recent quarter. As investors in high-quality companies, we primarily focus on two things: 1) that a company’s debt level isn’t too high and 2) that its interest payments are not excessively burdening the business.
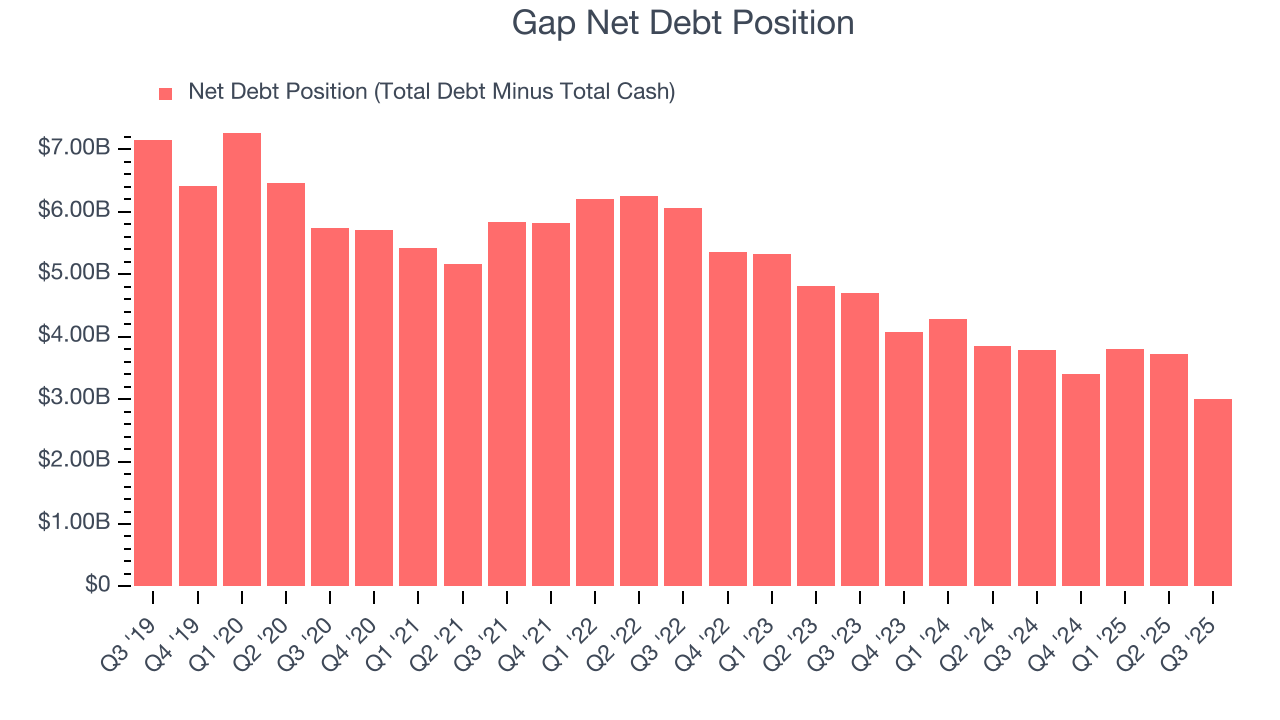
With $1.64 billion of EBITDA over the last 12 months, we view Gap’s 1.8× net-debt-to-EBITDA ratio as safe. We also see its $17 million of annual interest expenses as appropriate. The company’s profits give it plenty of breathing room, allowing it to continue investing in growth initiatives.
12. Key Takeaways from Gap’s Q3 Results
We were impressed by how significantly Gap blew past analysts’ EBITDA expectations this quarter. We were also glad its gross margin outperformed Wall Street’s estimates. Overall, we think this was a decent quarter with some key metrics above expectations. The stock traded up 4.8% to $24.15 immediately after reporting.
13. Is Now The Time To Buy Gap?
Updated: February 2, 2026 at 9:33 PM EST
When considering an investment in Gap, investors should account for its valuation and business qualities as well as what’s happened in the latest quarter.
Gap isn’t a terrible business, but it doesn’t pass our quality test. For starters, its revenue has declined over the last three years. And while its EPS growth over the last three years has been fantastic, the downside is its relatively low ROIC suggests management has struggled to find compelling investment opportunities. On top of that, its projected EPS for the next year is lacking.
Gap’s P/E ratio based on the next 12 months is 12.5x. This valuation is reasonable, but the company’s shakier fundamentals present too much downside risk. We're fairly confident there are better stocks to buy right now.
Wall Street analysts have a consensus one-year price target of $30.30 on the company (compared to the current share price of $28.63).
