General Dynamics (GD)
General Dynamics doesn’t excite us. Its growth has been lacking and its free cash flow margin has caved, suggesting it’s struggling to adapt.― StockStory Analyst Team
1. News


2. Summary
Why General Dynamics Is Not Exciting
Creator of the famous M1 Abrahms tank, General Dynamics (NYSE:GD) develops aerospace, marine systems, combat systems, and information technology products.
- Estimated sales growth of 4.2% for the next 12 months implies demand will slow from its two-year trend
- Earnings growth over the last five years fell short of the peer group average as its EPS only increased by 7% annually
- On the bright side, its market-beating returns on capital illustrate that management has a knack for investing in profitable ventures


General Dynamics falls below our quality standards. There are better opportunities in the market.
Why There Are Better Opportunities Than General Dynamics


General Dynamics is trading at $346.80 per share, or 21.8x forward P/E. This multiple is lower than most industrials companies, but for good reason.
We’d rather pay up for companies with elite fundamentals than get a bargain on weak ones. Cheap stocks can be value traps, and as their performance deteriorates, they will stay cheap or get even cheaper.
3. General Dynamics (GD) Research Report: Q4 CY2025 Update
Aerospace and defense company General Dynamics (NYSE:GD) reported revenue ahead of Wall Streets expectations in Q4 CY2025, with sales up 7.8% year on year to $14.38 billion. Its GAAP profit of $4.17 per share was 1.5% above analysts’ consensus estimates.
General Dynamics (GD) Q4 CY2025 Highlights:
- Revenue: $14.38 billion vs analyst estimates of $13.82 billion (7.8% year-on-year growth, 4.1% beat)
- EPS (GAAP): $4.17 vs analyst estimates of $4.11 (1.5% beat)
- Operating Margin: 10.1%, in line with the same quarter last year
- Free Cash Flow Margin: 6.6%, down from 13.5% in the same quarter last year
- Backlog: $118 billion at quarter end, up 30.3% year on year
- Market Capitalization: $98.88 billion
Company Overview
Creator of the famous M1 Abrahms tank, General Dynamics (NYSE:GD) develops aerospace, marine systems, combat systems, and information technology products.
General Dynamic’s products can be categorized into three areas: military vehicles, information systems, and commercial aircraft. This includes combat submarines, Gulfstream jets, and cyber security solutions. The company also offers services like maintenance and repair for its products.
The company primarily contracts with U.S. government agencies such as the Department of Defense as well as international governments and military organizations. It also has a presence in commercial activities, particularly aerospace, where it sells private jets to individuals and corporations.
In its U.S. government business, the majority of deals are structured as fixed-price contracts, with cost-plus contracts (reimbursement of development costs along with a fee) coming in second. Time-and-materials contracts, which require a client to pay for a contractor's time and money spent on materials, also play a role in its sales. These contracts vary in scope and duration due to the variety of services offered by the company. Internationally, General Dynamic’s non-US subsidiaries sell its products by establishing themselves as regional suppliers through relations with each respective government.
4. Defense Contractors
Defense contractors typically require technical expertise and government clearance. Companies in this sector can also enjoy long-term contracts with government bodies, leading to more predictable revenues. Combined, these factors create high barriers to entry and can lead to limited competition. Lately, geopolitical tensions–whether it be Russia’s invasion of Ukraine or China’s aggression towards Taiwan–highlight the need for defense spending. On the other hand, demand for these products can ebb and flow with defense budgets and even who is president, as different administrations can have vastly different ideas of how to allocate federal funds.
General Dynamic’s peers and competitors include Boeing (NYSE:BA), Raytheon (NYSE:RTX), Northrop Grumman (NYSE: NOC), and Lockheed Martin (NYSE:LMT).
5. Revenue Growth
Examining a company’s long-term performance can provide clues about its quality. Any business can put up a good quarter or two, but many enduring ones grow for years. Regrettably, General Dynamics’s sales grew at a mediocre 6.7% compounded annual growth rate over the last five years. This was below our standard for the industrials sector and is a tough starting point for our analysis.
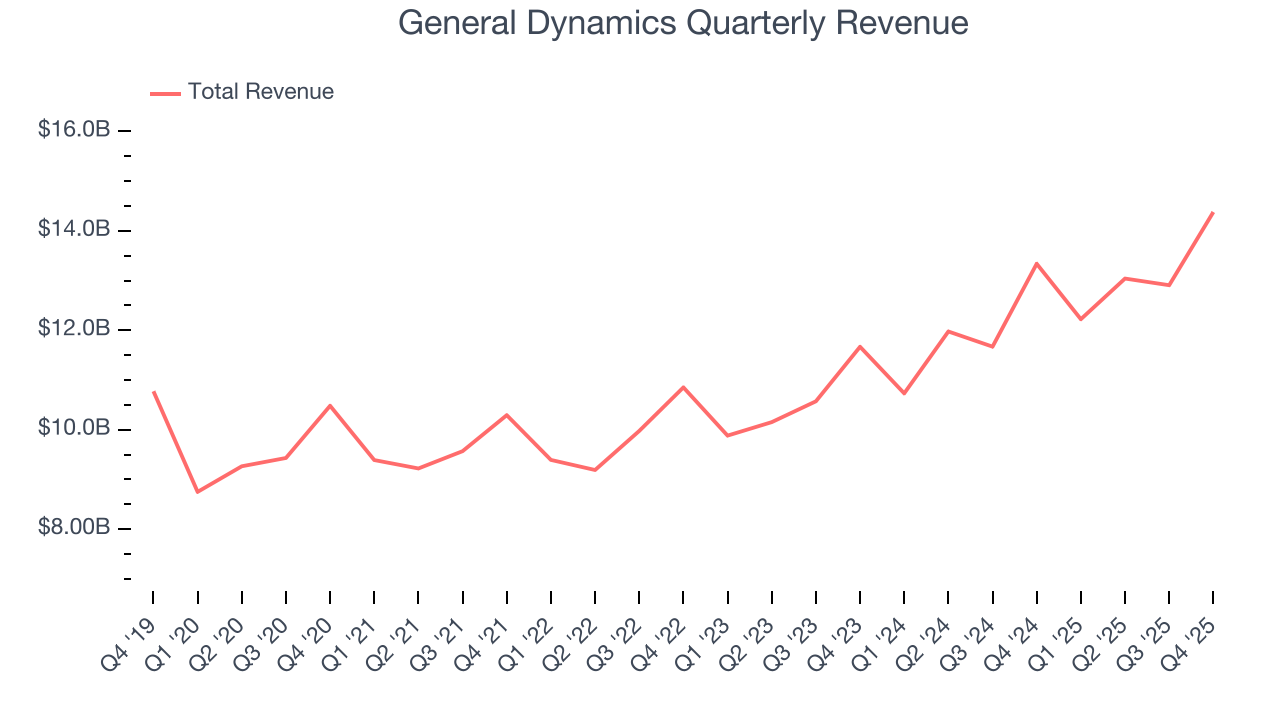
We at StockStory place the most emphasis on long-term growth, but within industrials, a half-decade historical view may miss cycles, industry trends, or a company capitalizing on catalysts such as a new contract win or a successful product line. General Dynamics’s annualized revenue growth of 11.5% over the last two years is above its five-year trend, suggesting its demand recently accelerated. 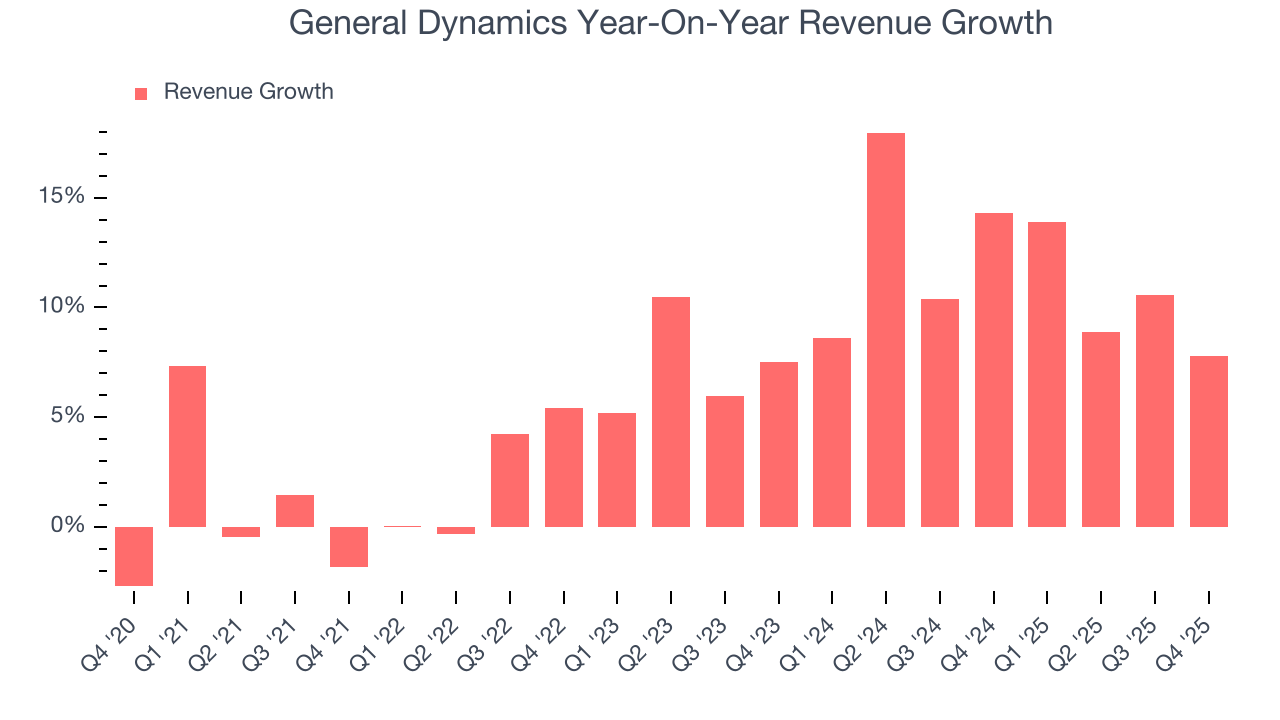
We can dig further into the company’s revenue dynamics by analyzing its backlog, or the value of its outstanding orders that have not yet been executed or delivered. General Dynamics’s backlog reached $118 billion in the latest quarter and averaged 6.9% year-on-year growth over the last two years. Because this number is lower than its revenue growth, we can see the company fulfilled orders at a faster rate than it added new orders to the backlog. This implies General Dynamics was operating efficiently but raises questions about the health of its sales pipeline. 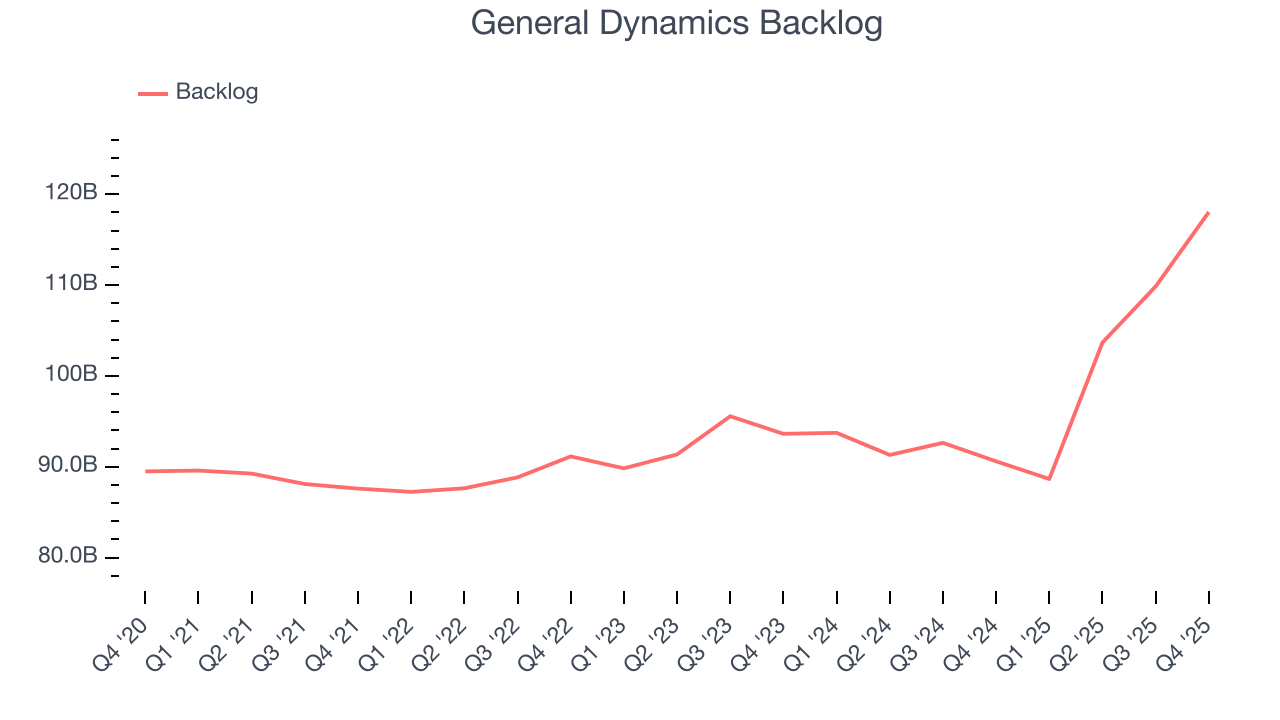
This quarter, General Dynamics reported year-on-year revenue growth of 7.8%, and its $14.38 billion of revenue exceeded Wall Street’s estimates by 4.1%.
Looking ahead, sell-side analysts expect revenue to grow 3.6% over the next 12 months, a deceleration versus the last two years. This projection doesn't excite us and indicates its products and services will face some demand challenges.
6. Operating Margin
Operating margin is a key measure of profitability. Think of it as net income - the bottom line - excluding the impact of taxes and interest on debt, which are less connected to business fundamentals.
General Dynamics’s operating margin might fluctuated slightly over the last 12 months but has generally stayed the same, averaging 10.3% over the last five years. This profitability was solid for an industrials business and shows it’s an efficient company that manages its expenses well.
Analyzing the trend in its profitability, General Dynamics’s operating margin might fluctuated slightly but has generally stayed the same over the last five years. This raises questions about the company’s expense base because its revenue growth should have given it leverage on its fixed costs, resulting in better economies of scale and profitability.
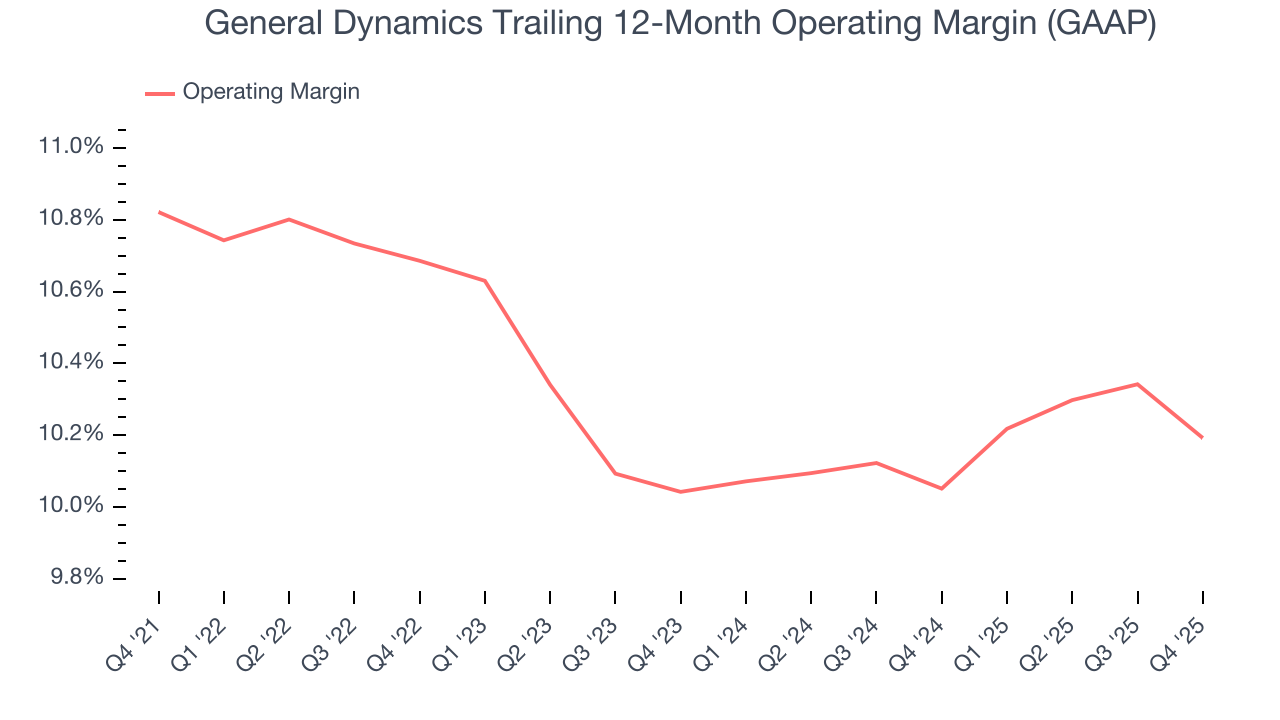
In Q4, General Dynamics generated an operating margin profit margin of 10.1%, in line with the same quarter last year. This indicates the company’s overall cost structure has been relatively stable.
7. Earnings Per Share
Revenue trends explain a company’s historical growth, but the long-term change in earnings per share (EPS) points to the profitability of that growth – for example, a company could inflate its sales through excessive spending on advertising and promotions.
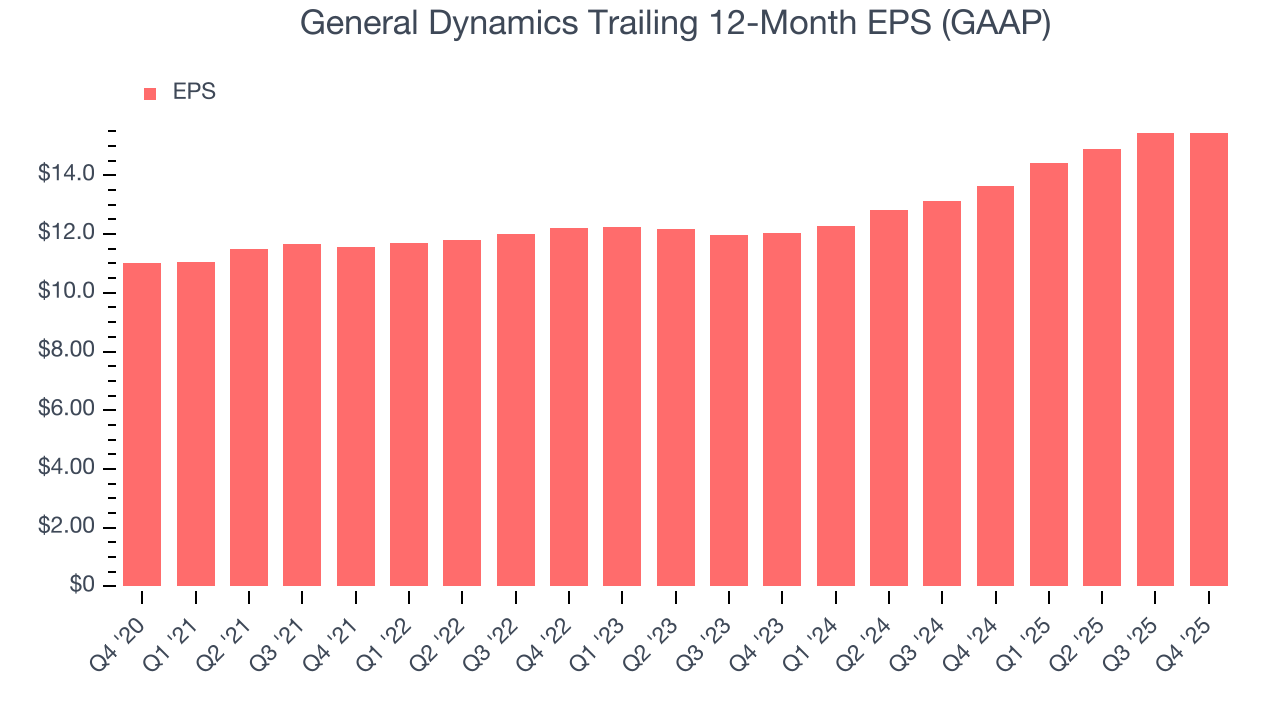
General Dynamics’s unimpressive 7% annual EPS growth over the last five years aligns with its revenue performance. This tells us it maintained its per-share profitability as it expanded.
Like with revenue, we analyze EPS over a more recent period because it can provide insight into an emerging theme or development for the business.
For General Dynamics, its two-year annual EPS growth of 13.3% was higher than its five-year trend. This acceleration made it one of the faster-growing industrials companies in recent history.
In Q4, General Dynamics reported EPS of $4.17, up from $4.15 in the same quarter last year. This print beat analysts’ estimates by 1.5%. Over the next 12 months, Wall Street expects General Dynamics’s full-year EPS of $15.45 to grow 11.5%.
8. Cash Is King
Free cash flow isn't a prominently featured metric in company financials and earnings releases, but we think it's telling because it accounts for all operating and capital expenses, making it tough to manipulate. Cash is king.
General Dynamics has shown impressive cash profitability, enabling it to ride out cyclical downturns more easily while maintaining its investments in new and existing offerings. The company’s free cash flow margin averaged 8.1% over the last five years, better than the broader industrials sector.
Taking a step back, we can see that General Dynamics’s margin dropped by 1.3 percentage points during that time. Continued declines could signal it is in the middle of an investment cycle.
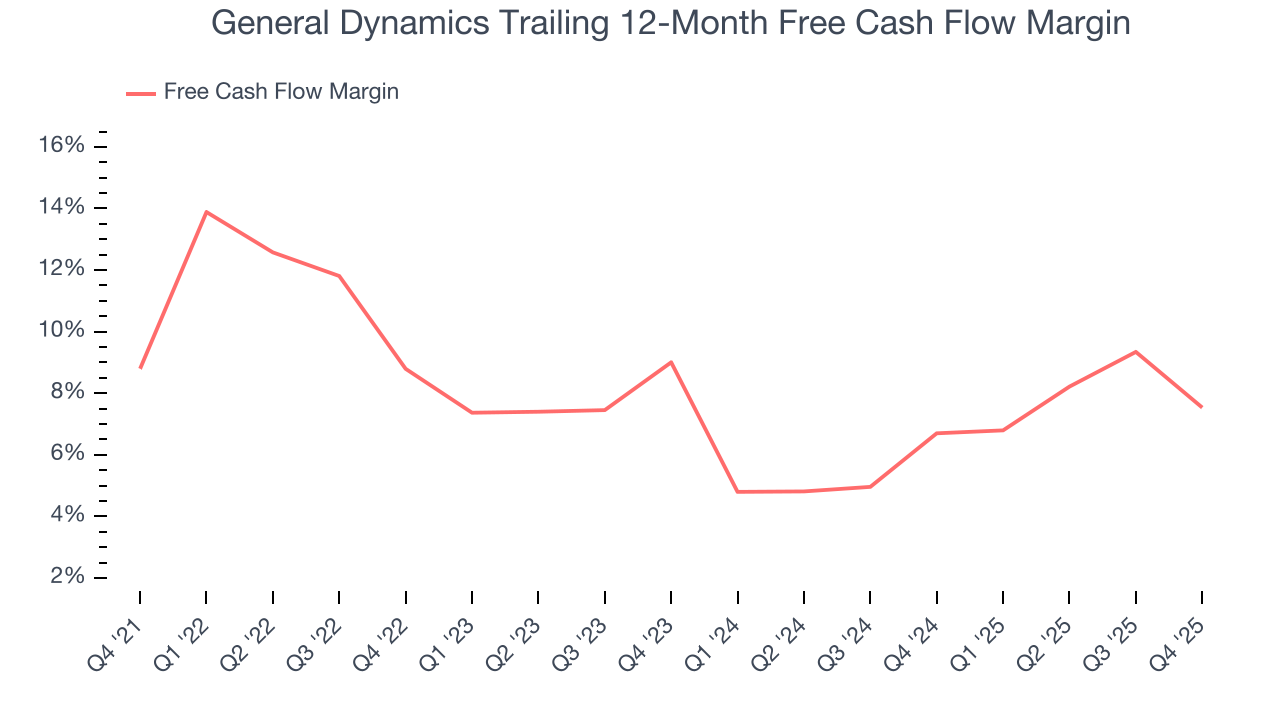
General Dynamics’s free cash flow clocked in at $952 million in Q4, equivalent to a 6.6% margin. The company’s cash profitability regressed as it was 6.9 percentage points lower than in the same quarter last year, suggesting its historical struggles have dragged on.
9. Return on Invested Capital (ROIC)
EPS and free cash flow tell us whether a company was profitable while growing its revenue. But was it capital-efficient? A company’s ROIC explains this by showing how much operating profit it makes compared to the money it has raised (debt and equity).
Although General Dynamics hasn’t been the highest-quality company lately, it historically found a few growth initiatives that worked out well. Its five-year average ROIC was 14%, impressive for an industrials business.
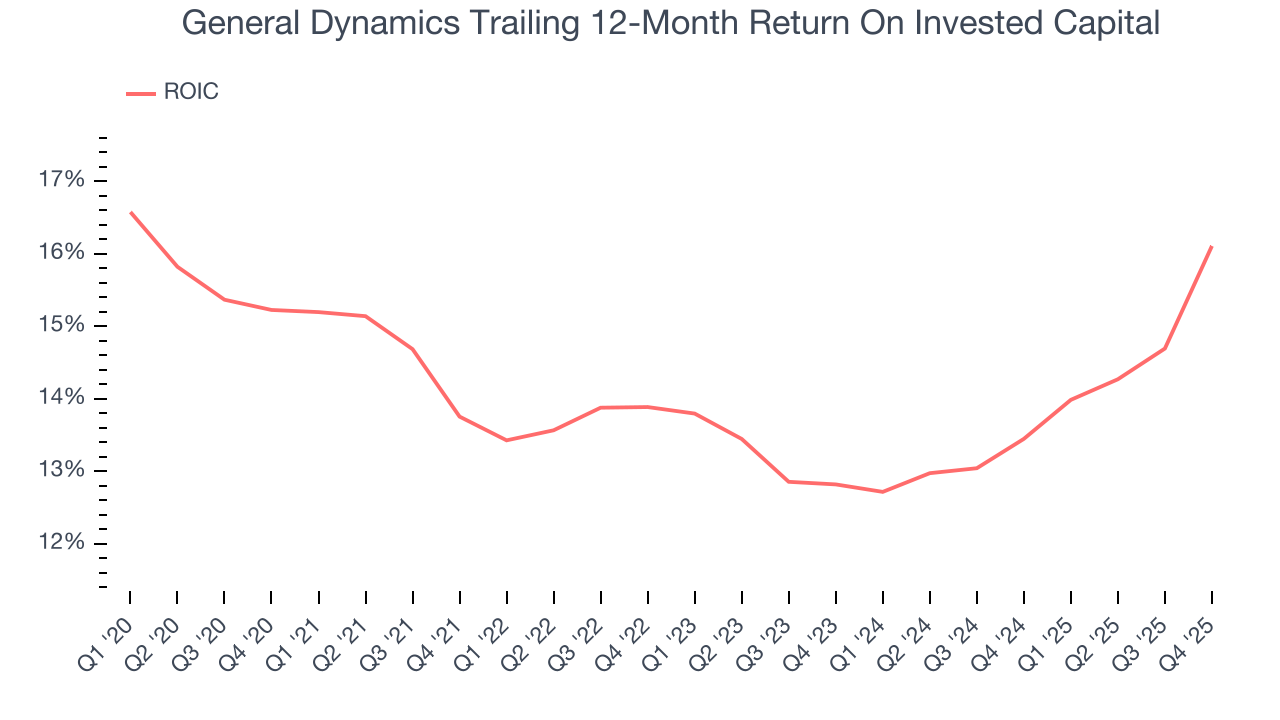
We like to invest in businesses with high returns, but the trend in a company’s ROIC is what often surprises the market and moves the stock price. Uneventfully, General Dynamics’s ROIC has stayed the same over the last few years. Given the company’s underwhelming financial performance in other areas, we’d like to see its returns improve before recommending the stock.
10. Balance Sheet Assessment
General Dynamics reported $2.33 billion of cash and $8.01 billion of debt on its balance sheet in the most recent quarter. As investors in high-quality companies, we primarily focus on two things: 1) that a company’s debt level isn’t too high and 2) that its interest payments are not excessively burdening the business.
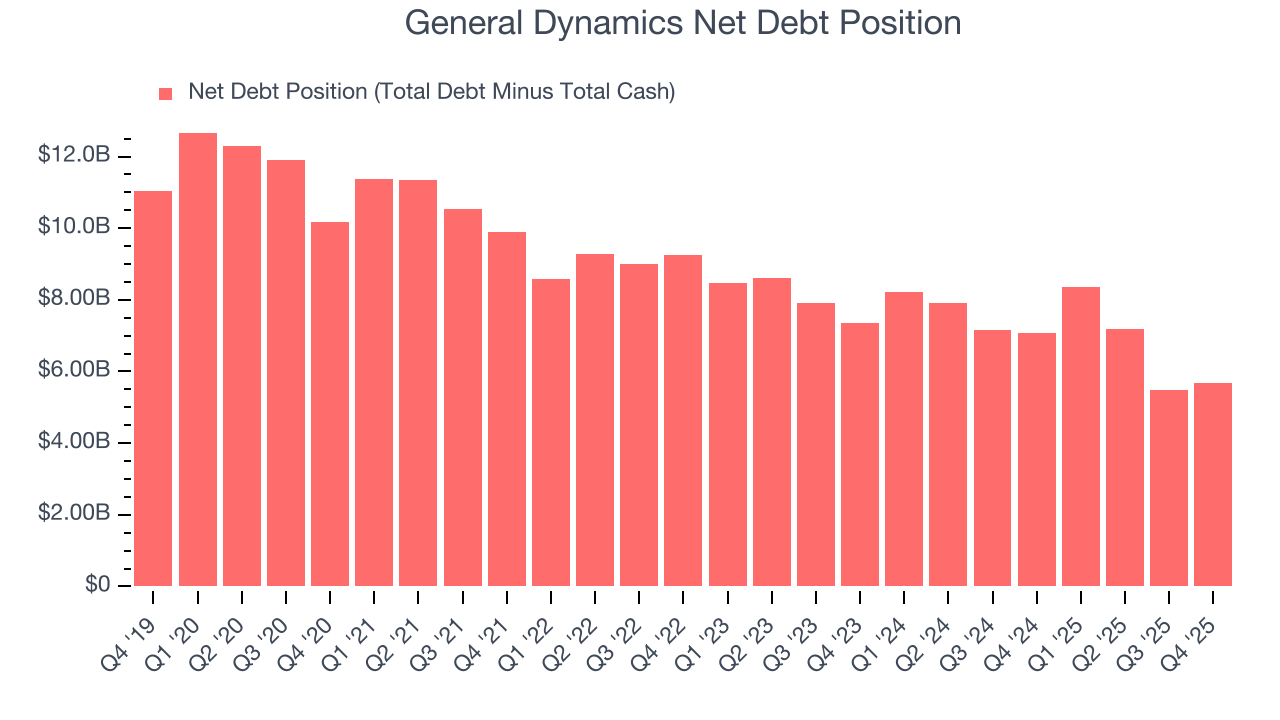
With $6.28 billion of EBITDA over the last 12 months, we view General Dynamics’s 0.9× net-debt-to-EBITDA ratio as safe. We also see its $314 million of annual interest expenses as appropriate. The company’s profits give it plenty of breathing room, allowing it to continue investing in growth initiatives.
11. Key Takeaways from General Dynamics’s Q4 Results
We were impressed by how significantly General Dynamics blew past analysts’ backlog expectations this quarter. We were also excited its revenue outperformed Wall Street’s estimates by a wide margin. Zooming out, we think this was a solid print. The stock remained flat at $366.49 immediately following the results.
12. Is Now The Time To Buy General Dynamics?
Updated: March 27, 2026 at 11:39 PM EDT
Before deciding whether to buy General Dynamics or pass, we urge investors to consider business quality, valuation, and the latest quarterly results.
General Dynamics isn’t a bad business, but we have other favorites. Although its revenue growth was mediocre over the last five years and analysts expect growth to slow over the next 12 months, its solid ROIC suggests it has grown profitably in the past. Tread carefully with this one, however, as its projected EPS for the next year is lacking.
General Dynamics’s P/E ratio based on the next 12 months is 21.8x. While this valuation is fair, the upside isn’t great compared to the potential downside. We're pretty confident there are superior stocks to buy right now.
Wall Street analysts have a consensus one-year price target of $394.13 on the company (compared to the current share price of $346.80).