
GE Vernova (GEV)
GE Vernova doesn’t excite us. Its underwhelming revenue growth and failure to generate meaningful free cash flow is a concerning trend.― StockStory Analyst Team
1. News


2. Summary
Why GE Vernova Is Not Exciting
Born from the energy business of industrial giant General Electric in a 2023 spin-off, GE Vernova (NYSE:GEV) designs, manufactures, and services power generation equipment and grid technologies to help customers build more reliable and sustainable electric systems.
- Poor expense management has led to operating margin losses
- Gross margin of 16.2% is below its competitors, leaving less money to invest in areas like marketing and R&D
- On the plus side, its exciting sales outlook for the upcoming 12 months calls for 17.6% growth, an acceleration from its two-year trend


GE Vernova is in the doghouse. There are more appealing investments to be made.
Why There Are Better Opportunities Than GE Vernova


GE Vernova’s stock price of $802.45 implies a valuation ratio of 58.2x forward P/E. The current multiple is quite expensive, especially for the tepid revenue growth.
There are stocks out there similarly priced with better business quality. We prefer owning these.
3. GE Vernova (GEV) Research Report: Q4 CY2025 Update
Energy transition company GE Vernova (NYSE:GEV) beat Wall Street’s revenue expectations in Q4 CY2025, with sales up 3.8% year on year to $10.96 billion. The company’s full-year revenue guidance of $44.5 billion at the midpoint came in 6.3% above analysts’ estimates. Its GAAP profit of $13.39 per share was significantly above analysts’ consensus estimates.
GE Vernova (GEV) Q4 CY2025 Highlights:
- Revenue: $10.96 billion vs analyst estimates of $10.29 billion (3.8% year-on-year growth, 6.5% beat)
- EPS (GAAP): $13.39 vs analyst estimates of $3.13 (significant beat, partly due to $2.9 billion tax benefit due to a U.S. valuation allowance release)
- Operating Margin: 5.5%, in line with the same quarter last year
- Free Cash Flow Margin: 16.5%, up from 5.4% in the same quarter last year
- Market Capitalization: $187.9 billion
Company Overview
Born from the energy business of industrial giant General Electric in a 2023 spin-off, GE Vernova (NYSE:GEV) designs, manufactures, and services power generation equipment and grid technologies to help customers build more reliable and sustainable electric systems.
The company operates through three main segments. The Power segment provides gas, steam, nuclear, and hydroelectric turbines along with related services, helping utilities and industrial customers generate electricity from various fuel sources. Its Gas Power unit offers heavy-duty and aeroderivative gas turbines, while other divisions support nuclear, hydro, and steam power generation.
The Wind segment develops both onshore and offshore wind turbines, with its Haliade-X 220m offshore unit serving as a flagship product. Through LM Wind Power, the company also designs and manufactures turbine blades. With approximately 57,000 onshore wind turbines in its installed base, GE Vernova maintains service agreements for about 23,000 of these units.
The Electrification segment provides critical infrastructure for transmitting, distributing, and managing electricity. Products include high-voltage direct current (HVDC) transmission systems, power transformers, switchgear, and grid automation solutions. This segment also encompasses power conversion equipment for marine, mining, and other industries, plus solar integration and energy storage solutions.
GE Vernova serves a global customer base of utilities, power producers, governments, and industrial clients seeking to expand electrical capacity, improve grid reliability, and transition to lower-carbon energy sources. The company leverages its technological expertise to help customers navigate the complex challenges of growing electricity demand while reducing environmental impact.
4. Electrical Systems
Like many equipment and component manufacturers, electrical systems companies are buoyed by secular trends such as connectivity and industrial automation. More specific pockets of strong demand include Internet of Things (IoT) connectivity and the 5G telecom upgrade cycle, which can benefit companies whose cables and conduits fit those needs. But like the broader industrials sector, these companies are also at the whim of economic cycles. Interest rates, for example, can greatly impact projects that drive demand for these products.
GE Vernova faces competition from Siemens Energy, Mitsubishi Power, and Hitachi Energy in power generation and grid solutions. In the wind turbine market, its main rivals include Vestas, Siemens-Gamesa, and Nordex, while its electrification business competes with Schneider Electric and ABB.
5. Revenue Growth
A company’s long-term performance is an indicator of its overall quality. Even a bad business can shine for one or two quarters, but a top-tier one grows for years. Over the last four years, GE Vernova grew its sales at a sluggish 3.6% compounded annual growth rate. This wasn’t a great result compared to the rest of the industrials sector, but there are still things to like about GE Vernova.
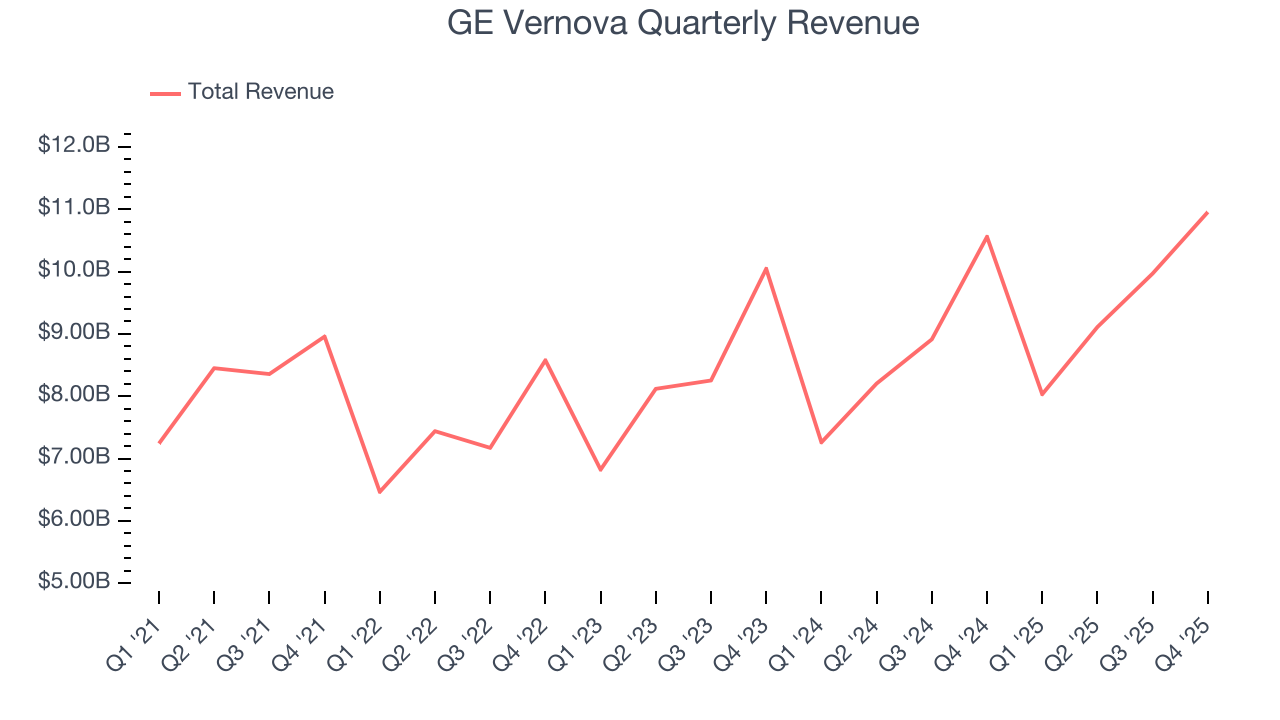
We at StockStory place the most emphasis on long-term growth, but within industrials, a stretched historical view may miss cycles, industry trends, or a company capitalizing on catalysts such as a new contract win or a successful product line. GE Vernova’s annualized revenue growth of 7% over the last two years is above its four-year trend, but we were still disappointed by the results.
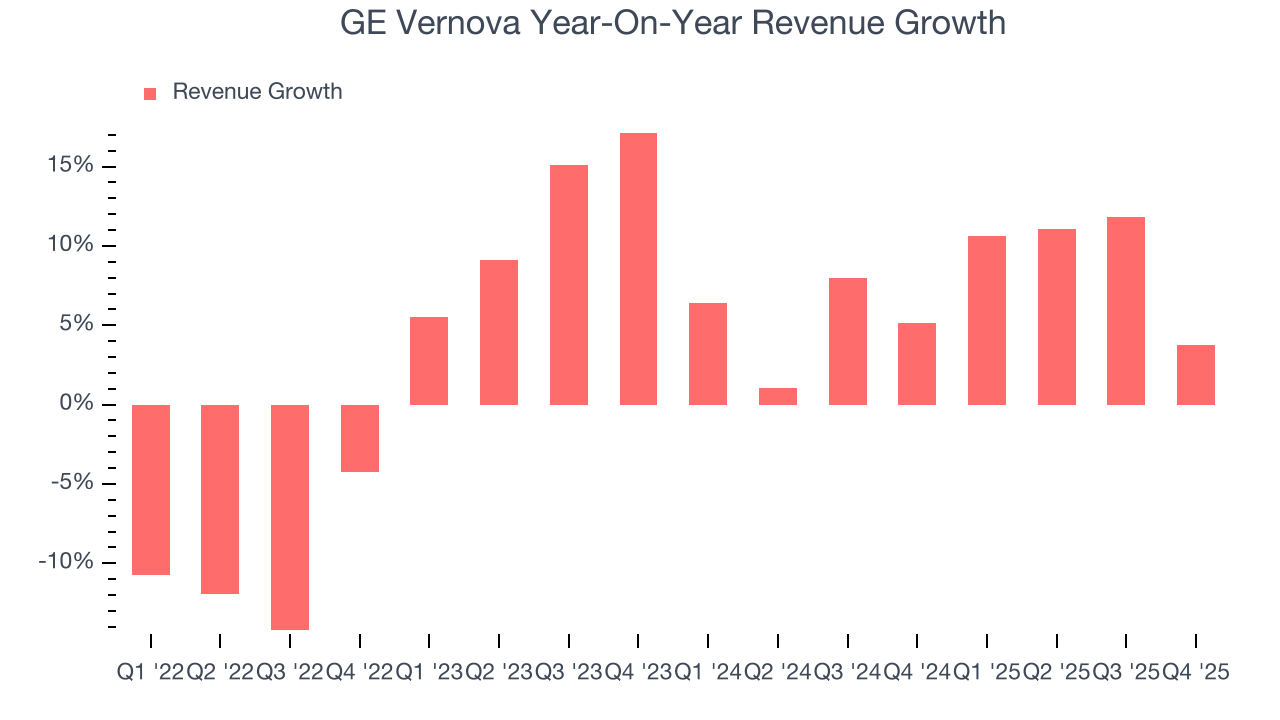
This quarter, GE Vernova reported modest year-on-year revenue growth of 3.8% but beat Wall Street’s estimates by 6.5%.
Looking ahead, sell-side analysts expect revenue to grow 10.7% over the next 12 months, an improvement versus the last two years. This projection is particularly noteworthy for a company of its scale and suggests its newer products and services will catalyze better top-line performance.
6. Gross Margin & Pricing Power
For industrials businesses, cost of sales is usually comprised of the direct labor, raw materials, and supplies needed to offer a product or service. These costs can be impacted by inflation and supply chain dynamics in the short term and a company’s purchasing power and scale over the long term.
GE Vernova has bad unit economics for an industrials business, signaling it operates in a competitive market. As you can see below, it averaged a 15.8% gross margin over the last five years. Said differently, GE Vernova had to pay a chunky $84.16 to its suppliers for every $100 in revenue. 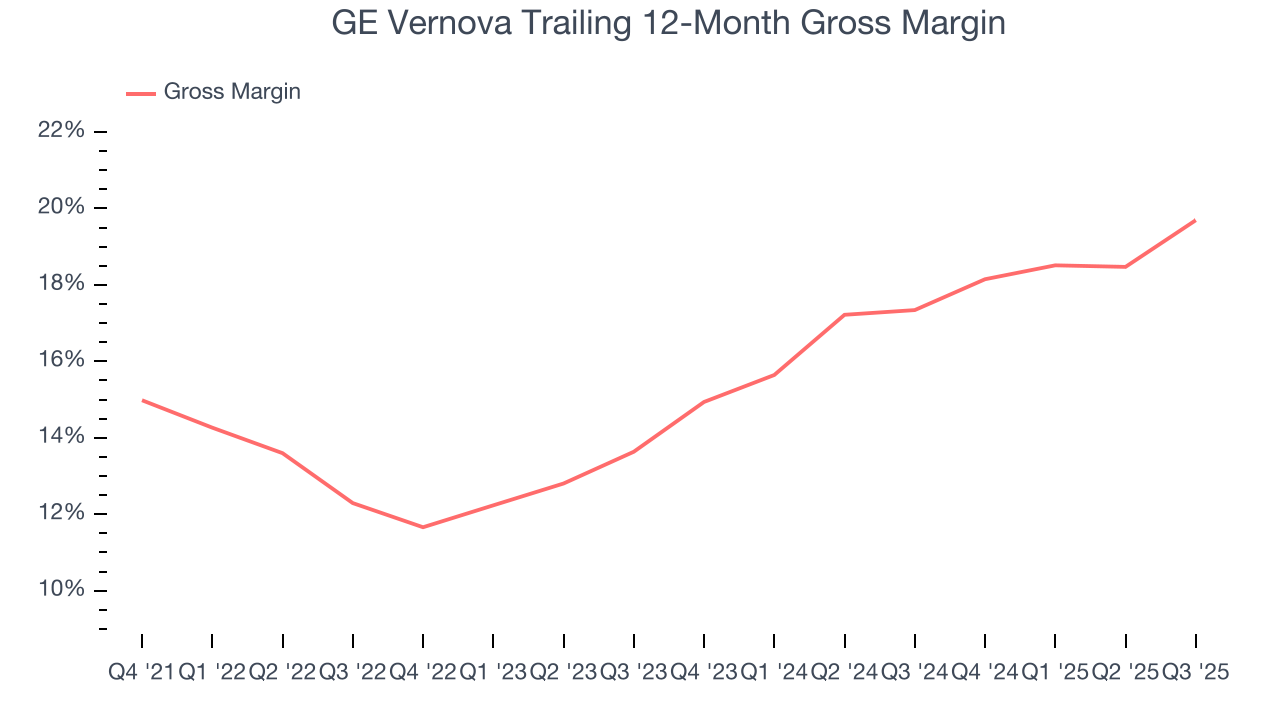
7. Operating Margin
Although GE Vernova was profitable this quarter from an operational perspective, it’s generally struggled over a longer time period. Its expensive cost structure has contributed to an average operating margin of negative 1.4% over the last four years. Unprofitable industrials companies require extra attention because they could get caught swimming naked when the tide goes out.
On the plus side, GE Vernova’s operating margin rose by 13.4 percentage points over the last four years, as its sales growth gave it operating leverage. Still, it will take much more for the company to show consistent profitability.
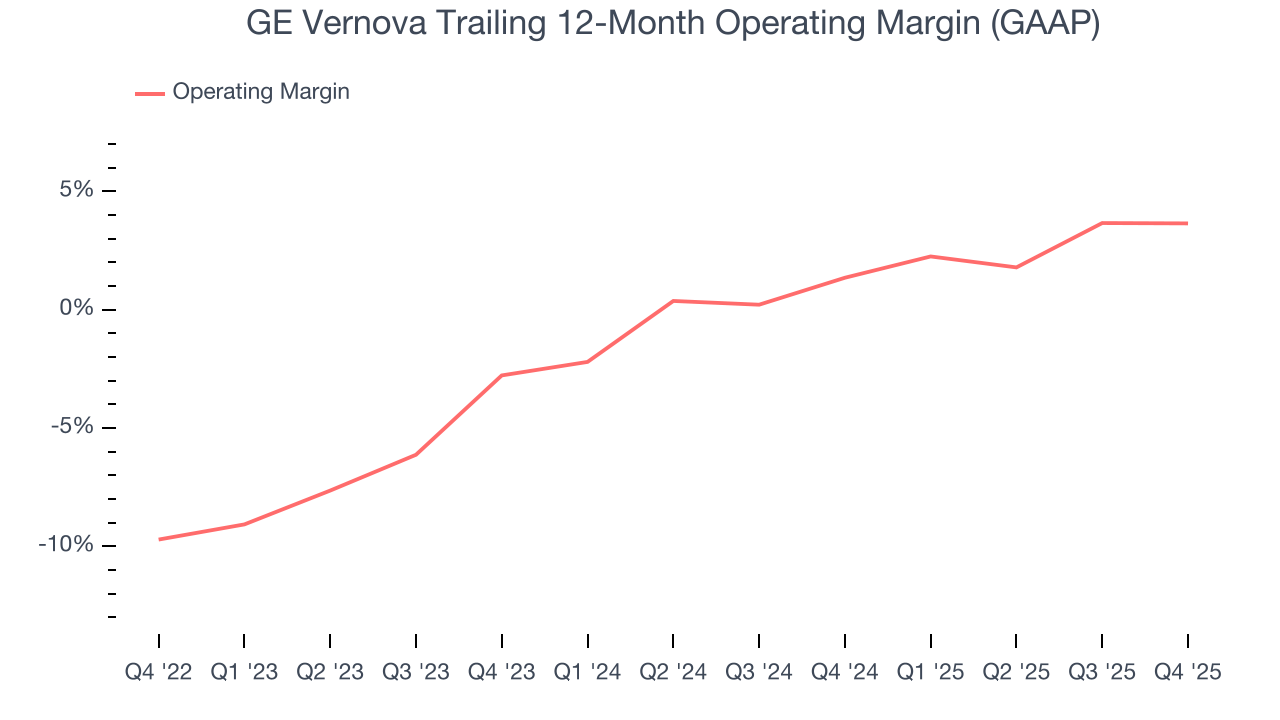
In Q4, GE Vernova generated an operating margin profit margin of 5.5%, in line with the same quarter last year. This indicates the company’s cost structure has recently been stable.
8. Earnings Per Share
We track the long-term change in earnings per share (EPS) for the same reason as long-term revenue growth. Compared to revenue, however, EPS highlights whether a company’s growth is profitable.
GE Vernova’s full-year EPS flipped from negative to positive over the last four years. This is encouraging and shows it’s at a critical moment in its life.
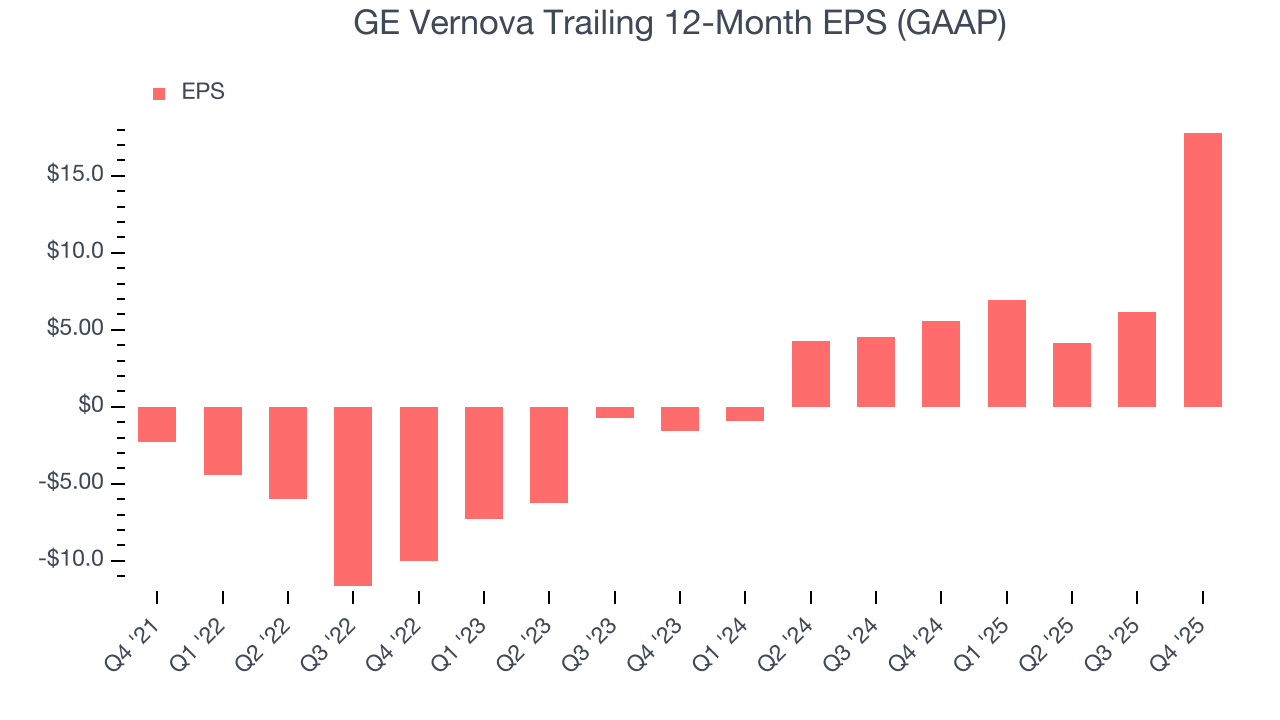
Like with revenue, we analyze EPS over a more recent period because it can provide insight into an emerging theme or development for the business.
For GE Vernova, its two-year annual EPS growth of 263% was higher than its four-year trend. We love it when earnings growth accelerates, especially when it accelerates off an already high base.
In Q4, GE Vernova reported EPS of $13.39, up from $1.73 in the same quarter last year partly due to a $2.9 billion tax benefit due to a U.S. valuation allowance release. This print easily cleared analysts’ estimates, and shareholders should be content with the results. Over the next 12 months, Wall Street expects GE Vernova’s full-year EPS of $17.81 to shrink by 23.3%.
9. Cash Is King
Free cash flow isn't a prominently featured metric in company financials and earnings releases, but we think it's telling because it accounts for all operating and capital expenses, making it tough to manipulate. Cash is king.
GE Vernova has shown weak cash profitability over the last four years, giving the company limited opportunities to return capital to shareholders. Its free cash flow margin averaged 4.6%, subpar for an industrials business.
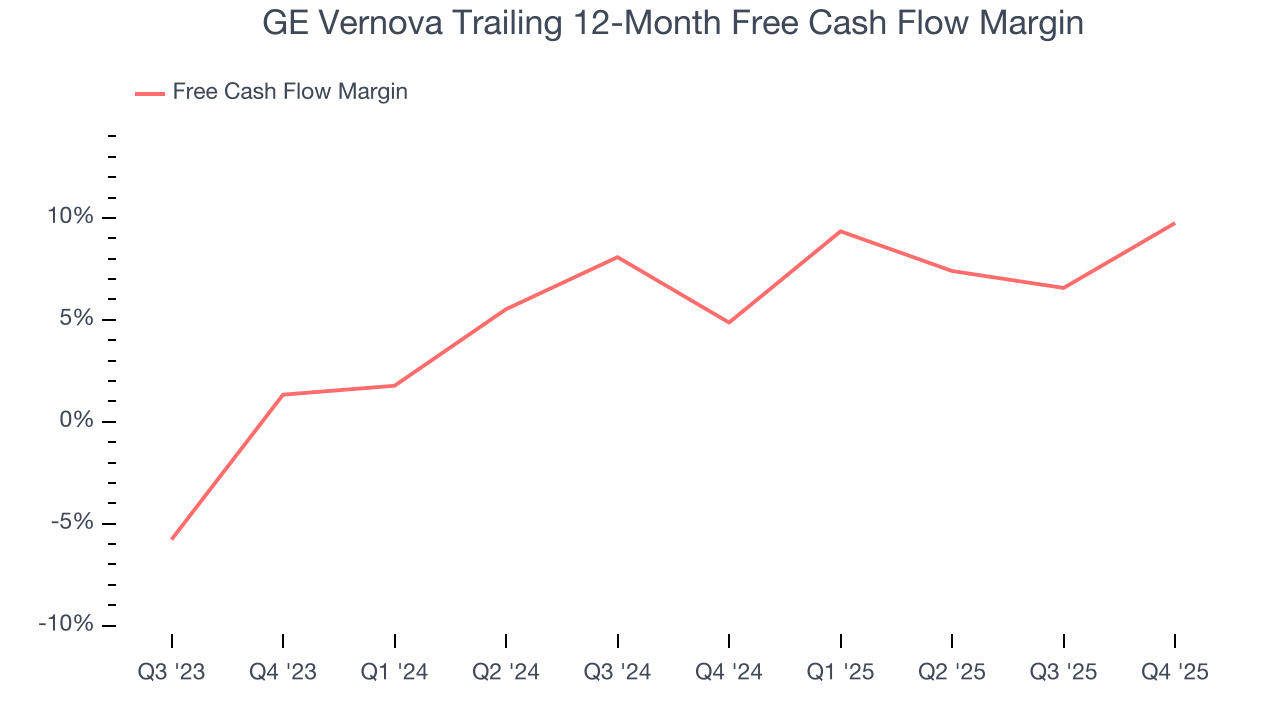
GE Vernova’s free cash flow clocked in at $1.81 billion in Q4, equivalent to a 16.5% margin. This result was good as its margin was 11.1 percentage points higher than in the same quarter last year, but we wouldn’t read too much into the short term because investment needs can be seasonal, causing temporary swings. Long-term trends trump fluctuations.
10. Balance Sheet Assessment
One of the best ways to mitigate bankruptcy risk is to hold more cash than debt.
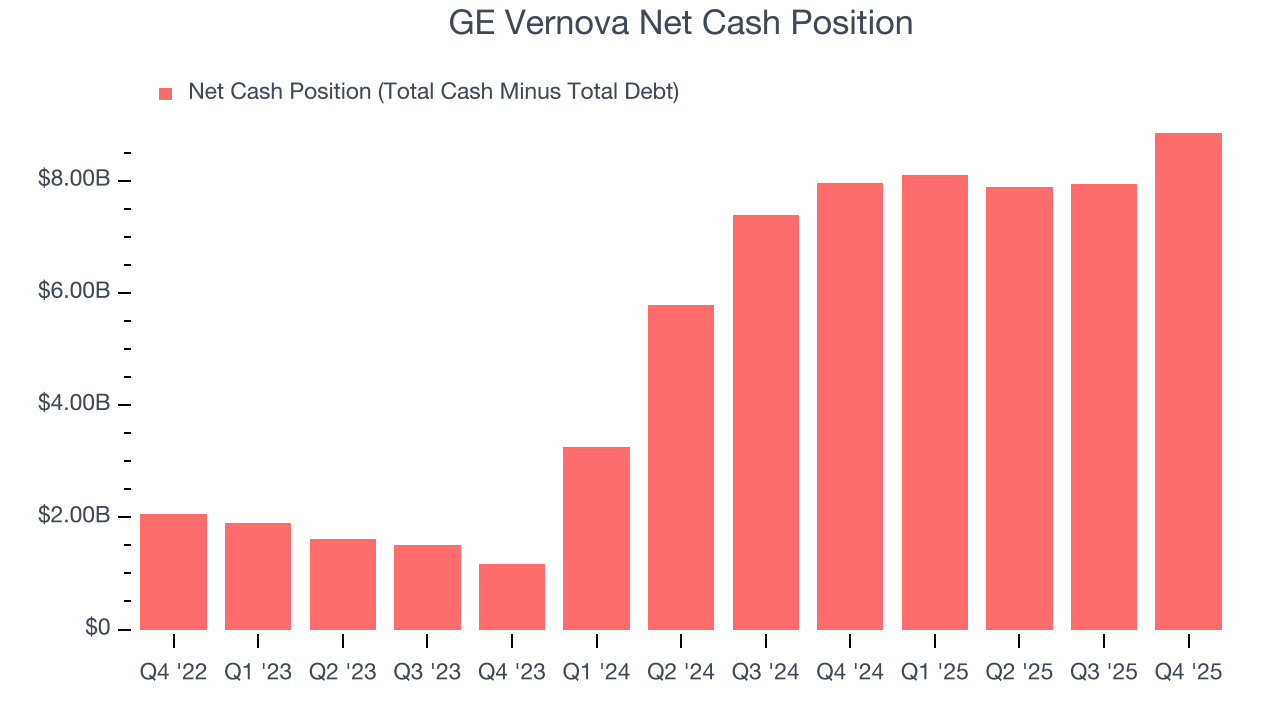
GE Vernova is a profitable, well-capitalized company with $8.85 billion of cash and no debt. This position is 4.7% of its market cap and gives it the freedom to borrow money, return capital to shareholders, or invest in growth initiatives. Leverage is not an issue here.
11. Key Takeaways from GE Vernova’s Q4 Results
It was good to see GE Vernova beat analysts’ revenue expectations this quarter. While EPS beat significantly, we note that this was partly due to a $2.9 billion tax benefit due to a U.S. valuation allowance release. The stock traded up 2.9% to $713.10 immediately following the results.
12. Is Now The Time To Buy GE Vernova?
Updated: February 14, 2026 at 12:01 AM EST
Before investing in or passing on GE Vernova, we urge you to understand the company’s business quality (or lack thereof), valuation, and the latest quarterly results - in that order.
GE Vernova has a few positive attributes, but it doesn’t top our wishlist. Although its revenue growth was weak over the last four years, its growth over the next 12 months is expected to be higher. And while GE Vernova’s projected EPS for the next year is lacking, its expanding operating margin shows the business has become more efficient.
GE Vernova’s P/E ratio based on the next 12 months is 58.2x. This multiple tells us a lot of good news is priced in - we think there are better stocks to buy right now.
Wall Street analysts have a consensus one-year price target of $836.98 on the company (compared to the current share price of $802.45).