General Motors (GM)
We aren’t fans of General Motors. Its weak sales growth and declining returns on capital show its demand and profits are shrinking.― StockStory Analyst Team
1. News


2. Summary
Why General Motors Is Not Exciting
Founded in 1908 by William C. Durant, General Motors (NYSE:GM) offers a range of vehicles and automobiles through brands such as Chevrolet, Buick, GMC, and Cadillac.
- High input costs result in an inferior gross margin of 12.2% that must be offset through higher volumes
- Sales are projected to remain flat over the next 12 months as demand decelerates from its two-year trend
- A silver lining is that its earnings growth has beaten its peers over the last five years as its EPS has compounded at 16.8% annually


General Motors’s quality doesn’t meet our expectations. We believe there are better opportunities elsewhere.
Why There Are Better Opportunities Than General Motors


General Motors is trading at $72.32 per share, or 5.9x forward P/E. General Motors’s valuation may seem like a bargain, but we think there are valid reasons why it’s so cheap.
Cheap stocks can look like great bargains at first glance, but you often get what you pay for. These mediocre businesses often have less earnings power, meaning there is more reliance on a re-rating to generate good returns - an unlikely scenario for low-quality companies.
3. General Motors (GM) Research Report: Q4 CY2025 Update
Automotive manufacturer General Motors (NYSE:GM) missed Wall Street’s revenue expectations in Q4 CY2025, with sales falling 5.1% year on year to $45.29 billion. Its non-GAAP profit of $2.51 per share was 11.1% above analysts’ consensus estimates.
General Motors (GM) Q4 CY2025 Highlights:
- Revenue: $45.29 billion vs analyst estimates of $45.81 billion (5.1% year-on-year decline, 1.1% miss)
- Adjusted EPS: $2.51 vs analyst estimates of $2.26 (11.1% beat)
- Adjusted EPS guidance for the upcoming financial year 2026 is $12 at the midpoint, beating analyst estimates by 1.5%
- Operating Margin: 6.3%, up from 3.2% in the same quarter last year
- Free Cash Flow Margin: 7.9%, up from 1.9% in the same quarter last year
- Market Capitalization: $74.46 billion
Company Overview
Founded in 1908 by William C. Durant, General Motors (NYSE:GM) offers a range of vehicles and automobiles through brands such as Chevrolet, Buick, GMC, and Cadillac.
General Motors Company (GM) is a global automotive company that designs, builds, and sells trucks, crossovers, cars, and automobile parts worldwide. The company's operations are organized into four automotive segments: GM North America, GM International, GM Cruise, and GM Financial. GM's core brands include Buick, Cadillac, Chevrolet, and GMC, and it also has equity ownership stakes in entities that meet customer demands in other countries, primarily in China.
GM's vision for the future is a world with zero crashes, zero emissions, and zero congestion, which guides its growth-focused strategy to invest in electric vehicles (EVs), autonomous vehicles (AVs), software-enabled services and subscriptions, and new business opportunities. The company's Ultium platform is a key element in its EV strategy, providing flexibility to expand its EV portfolio across multiple segments and price points.
General Motors primarily generates revenue through wholesale vehicle sales to independent dealerships, transferring inventory risk to them. Additional revenue streams include leasing and financing through GM Financial, parts and service sales, and software-enabled services like OnStar. GM is also developing new revenue sources from electric vehicles, autonomous technology (Cruise), and potential technology licensing to other automakers.
4. Automobile Manufacturing
Much capital investment and technical know-how are needed to manufacture functional, safe, and aesthetically pleasing automobiles for the mass market. Barriers to entry are therefore high, and auto manufacturers with economies of scale can boast strong economic moats. However, this doesn’t insulate them from new entrants, as electric vehicles (EVs) have entered the market and are upending it. This has forced established manufacturers to not only contend with emerging EV-first competitors but also decide how much they want to invest in these disruptive technologies, which will likely cannibalize their legacy offerings.
GM's competitors in the automotive industry include Ford (NYSE:F), Toyota (NYSE:TM), Volkswagen (OTC:VWAGY), and Honda (NYSE:HMC).
5. Revenue Growth
A company’s long-term sales performance is one signal of its overall quality. Any business can experience short-term success, but top-performing ones enjoy sustained growth for years. Thankfully, General Motors’s 8.6% annualized revenue growth over the last five years was decent. Its growth was slightly above the average industrials company and shows its offerings resonate with customers.
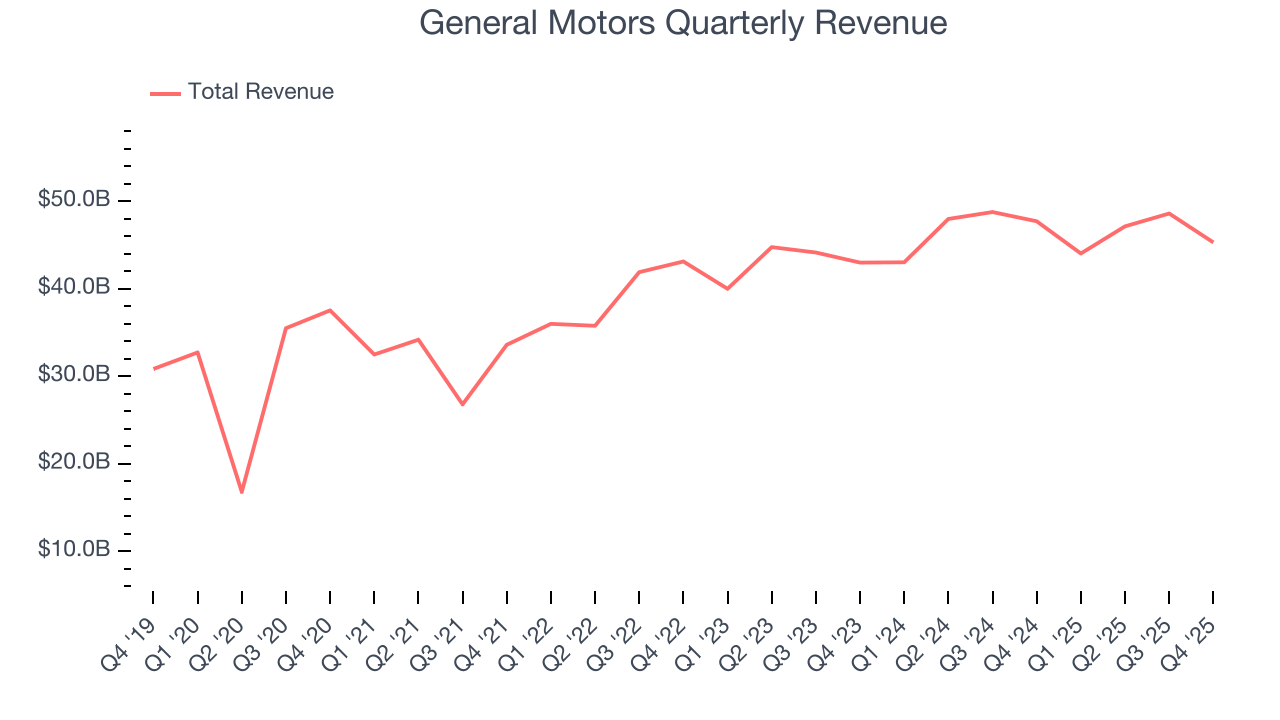
Long-term growth is the most important, but within industrials, a half-decade historical view may miss new industry trends or demand cycles. General Motors’s recent performance shows its demand has slowed as its annualized revenue growth of 3.8% over the last two years was below its five-year trend. We also note many other Automobile Manufacturing businesses have faced declining sales because of cyclical headwinds. While General Motors grew slower than we’d like, it did do better than its peers. 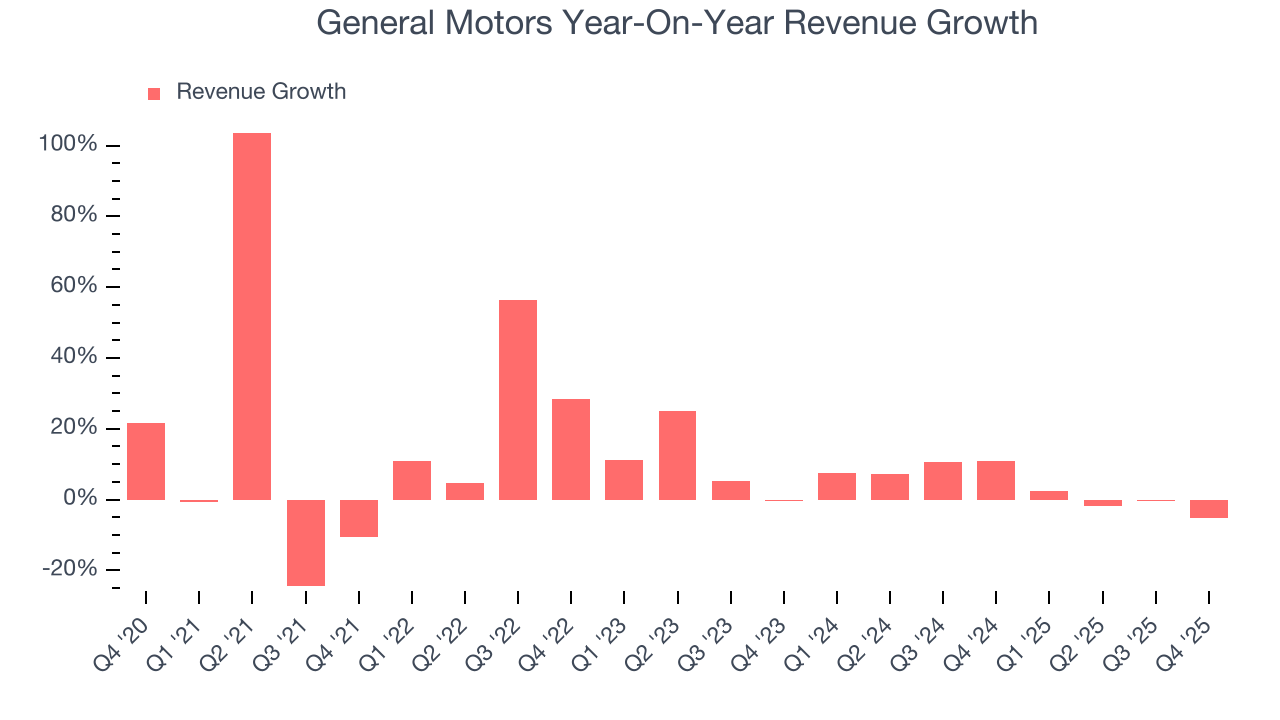
This quarter, General Motors missed Wall Street’s estimates and reported a rather uninspiring 5.1% year-on-year revenue decline, generating $45.29 billion of revenue.
Looking ahead, sell-side analysts expect revenue to grow 1.5% over the next 12 months, a slight deceleration versus the last two years. This projection is underwhelming and implies its products and services will face some demand challenges.
6. Gross Margin & Pricing Power
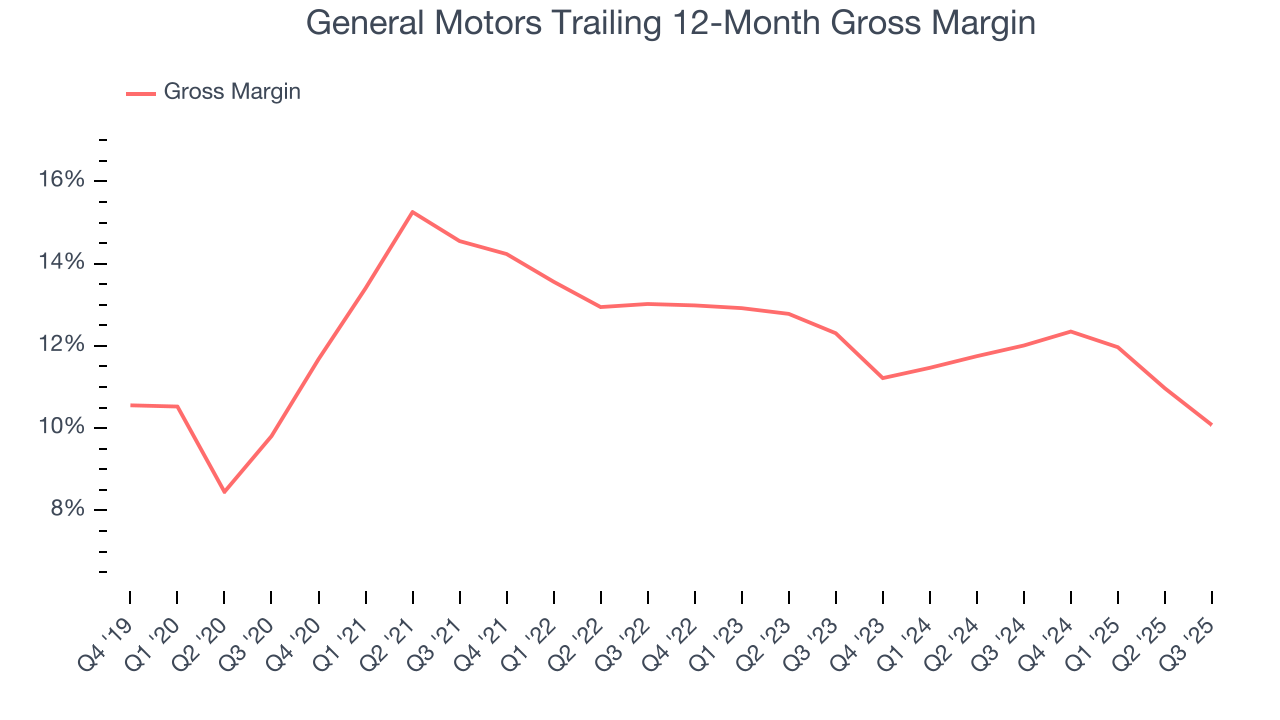
General Motors has bad unit economics for an industrials business, signaling it operates in a competitive market. This is also because it’s an automobile manufacturer.
Automobile manufacturers have structurally lower profitability as they often break even on the initial sale of vehicles and instead make money on parts and servicing, which come many years later - this explains why new entrants such as Rivian, Lucid, and Nikola have negative gross margins. As you can see below, these dynamics culminated in an average 12.2% gross margin for General Motors over the last five years.
7. Operating Margin
Operating margin is a key measure of profitability. Think of it as net income - the bottom line - excluding the impact of taxes and interest on debt, which are less connected to business fundamentals.
General Motors was profitable over the last five years but held back by its large cost base. Its average operating margin of 6.2% was weak for an industrials business. This result isn’t too surprising given its low gross margin as a starting point.
Analyzing the trend in its profitability, General Motors’s operating margin decreased by 2.3 percentage points over the last five years. This raises questions about the company’s expense base because its revenue growth should have given it leverage on its fixed costs, resulting in better economies of scale and profitability. We’ve noticed many Automobile Manufacturing companies also saw their margins fall (along with revenue, as mentioned above) because the cycle turned in the wrong direction, but General Motors’s performance was poor no matter how you look at it. It shows that costs were rising and it couldn’t pass them onto its customers.
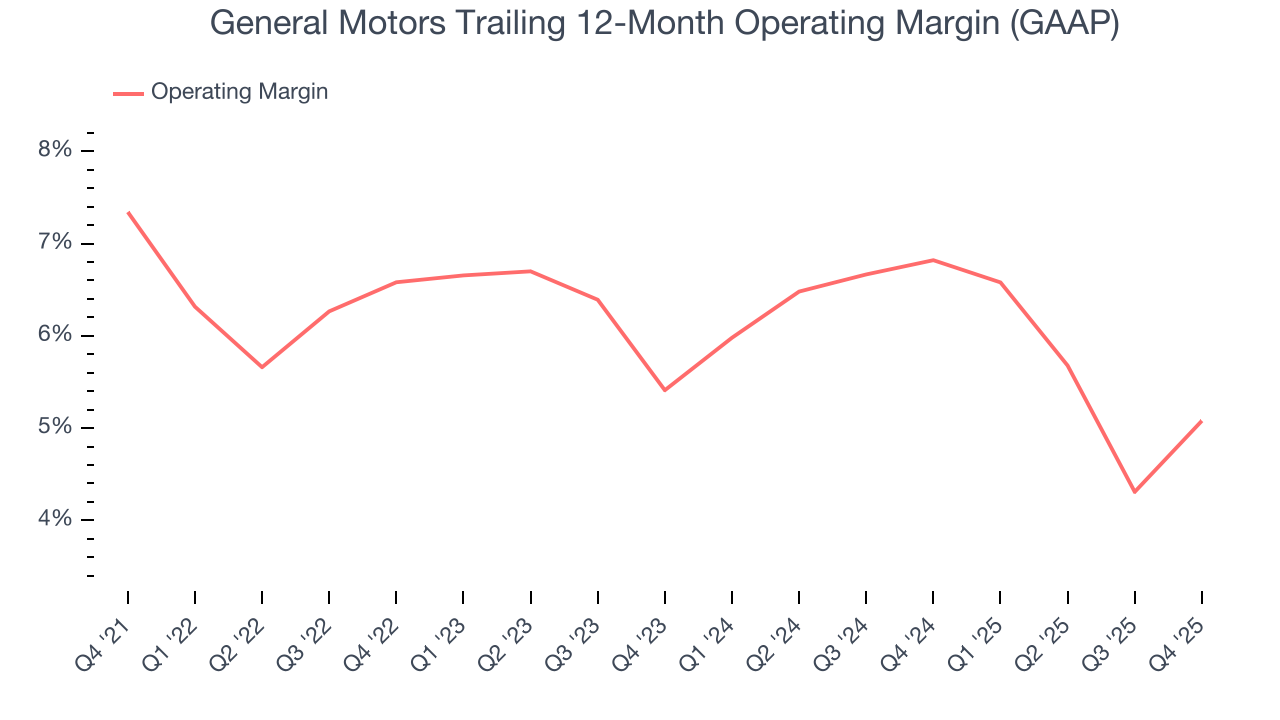
In Q4, General Motors generated an operating margin profit margin of 6.3%, up 3.1 percentage points year on year. The increase was a welcome development, especially since its revenue fell, showing it was more efficient because it scaled down its expenses.
8. Earnings Per Share
We track the long-term change in earnings per share (EPS) for the same reason as long-term revenue growth. Compared to revenue, however, EPS highlights whether a company’s growth is profitable.
General Motors’s EPS grew at a spectacular 16.8% compounded annual growth rate over the last five years, higher than its 8.6% annualized revenue growth. However, this alone doesn’t tell us much about its business quality because its operating margin didn’t improve.
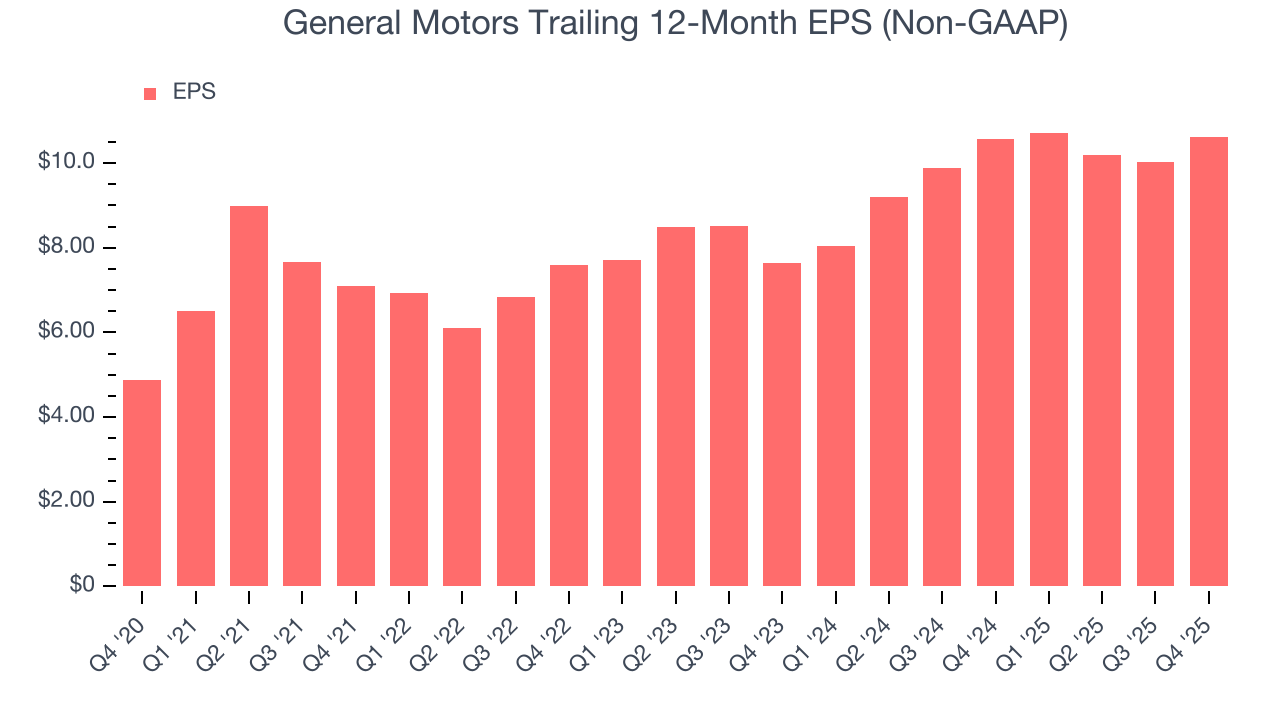
We can take a deeper look into General Motors’s earnings to better understand the drivers of its performance. A five-year view shows that General Motors has repurchased its stock, shrinking its share count by 36.3%. This tells us its EPS outperformed its revenue not because of increased operational efficiency but financial engineering, as buybacks boost per share earnings. 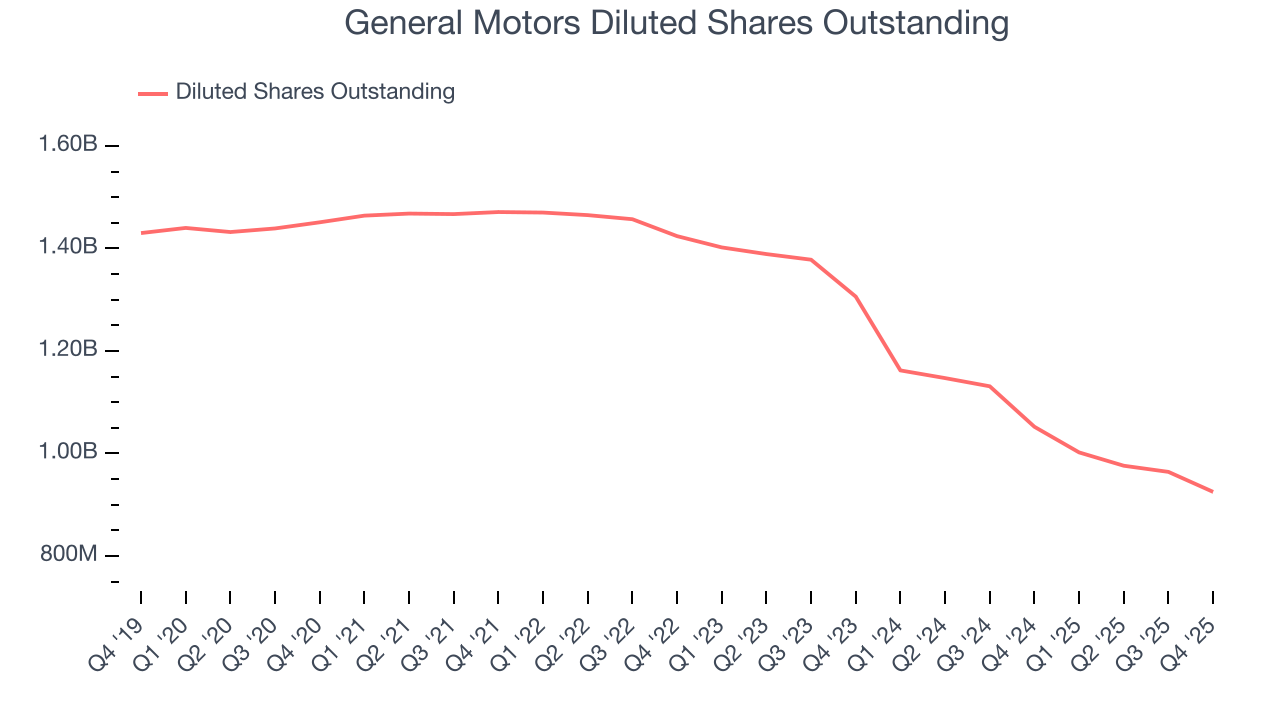
Like with revenue, we analyze EPS over a more recent period because it can provide insight into an emerging theme or development for the business.
For General Motors, its two-year annual EPS growth of 17.9% was higher than its five-year trend. We love it when earnings growth accelerates, especially when it accelerates off an already high base.
In Q4, General Motors reported adjusted EPS of $2.51, up from $1.92 in the same quarter last year. This print easily cleared analysts’ estimates, and shareholders should be content with the results. Over the next 12 months, Wall Street expects General Motors’s full-year EPS of $10.62 to grow 14.9%.
9. Cash Is King
Although earnings are undoubtedly valuable for assessing company performance, we believe cash is king because you can’t use accounting profits to pay the bills.
General Motors has shown decent cash profitability, giving it some flexibility to reinvest or return capital to investors. The company’s free cash flow margin averaged 6.2% over the last five years, slightly better than the broader industrials sector.
Taking a step back, we can see that General Motors’s margin expanded by 3.7 percentage points during that time. This shows the company is heading in the right direction, and we can see it became a less capital-intensive business because its free cash flow profitability rose while its operating profitability fell.
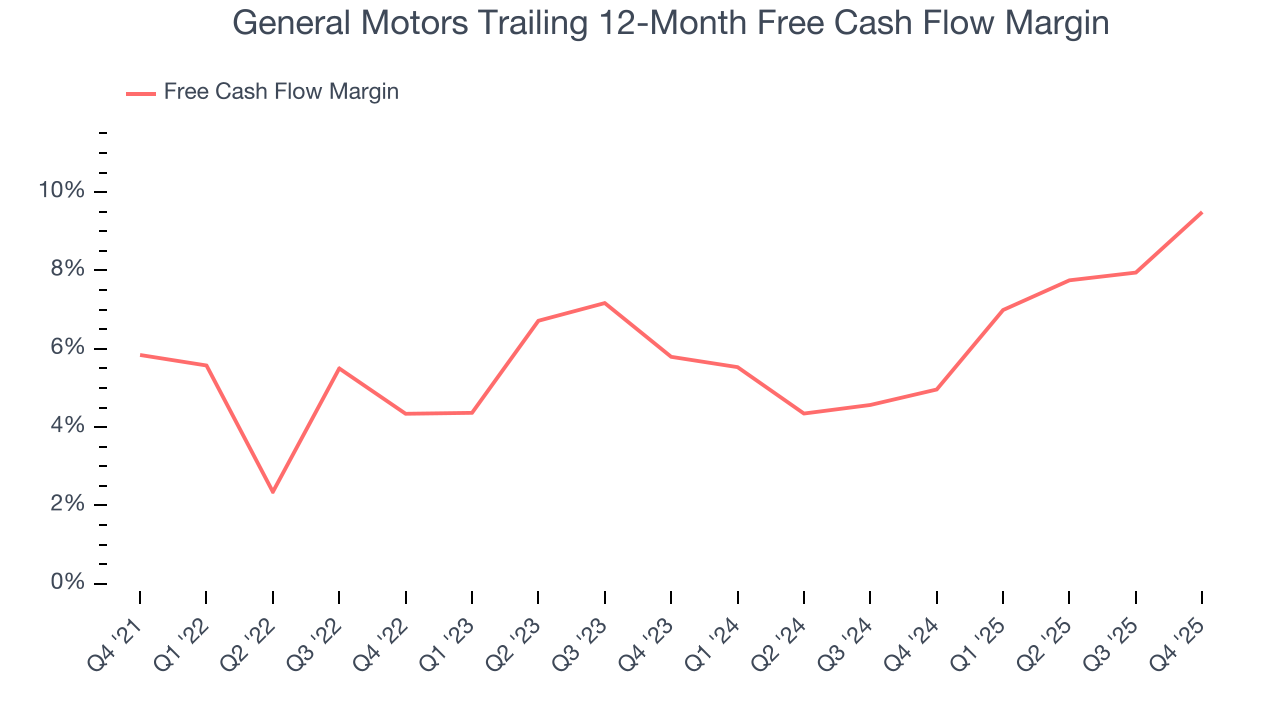
General Motors’s free cash flow clocked in at $3.58 billion in Q4, equivalent to a 7.9% margin. This result was good as its margin was 6 percentage points higher than in the same quarter last year, building on its favorable historical trend.
10. Return on Invested Capital (ROIC)
EPS and free cash flow tell us whether a company was profitable while growing its revenue. But was it capital-efficient? Enter ROIC, a metric showing how much operating profit a company generates relative to the money it has raised (debt and equity).
Although General Motors hasn’t been the highest-quality company lately, it historically found a few growth initiatives that worked out well. Its five-year average ROIC was 14%, impressive for an industrials business.
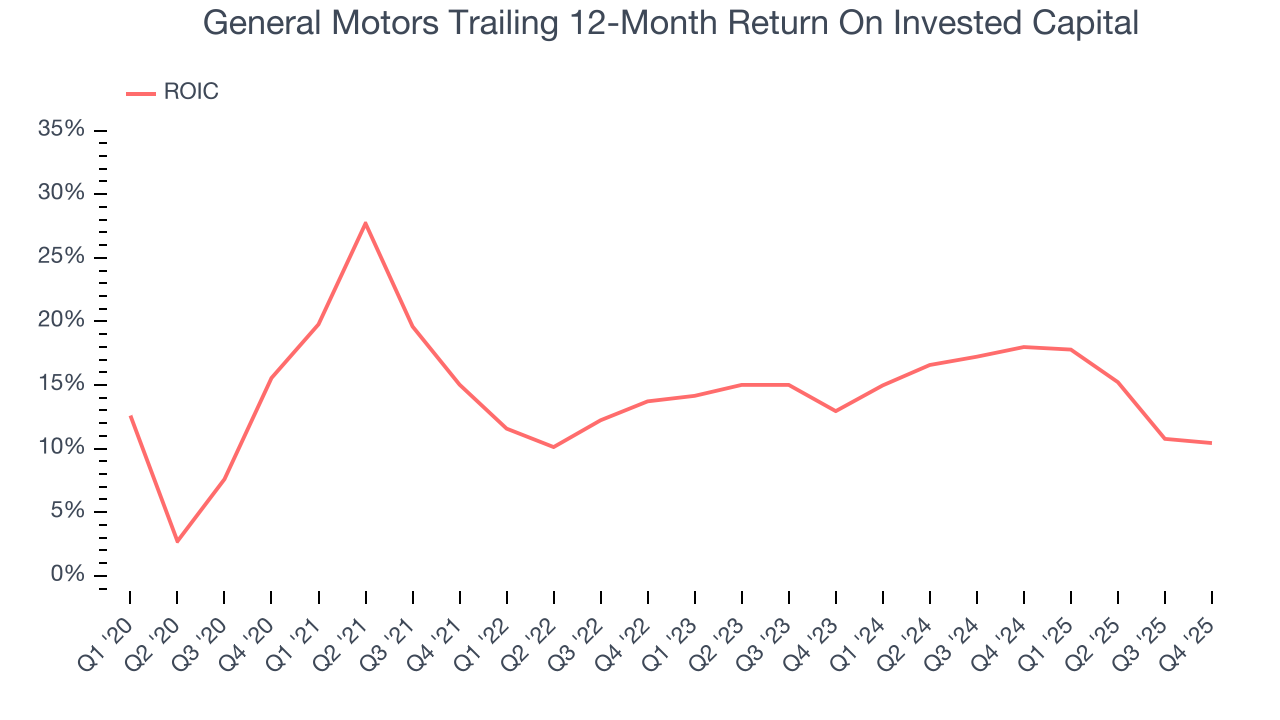
We like to invest in businesses with high returns, but the trend in a company’s ROIC is what often surprises the market and moves the stock price. Uneventfully, General Motors’s ROIC has stayed the same over the last few years. Given the company’s underwhelming financial performance in other areas, we’d like to see its returns improve before recommending the stock.
11. Balance Sheet Risk
Debt is a tool that can boost company returns but presents risks if used irresponsibly. As long-term investors, we aim to avoid companies taking excessive advantage of this instrument because it could lead to insolvency.
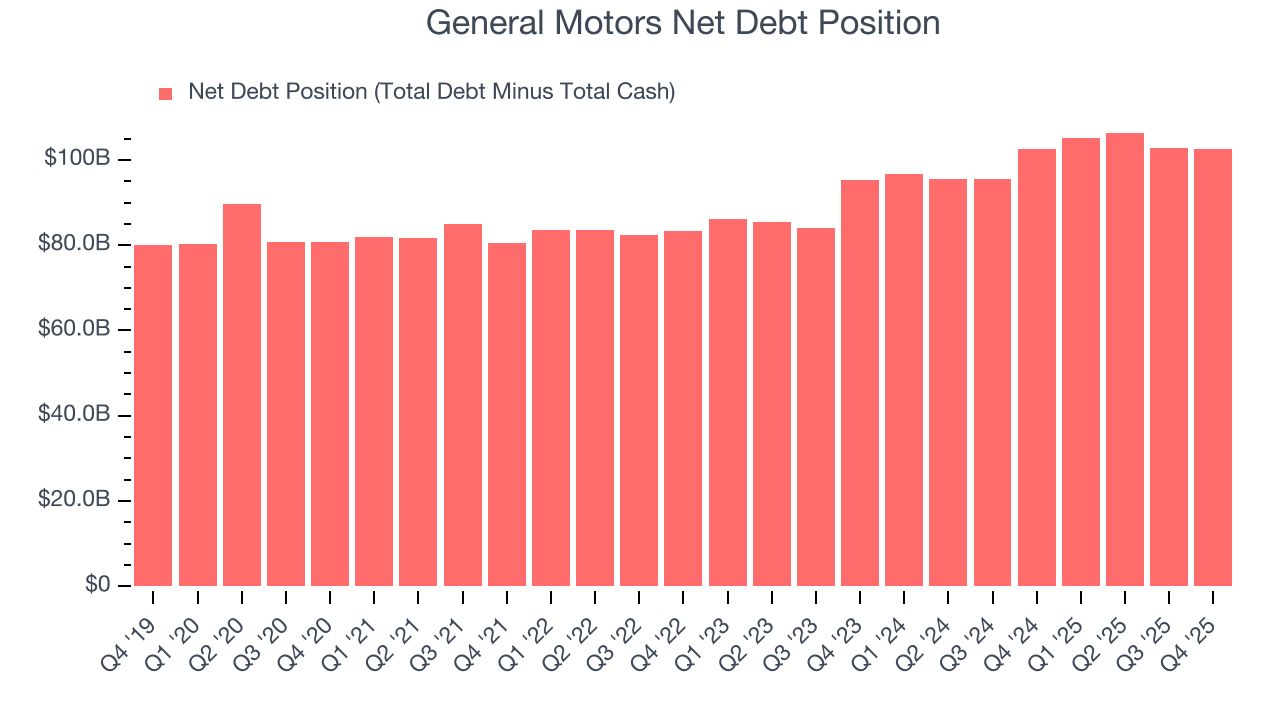
General Motors’s $130.3 billion of debt exceeds the $27.67 billion of cash on its balance sheet. Furthermore, its 6× net-debt-to-EBITDA ratio (based on its EBITDA of $17.14 billion over the last 12 months) shows the company is overleveraged.
At this level of debt, incremental borrowing becomes increasingly expensive and credit agencies could downgrade the company’s rating if profitability falls. General Motors could also be backed into a corner if the market turns unexpectedly – a situation we seek to avoid as investors in high-quality companies.
We hope General Motors can improve its balance sheet and remain cautious until it increases its profitability or pays down its debt.
12. Key Takeaways from General Motors’s Q4 Results
It was good to see General Motors provide full-year EPS guidance that slightly beat analysts’ expectations. We were also glad its EPS outperformed Wall Street’s estimates. On the other hand, its revenue slightly missed. Overall, this print had some key positives. The stock traded up 4.9% to $83.30 immediately following the results.
13. Is Now The Time To Buy General Motors?
Updated: March 13, 2026 at 11:37 PM EDT
Are you wondering whether to buy General Motors or pass? We urge investors to not only consider the latest earnings results but also longer-term business quality and valuation as well.
General Motors isn’t a terrible business, but it isn’t one of our picks. Although its revenue growth was good over the last five years, it’s expected to deteriorate over the next 12 months and its declining operating margin shows the business has become less efficient. And while the company’s projected EPS for the next year implies the company’s fundamentals will improve, the downside is its low gross margins indicate some combination of competitive pressures and high production costs.
General Motors’s P/E ratio based on the next 12 months is 5.9x. This valuation is reasonable, but the company’s shakier fundamentals present too much downside risk. We're pretty confident there are superior stocks to buy right now.
Wall Street analysts have a consensus one-year price target of $95.04 on the company (compared to the current share price of $72.32).
Although the price target is bullish, readers should exercise caution because analysts tend to be overly optimistic. The firms they work for, often big banks, have relationships with companies that extend into fundraising, M&A advisory, and other rewarding business lines. As a result, they typically hesitate to say bad things for fear they will lose out. We at StockStory do not suffer from such conflicts of interest, so we’ll always tell it like it is.