
Genco (GNK)
We wouldn’t buy Genco. Its weak revenue growth and gross margin show it not only lacks demand but also decent unit economics.― StockStory Analyst Team
1. News


2. Summary
Why We Think Genco Will Underperform
Headquartered in NYC, Genco (NYSE:GNK) is a shipping company that transports dry bulk cargo along worldwide maritime routes.
- Annual sales declines of 2.1% for the past two years show its products and services struggled to connect with the market during this cycle
- Earnings per share decreased by more than its revenue over the last two years, showing each sale was less profitable
- Sluggish trends in its owned vessels suggest customers aren’t adopting its solutions as quickly as the company hoped


Genco is skating on thin ice. We see more attractive opportunities in the market.
Why There Are Better Opportunities Than Genco


Genco is trading at $19.93 per share, or 17.4x forward P/E. Genco’s valuation may seem like a bargain, especially when stacked up against other industrials companies. We remind you that you often get what you pay for, though.
It’s better to pay up for high-quality businesses with higher long-term earnings potential rather than to buy lower-quality stocks because they appear cheap. These challenged businesses often don’t re-rate, a phenomenon known as a “value trap”.
3. Genco (GNK) Research Report: Q4 CY2025 Update
Maritime shipping company Genco (NYSE:GNK) beat Wall Street’s revenue expectations in Q4 CY2025, with sales up 62.8% year on year to $109.9 million. Its non-GAAP profit of $0.39 per share was 5.8% above analysts’ consensus estimates.
Genco (GNK) Q4 CY2025 Highlights:
- Revenue: $109.9 million vs analyst estimates of $77.21 million (62.8% year-on-year growth, 42.4% beat)
- Adjusted EPS: $0.39 vs analyst estimates of $0.37 (5.8% beat)
- Adjusted EBITDA: $41.99 million vs analyst estimates of $40.44 million (38.2% margin, 3.8% beat)
- Operating Margin: 17.3%, down from 21.6% in the same quarter last year
- Free Cash Flow was -$57.62 million compared to -$20.45 million in the same quarter last year
- owned vessels: 43, up 1 year on year
- Market Capitalization: $960.4 million
Company Overview
Headquartered in NYC, Genco (NYSE:GNK) is a shipping company that transports dry bulk cargo along worldwide maritime routes.
Genco was established to capitalize on a growing demand for maritime freight solutions that could efficiently transport bulk commodities across global routes.
Specifically, the company specializes in transporting dry commodities such as iron ore, coal, grain, and steel through its fleet of vessels, which includes Capesize (large bulk carriers), Supramax (small bulk carriers), and Panamax (designed to pass through the Panama Canal) ships. For instance, Genco might use a Capesize ship to transport coal from mining facilities in Australia to power plants in Asia.
Revenue is generated from spot market charters and time charter agreements, and the company sells its shipping services directly to commodity traders, producers, and consumers. The cost structure incorporates fixed costs such as vessel maintenance and management, alongside variable costs like fuel and port charges. While the shipping industry can be cyclical because revenues are based on charter rates and global trade volumes, time charters provide a relatively more stable, recurring revenue base.
4. Marine Transportation
The growth of e-commerce and global trade continues to drive demand for shipping services, presenting opportunities for marine transportation companies. While ocean freight is more fuel efficient and therefore cheaper than its air and ground counterparts, it results in slower delivery times, presenting a trade off. To improve transit speeds, the industry continues to invest in digitization to optimize fleets and routes. However, marine transportation companies are still at the whim of economic cycles. Consumer spending, for example, can greatly impact the demand for these companies’ offerings while fuel costs can influence profit margins. Geopolitical tensions can also affect access to trade routes, and if certain countries are banned from using passageways like the Panama Canal, costs can spiral out of control.
Competitors in the maritime transportation industry include Diana Shipping (NYSE:DSX), Eagle Bulk Shipping (NASDAQ:EGLE), and Safe Bulkers (NYSE:SB)
5. Revenue Growth
A company’s long-term performance is an indicator of its overall quality. Any business can have short-term success, but a top-tier one grows for years. Over the last five years, Genco grew its sales at a tepid 5.6% compounded annual growth rate. This fell short of our benchmark for the industrials sector and is a rough starting point for our analysis.
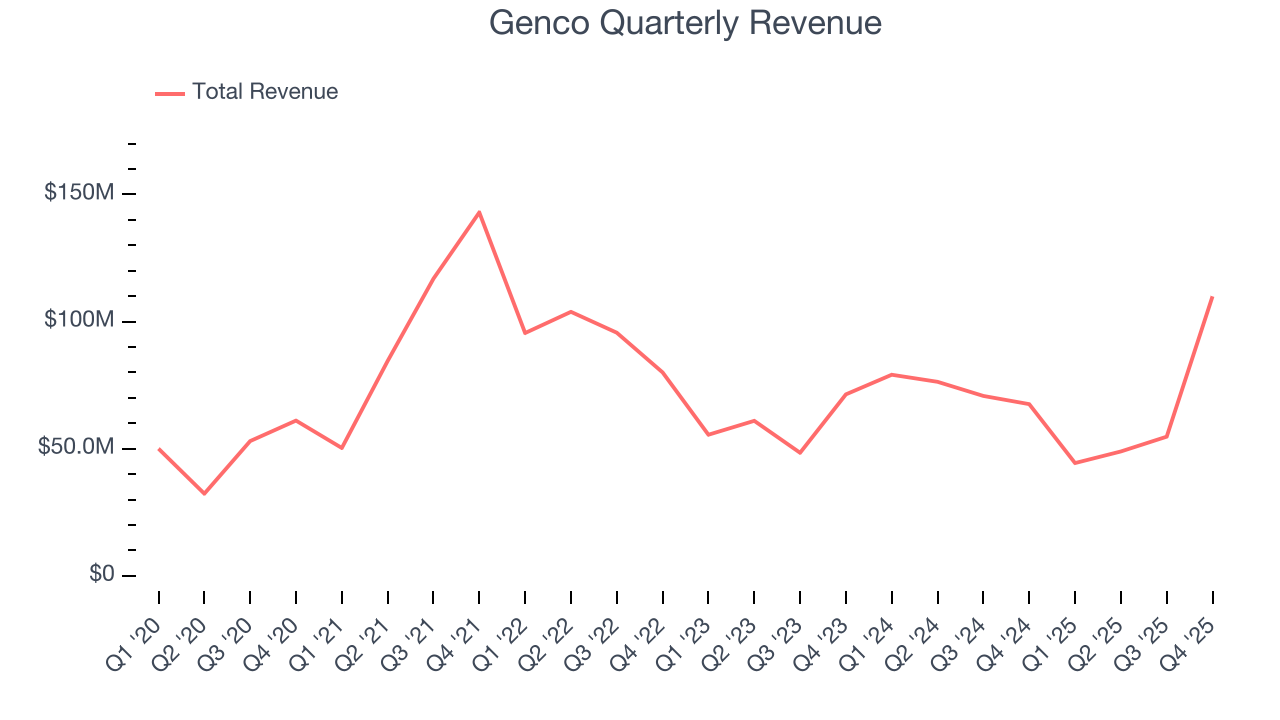
We at StockStory place the most emphasis on long-term growth, but within industrials, a half-decade historical view may miss cycles, industry trends, or a company capitalizing on catalysts such as a new contract win or a successful product line. Genco’s recent performance shows its demand has slowed as its annualized revenue growth of 4.5% over the last two years was below its five-year trend. We’re wary when companies in the sector see decelerations in revenue growth, as it could signal changing consumer tastes aided by low switching costs. 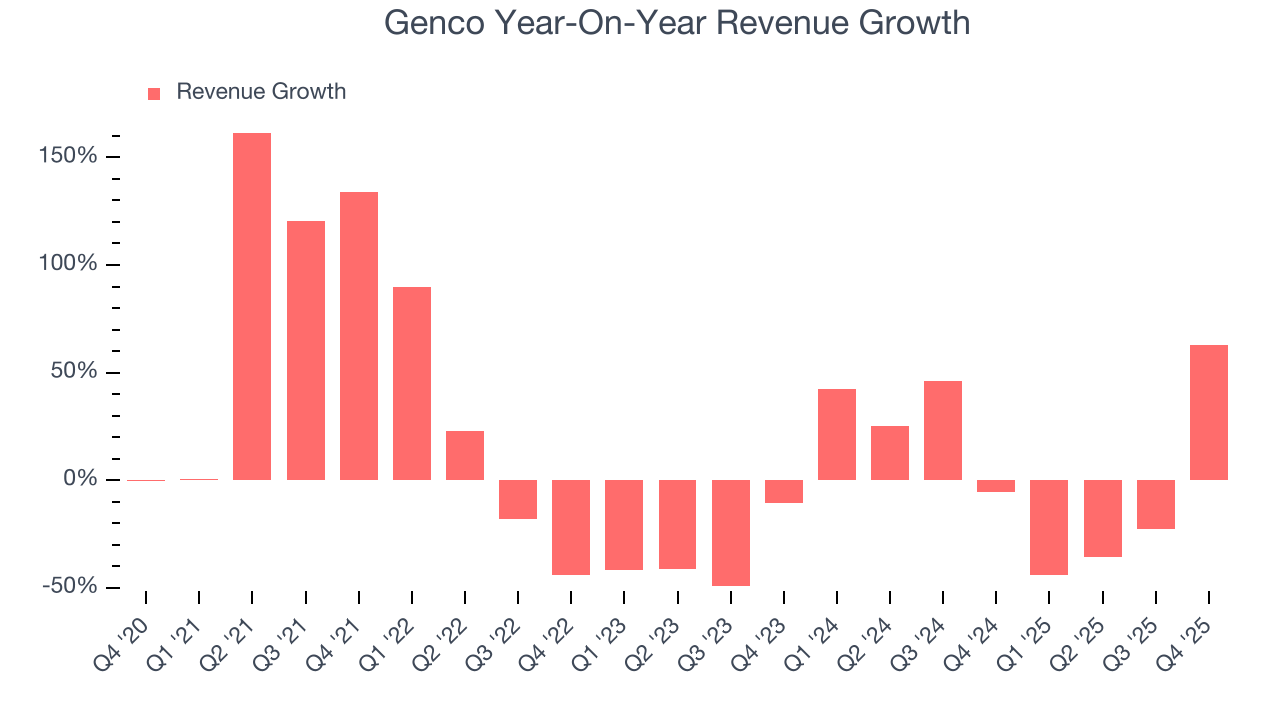
We can better understand the company’s revenue dynamics by analyzing its number of owned vessels, which reached 43 in the latest quarter. Over the last two years, Genco’s owned vessels averaged 1.7% year-on-year declines. Because this number is lower than its revenue growth during the same period, we can see the company’s monetization has risen. 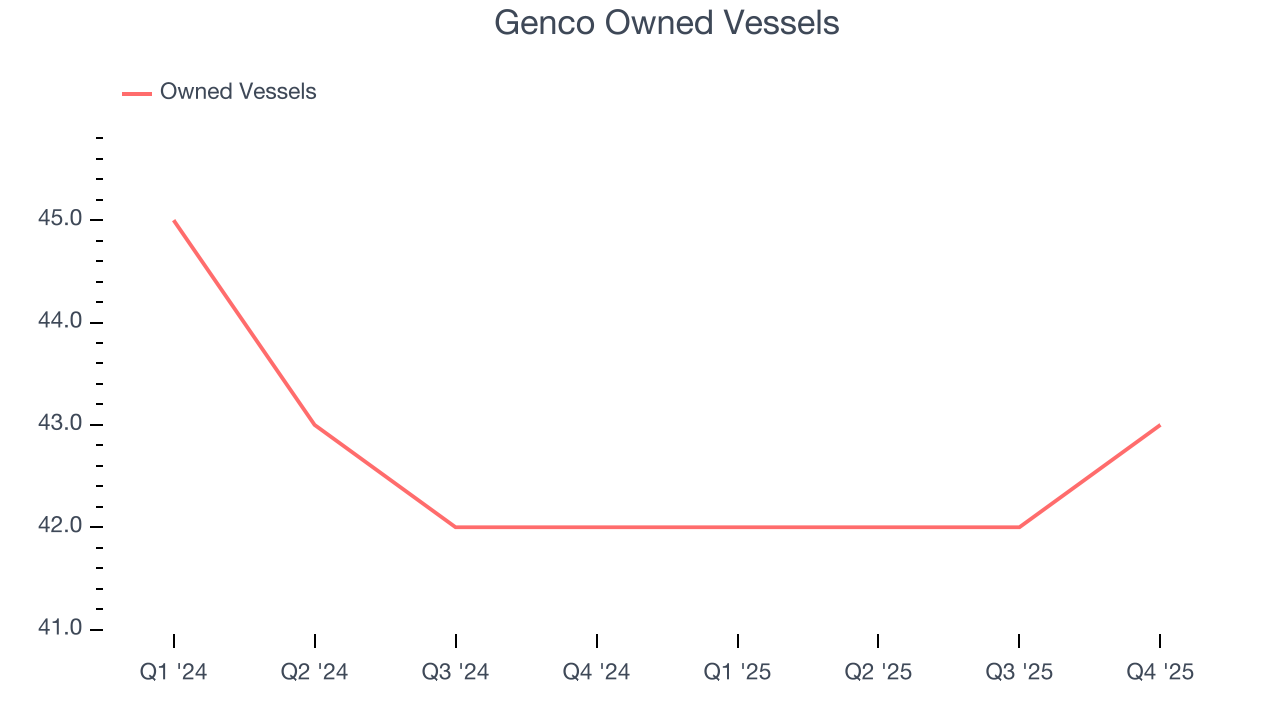
This quarter, Genco reported magnificent year-on-year revenue growth of 62.8%, and its $109.9 million of revenue beat Wall Street’s estimates by 42.4%.
Looking ahead, sell-side analysts expect revenue to grow 16.9% over the next 12 months, an improvement versus the last two years. This projection is eye-popping and implies its newer products and services will catalyze better top-line performance.
6. Gross Margin & Pricing Power
Cost of sales for an industrials business is usually comprised of the direct labor, raw materials, and supplies needed to offer a product or service. These costs can be impacted by inflation and supply chain dynamics.
Genco has bad unit economics for an industrials business, signaling it operates in a competitive market. As you can see below, it averaged a 19.7% gross margin over the last five years. Said differently, Genco had to pay a chunky $80.28 to its suppliers for every $100 in revenue. 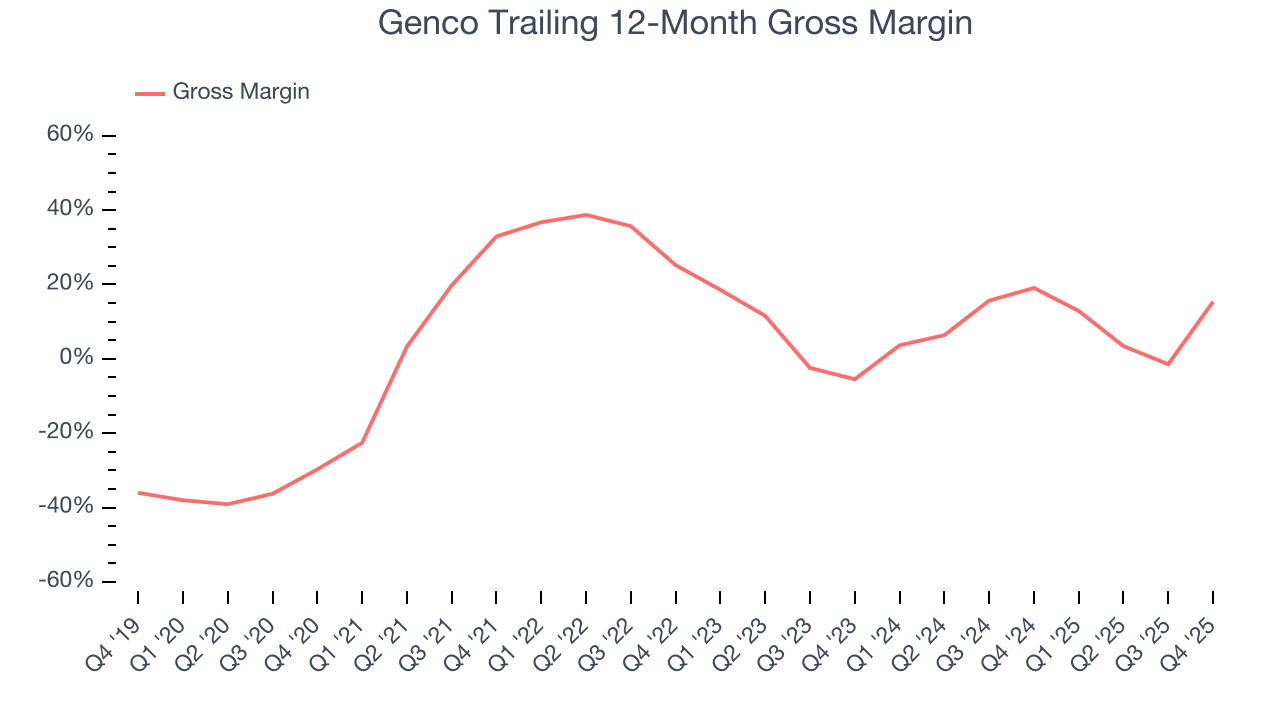
Genco produced a 48.5% gross profit margin in Q4, up 32.8 percentage points year on year. Zooming out, however, Genco’s full-year margin has been trending down over the past 12 months, decreasing by 3.7 percentage points. If this move continues, it could suggest a more competitive environment with some pressure to lower prices and higher input costs (such as raw materials and manufacturing expenses).
7. Operating Margin
Genco has been a well-oiled machine over the last five years. It demonstrated elite profitability for an industrials business, boasting an average operating margin of 29.3%. This result was particularly impressive because of its low gross margin, which is mostly a factor of what it sells and takes huge shifts to move meaningfully. Companies have more control over their operating margins, and it’s a show of well-managed operations if they’re high when gross margins are low.
Analyzing the trend in its profitability, Genco’s operating margin decreased by 48.1 percentage points over the last five years. This raises questions about the company’s expense base because its revenue growth should have given it leverage on its fixed costs, resulting in better economies of scale and profitability.
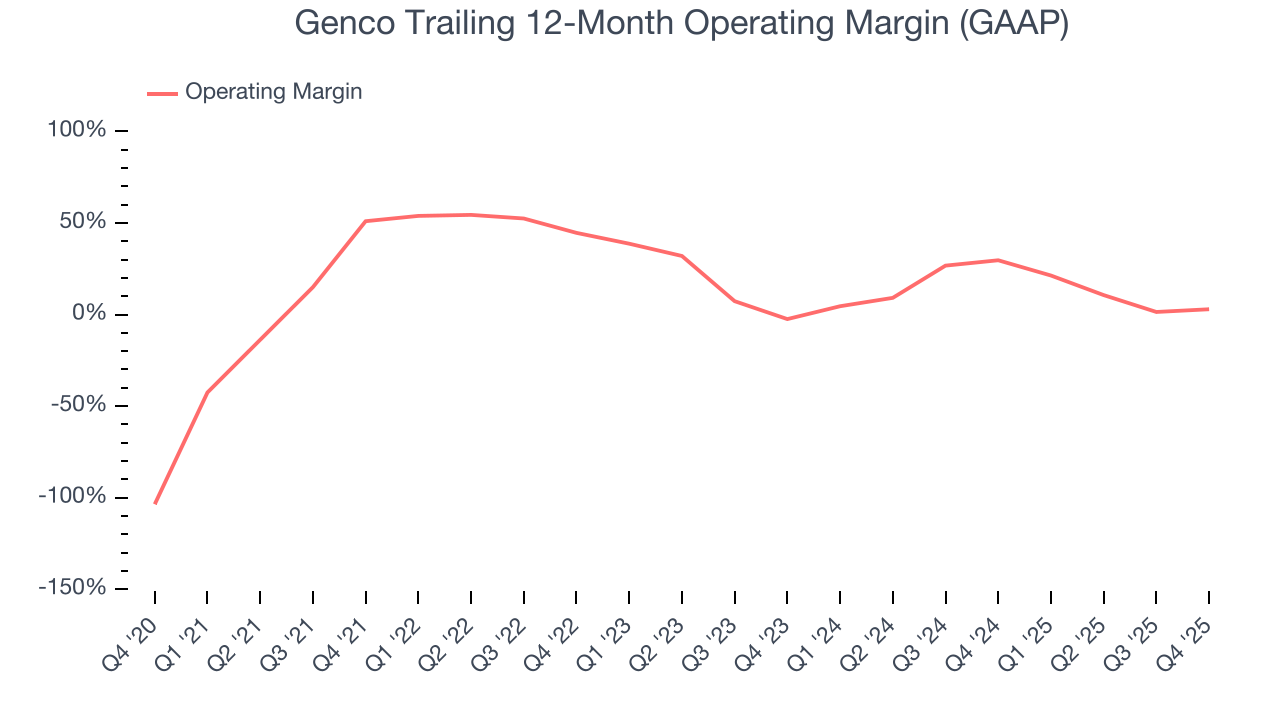
This quarter, Genco generated an operating margin profit margin of 17.3%, down 4.3 percentage points year on year. Conversely, its revenue and gross margin actually rose, so we can assume it was less efficient because its operating expenses like marketing, R&D, and administrative overhead grew faster than its revenue.
8. Earnings Per Share
Revenue trends explain a company’s historical growth, but the long-term change in earnings per share (EPS) points to the profitability of that growth – for example, a company could inflate its sales through excessive spending on advertising and promotions.
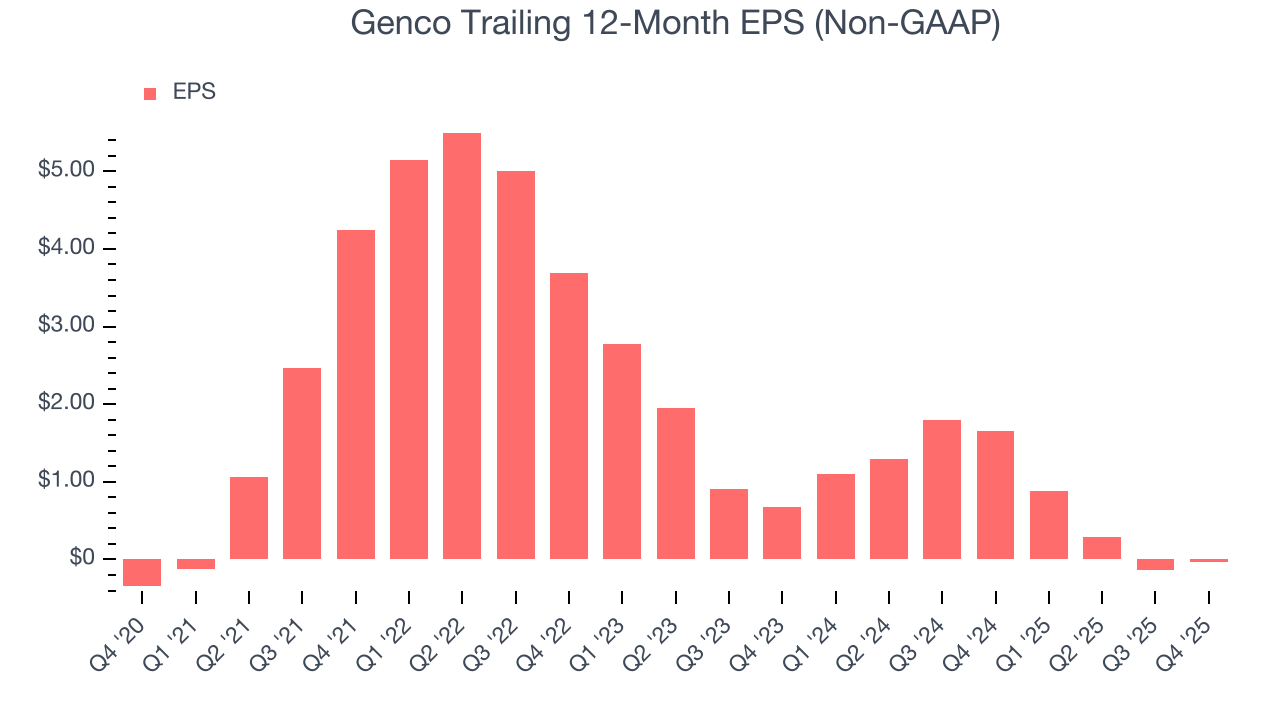
Although Genco’s full-year earnings are still negative, it reduced its losses and improved its EPS by 35.2% annually over the last five years. The next few quarters will be critical for assessing its long-term profitability.
Like with revenue, we analyze EPS over a shorter period to see if we are missing a change in the business.
Sadly for Genco, its EPS declined by 43.5% annually over the last two years while its revenue grew by 4.5%. This tells us the company became less profitable on a per-share basis as it expanded.
Diving into the nuances of Genco’s earnings can give us a better understanding of its performance. A two-year view shows Genco has diluted its shareholders, growing its share count by 2.1%. This dilution overshadowed its increased operational efficiency and has led to lower per share earnings. 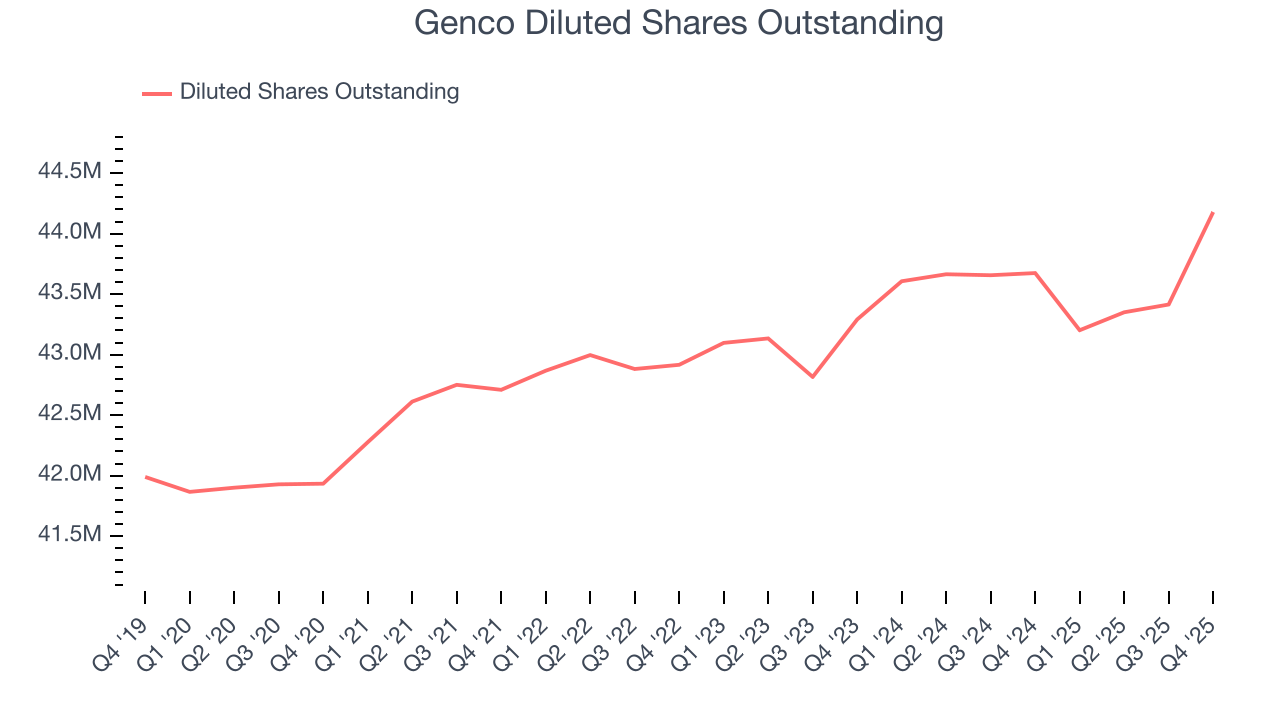
In Q4, Genco reported adjusted EPS of $0.39, up from $0.29 in the same quarter last year. This print beat analysts’ estimates by 5.8%. Over the next 12 months, Wall Street is optimistic. Analysts forecast Genco’s full-year EPS of negative $0.04 will flip to positive $1.40.
9. Cash Is King
If you’ve followed StockStory for a while, you know we emphasize free cash flow. Why, you ask? We believe that in the end, cash is king, and you can’t use accounting profits to pay the bills.
Genco has shown terrific cash profitability, putting it in an advantageous position to invest in new products, return capital to investors, and consolidate the market during industry downturns. The company’s free cash flow margin was among the best in the industrials sector, averaging 16.4% over the last five years.
Taking a step back, we can see that Genco’s margin dropped by 52.2 percentage points during that time. If its declines continue, it could signal increasing investment needs and capital intensity.
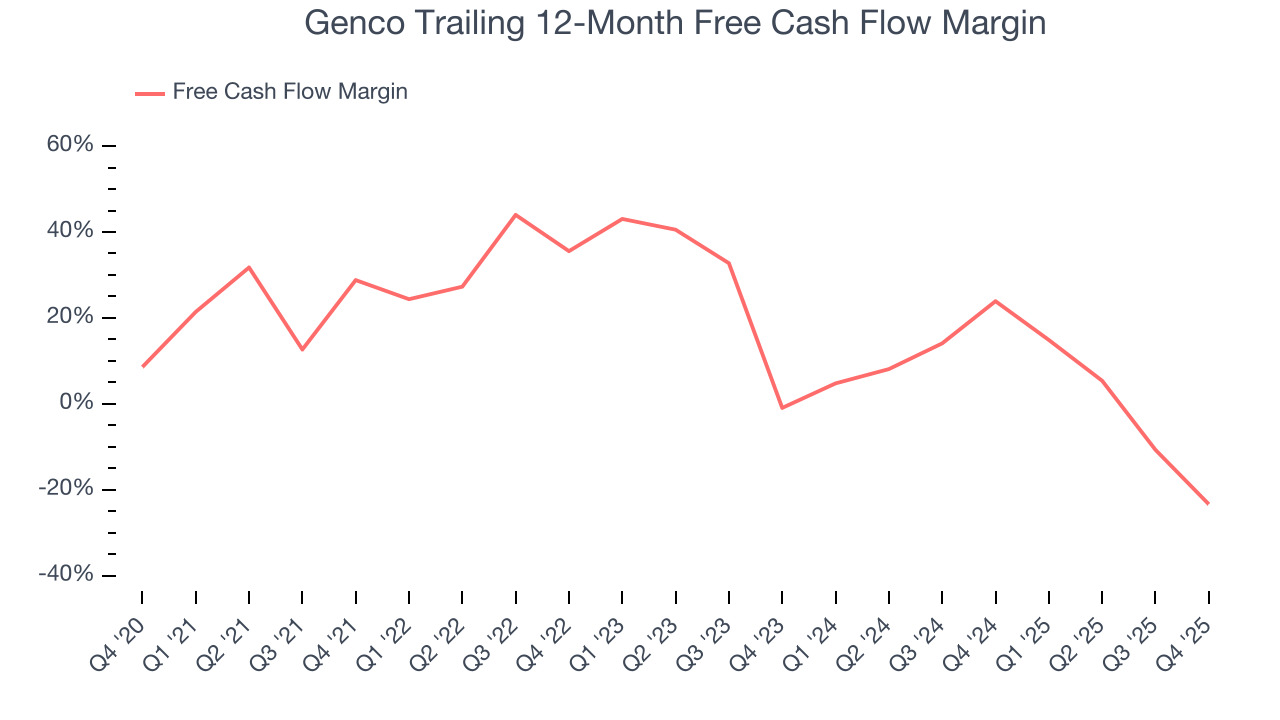
Genco burned through $57.62 million of cash in Q4, equivalent to a negative 52.4% margin. The company’s cash burn increased from $20.45 million of lost cash in the same quarter last year. These numbers deviate from its longer-term margin, indicating it is a seasonal business that must build up inventory during certain quarters.
10. Balance Sheet Assessment
Genco reported $55.54 million of cash and $194.6 million of debt on its balance sheet in the most recent quarter. As investors in high-quality companies, we primarily focus on two things: 1) that a company’s debt level isn’t too high and 2) that its interest payments are not excessively burdening the business.
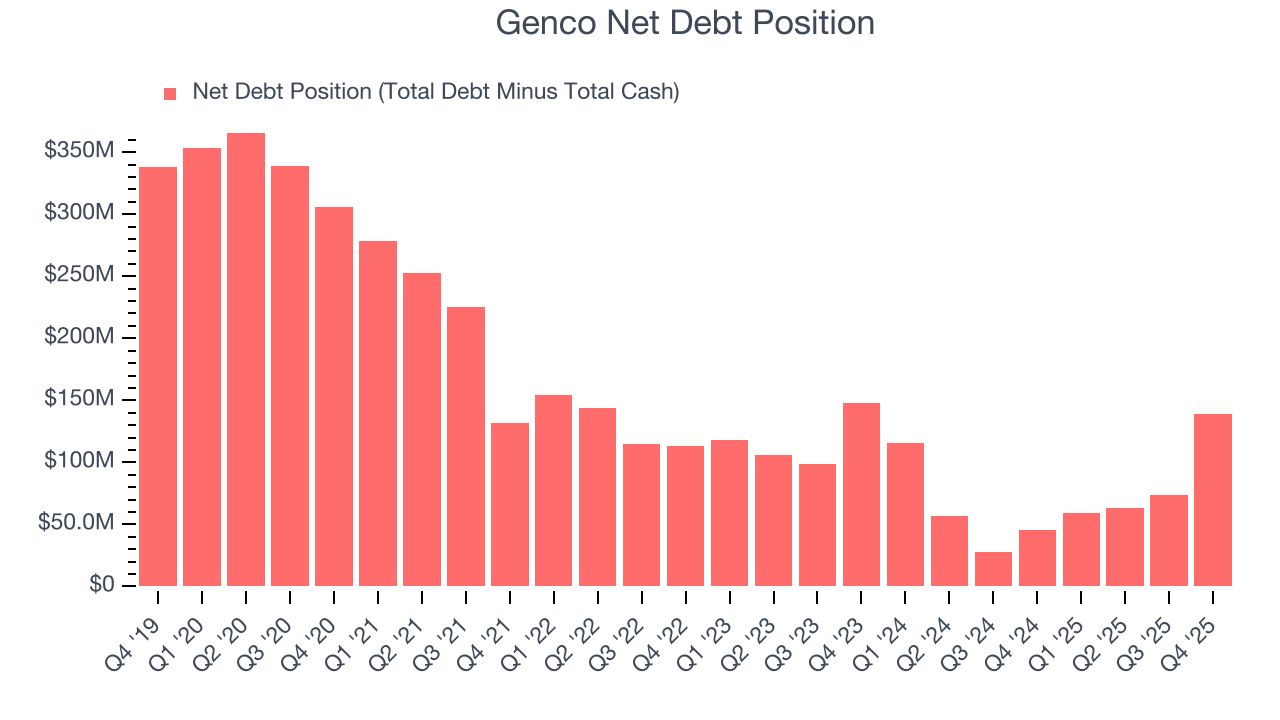
With $85.89 million of EBITDA over the last 12 months, we view Genco’s 1.6× net-debt-to-EBITDA ratio as safe. We also see its $3.74 million of annual interest expenses as appropriate. The company’s profits give it plenty of breathing room, allowing it to continue investing in growth initiatives.
11. Key Takeaways from Genco’s Q4 Results
We were impressed by how significantly Genco blew past analysts’ revenue expectations this quarter. We were also glad its EBITDA outperformed Wall Street’s estimates. Zooming out, we think this was a good print with some key areas of upside. The stock remained flat at $22.35 immediately after reporting.
12. Is Now The Time To Buy Genco?
Updated: March 14, 2026 at 11:27 PM EDT
Before deciding whether to buy Genco or pass, we urge investors to consider business quality, valuation, and the latest quarterly results.
We see the value of companies helping their customers, but in the case of Genco, we’re out. First off, its revenue growth was weak over the last five years. While its powerful free cash flow generation enables it to stay ahead of the competition through consistent reinvestment of profits, the downside is its declining operating margin shows the business has become less efficient. On top of that, its cash profitability fell over the last five years.
Genco’s P/E ratio based on the next 12 months is 17.4x. This valuation multiple is fair, but we don’t have much confidence in the company. There are better investments elsewhere.
Wall Street analysts have a consensus one-year price target of $27.63 on the company (compared to the current share price of $19.93).
Although the price target is bullish, readers should exercise caution because analysts tend to be overly optimistic. The firms they work for, often big banks, have relationships with companies that extend into fundraising, M&A advisory, and other rewarding business lines. As a result, they typically hesitate to say bad things for fear they will lose out. We at StockStory do not suffer from such conflicts of interest, so we’ll always tell it like it is.