HEICO (HEI)
We’re bullish on HEICO. Its fast revenue growth, profitability, and exceptional prospects make it a spectacular asset.― StockStory Analyst Team
1. News


2. Summary
Why We Like HEICO
Founded in 1957, HEICO (NYSE:HEI) manufactures and services aerospace and electronic components for commercial aviation, defense, space, and other industries.
- Market share has increased this cycle as its 22.2% annual revenue growth over the last five years was exceptional
- Earnings per share grew by 21.5% annually over the last five years, massively outpacing its peers
- Excellent operating margin highlights the strength of its business model, and it turbocharged its profits by achieving some fixed cost leverage


HEICO is a no-brainer. There are plenty of reasons to like the stock.
Is Now The Time To Buy HEICO?


At $276.10 per share, HEICO trades at 49.7x forward P/E. The lofty multiple means expectations are high for this company over the next six to twelve months.
Are you a fan of the company and believe in the bull case? If so, you can own a smaller position, as high-quality companies tend to outperform the market over a long-term period regardless of entry price.
3. HEICO (HEI) Research Report: Q4 CY2025 Update
Aerospace and defense company HEICO (NSYE:HEI) reported Q4 CY2025 results beating Wall Street’s revenue expectations, with sales up 14.4% year on year to $1.18 billion. Its GAAP profit of $1.35 per share was 5.1% above analysts’ consensus estimates.
HEICO (HEI) Q4 CY2025 Highlights:
- Revenue: $1.18 billion vs analyst estimates of $1.17 billion (14.4% year-on-year growth, 1.1% beat)
- EPS (GAAP): $1.35 vs analyst estimates of $1.29 (5.1% beat, but would have missed excluding "a discrete income tax benefit from stock option exercises")
- Adjusted EBITDA: $312 million vs analyst estimates of $313.5 million (26.5% margin, in line)
- Operating Margin: 22.1%, in line with the same quarter last year
- Free Cash Flow Margin: 14%, down from 18% in the same quarter last year
- Market Capitalization: $41.19 billion
Company Overview
Founded in 1957, HEICO (NYSE:HEI) manufactures and services aerospace and electronic components for commercial aviation, defense, space, and other industries.
HEICO was originally established to manufacture laboratory equipment, and later shifted its focus towards the aerospace industry. By the 1980s, HEICO began specializing in the production of aircraft parts and repair services, and by the 1990s, a transformation occurred whereby the company emphasized growth through acquisitions. This new approach expanded HEICO's presence in high-margin niche markets such as the design and manufacture of aircraft replacement parts and the repair and overhaul of industrial turbines.
Today, HEICO is a leader in the design, manufacture, and repair of engine parts, electronic systems, and power systems. The company's offerings ensure that customers' aerospace equipment is safe and properly maintained. In addition to aerospace components, HEICO's electronic offerings include specialized items like electromagnetic interference (EMI) shielding components used in medical imaging devices and advanced power supplies for satellite communications. HEICO also acts as a subcontractor supplying specialty aerospace parts to OEMs and provides vital components and services to the U.S. Department of Defense and related clients.
HEICO connects with its customers through a sales force that secures contracts for various services including supply and distribution agreements, maintenance contracts, and licensing deals for intellectual property and equipment. Additionally, HEICO facilitates direct customer engagement and order placement through its online platforms.
4. Aerospace
Aerospace companies often possess technical expertise and have made significant capital investments to produce complex products. It is an industry where innovation is important, and lately, emissions and automation are in focus, so companies that boast advances in these areas can take market share. On the other hand, demand for aerospace products can ebb and flow with economic cycles and geopolitical tensions, which can be particularly painful for companies with high fixed costs.
HEICO’s competitors include General Dynamics (NYSE:GD), Raytheon (NYSE:RTX), and TransDigm (NYSE:TDG)
5. Revenue Growth
A company’s long-term performance is an indicator of its overall quality. Any business can put up a good quarter or two, but the best consistently grow over the long haul. Thankfully, HEICO’s 22.2% annualized revenue growth over the last five years was incredible. Its growth surpassed the average industrials company and shows its offerings resonate with customers, a great starting point for our analysis.
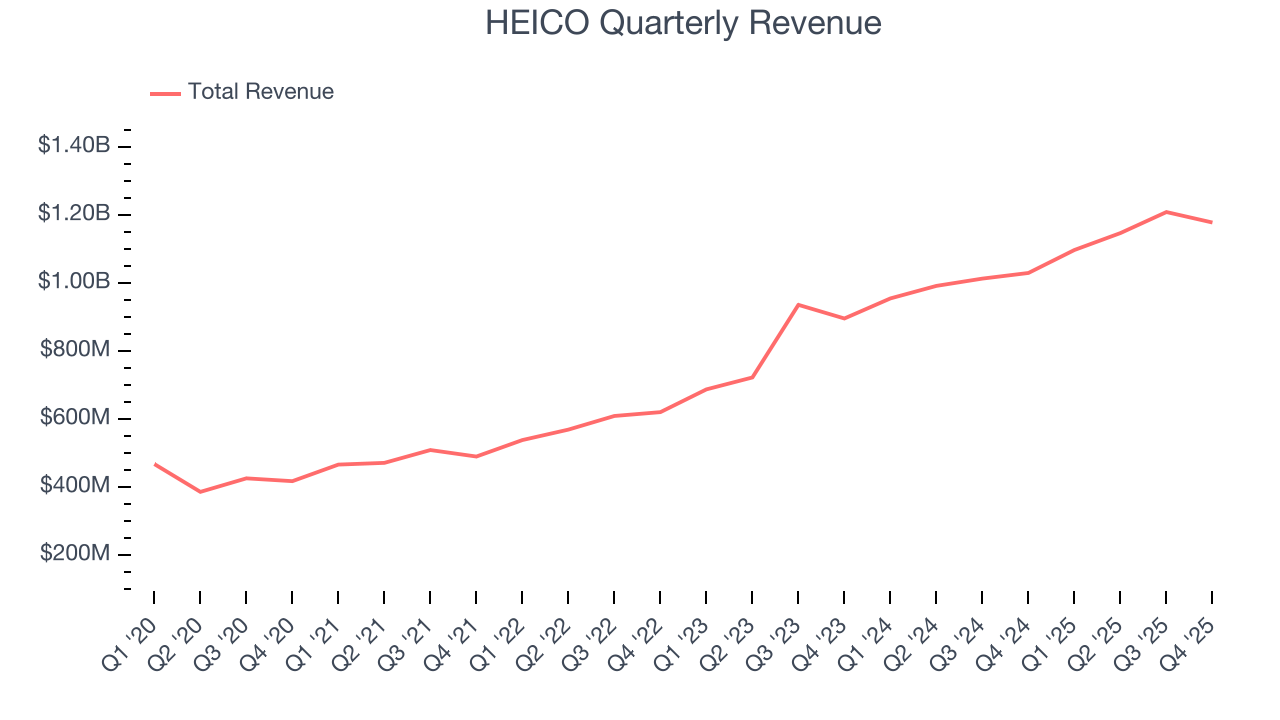
Long-term growth is the most important, but within industrials, a half-decade historical view may miss new industry trends or demand cycles. HEICO’s annualized revenue growth of 19.5% over the last two years is below its five-year trend, but we still think the results suggest healthy demand. 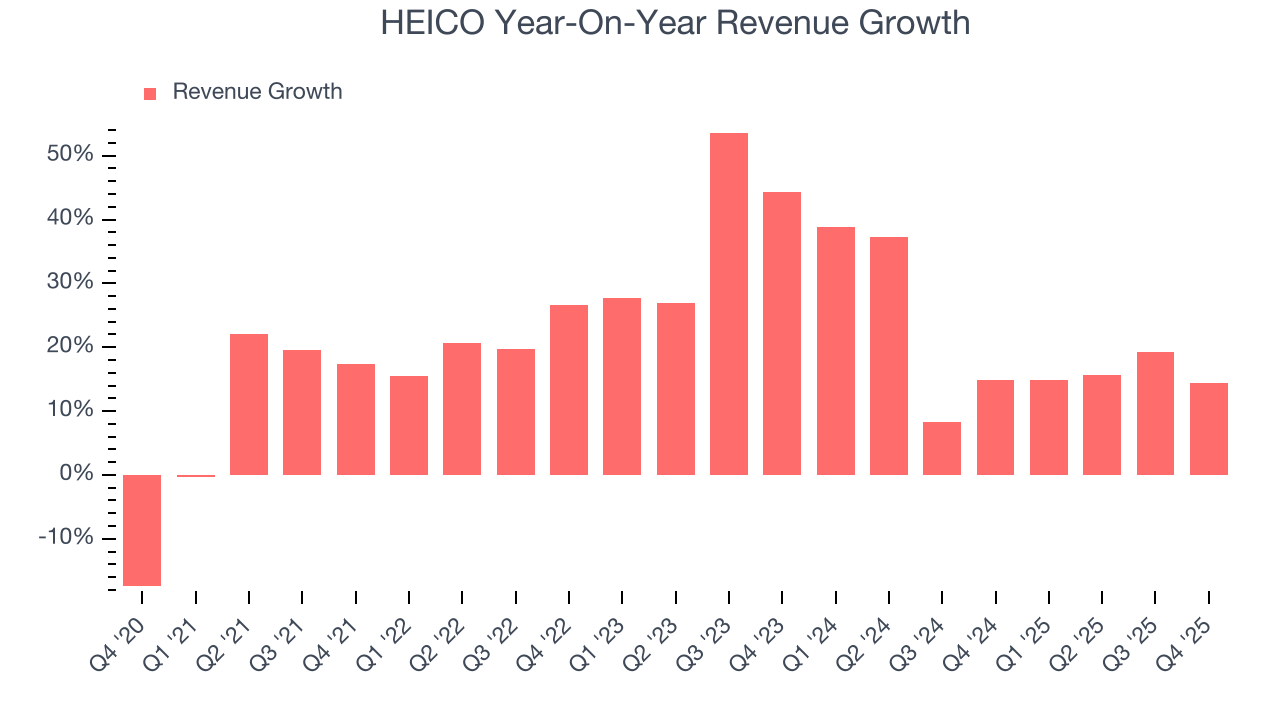
This quarter, HEICO reported year-on-year revenue growth of 14.4%, and its $1.18 billion of revenue exceeded Wall Street’s estimates by 1.1%.
Looking ahead, sell-side analysts expect revenue to grow 10.2% over the next 12 months, a deceleration versus the last two years. Despite the slowdown, this projection is noteworthy and suggests the market is forecasting success for its products and services.
6. Operating Margin
Operating margin is a key measure of profitability. Think of it as net income - the bottom line - excluding the impact of taxes and interest on debt, which are less connected to business fundamentals.
HEICO has been a well-oiled machine over the last five years. It demonstrated elite profitability for an industrials business, boasting an average operating margin of 21.9%.
Analyzing the trend in its profitability, HEICO’s operating margin rose by 1.5 percentage points over the last five years, as its sales growth gave it operating leverage.
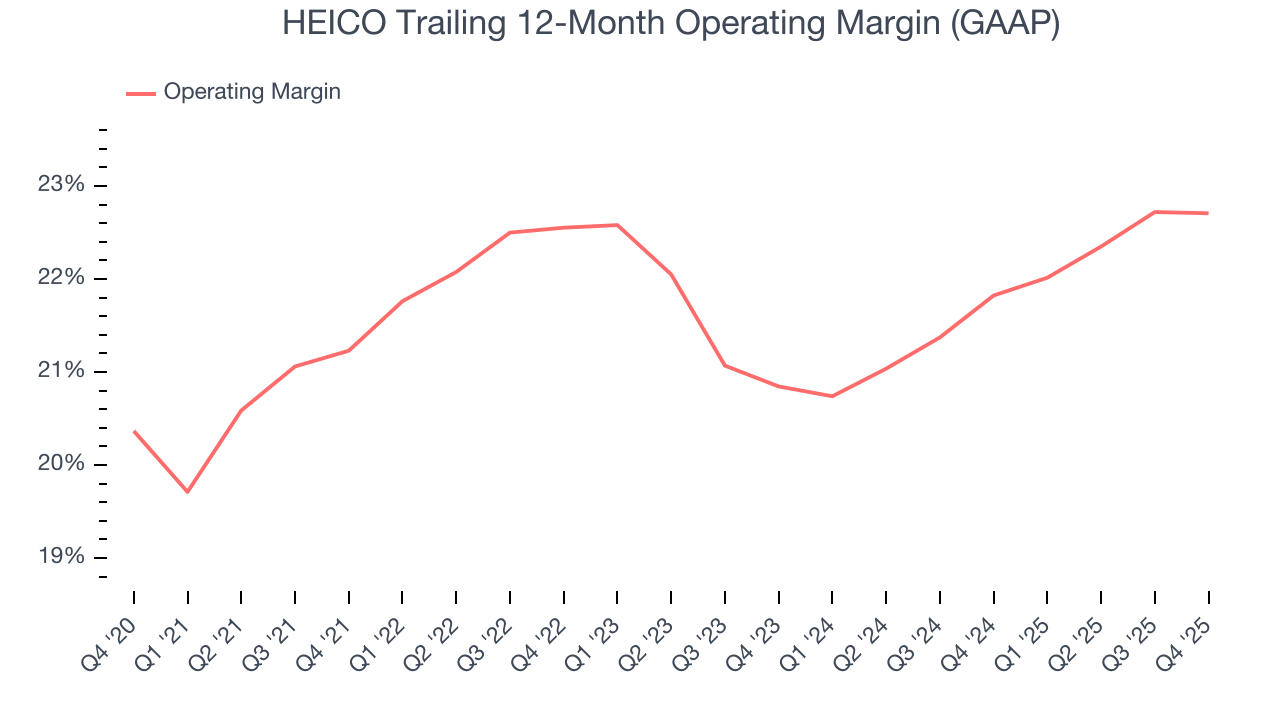
This quarter, HEICO generated an operating margin profit margin of 22.1%, in line with the same quarter last year. This indicates the company’s overall cost structure has been relatively stable.
7. Earnings Per Share
Revenue trends explain a company’s historical growth, but the long-term change in earnings per share (EPS) points to the profitability of that growth – for example, a company could inflate its sales through excessive spending on advertising and promotions.
HEICO’s astounding 21.5% annual EPS growth over the last five years aligns with its revenue performance. This tells us its incremental sales were profitable.
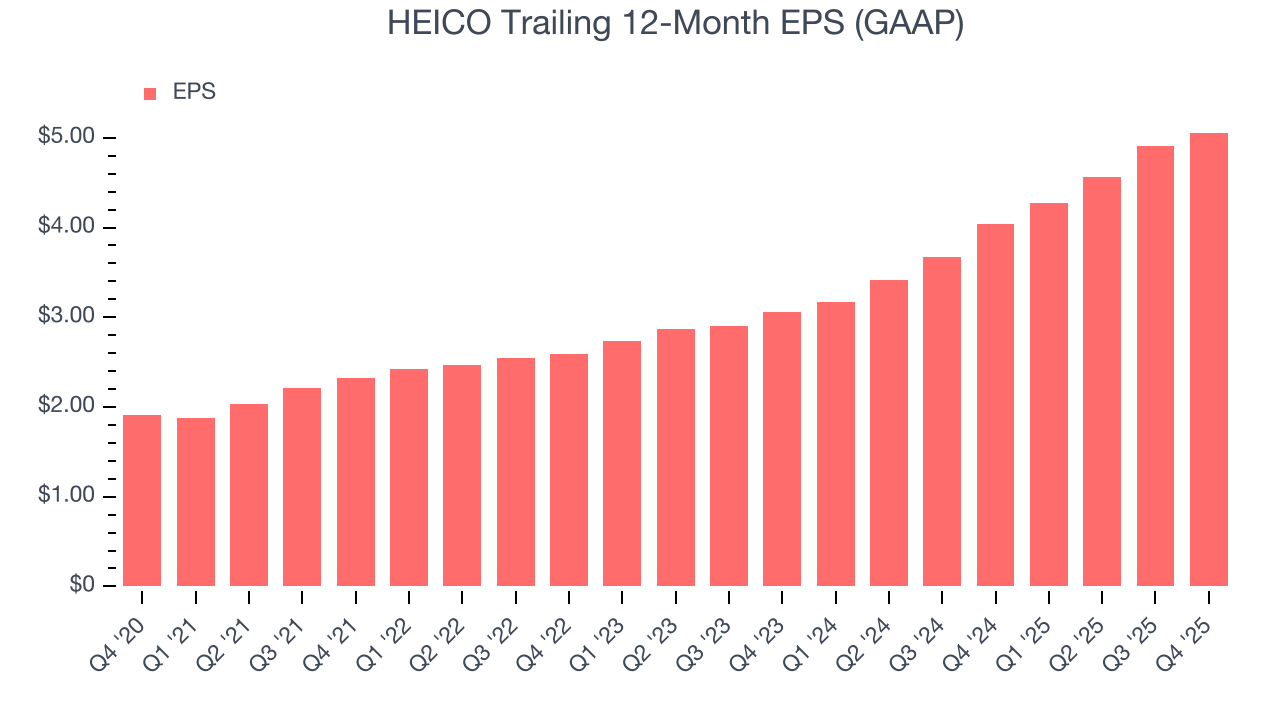
Like with revenue, we analyze EPS over a more recent period because it can provide insight into an emerging theme or development for the business.
HEICO’s two-year annual EPS growth of 28.7% was fantastic and topped its 19.5% two-year revenue growth.
We can take a deeper look into HEICO’s earnings to better understand the drivers of its performance. While we mentioned earlier that HEICO’s operating margin was flat this quarter, a two-year view shows its margin has expanded. This was the most relevant factor (aside from the revenue impact) behind its higher earnings; interest expenses and taxes can also affect EPS but don’t tell us as much about a company’s fundamentals.
In Q4, HEICO reported EPS of $1.35, up from $1.20 in the same quarter last year. This print beat analysts’ estimates by 5.1%. Over the next 12 months, Wall Street expects HEICO’s full-year EPS of $5.06 to grow 13.3%.
8. Cash Is King
If you’ve followed StockStory for a while, you know we emphasize free cash flow. Why, you ask? We believe that in the end, cash is king, and you can’t use accounting profits to pay the bills.
HEICO has shown terrific cash profitability, putting it in an advantageous position to invest in new products, return capital to investors, and consolidate the market during industry downturns. The company’s free cash flow margin was among the best in the industrials sector, averaging 17.3% over the last five years.
Taking a step back, we can see that HEICO’s margin dropped by 1.7 percentage points during that time. We’re willing to live with its performance for now but hope its cash conversion can rise soon. If its declines continue, it could signal increasing investment needs and capital intensity.
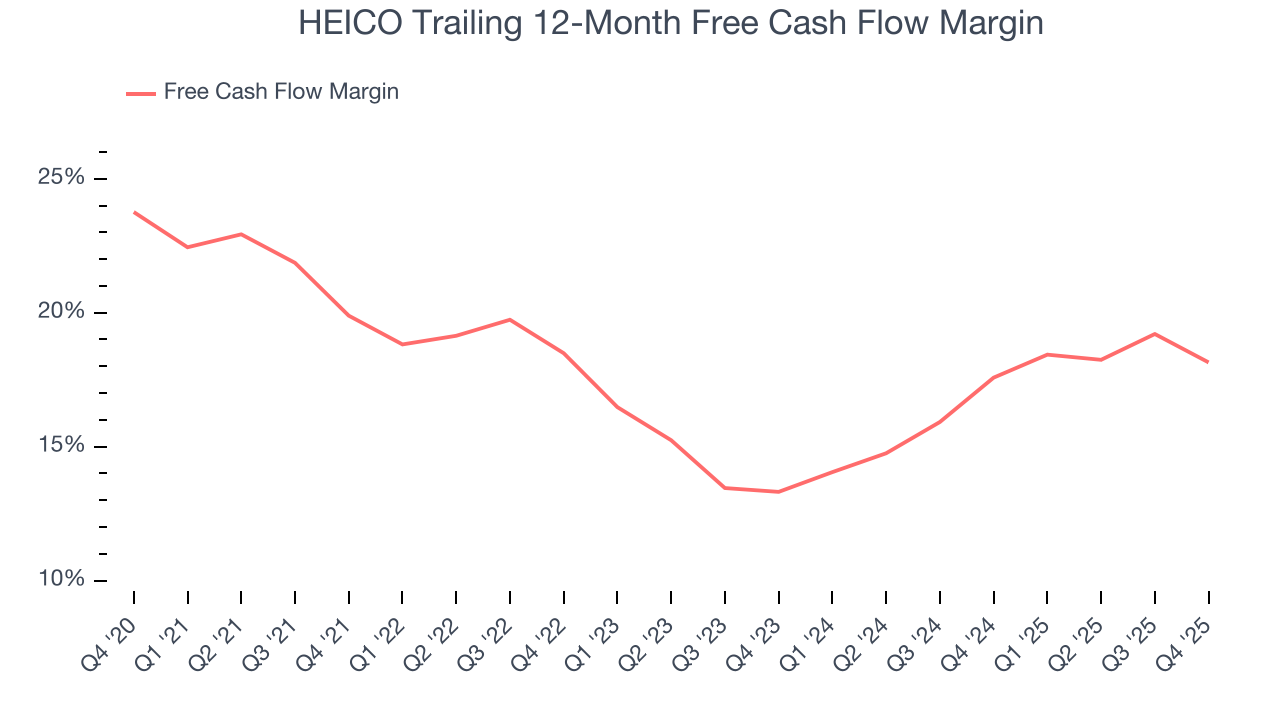
HEICO’s free cash flow clocked in at $165.1 million in Q4, equivalent to a 14% margin. The company’s cash profitability regressed as it was 4 percentage points lower than in the same quarter last year, which isn’t ideal considering its longer-term trend.
9. Return on Invested Capital (ROIC)
EPS and free cash flow tell us whether a company was profitable while growing its revenue. But was it capital-efficient? A company’s ROIC explains this by showing how much operating profit it makes compared to the money it has raised (debt and equity).
HEICO’s five-year average ROIC was 12.7%, higher than most industrials businesses. This illustrates its management team’s ability to invest in profitable growth opportunities and generate value for shareholders.
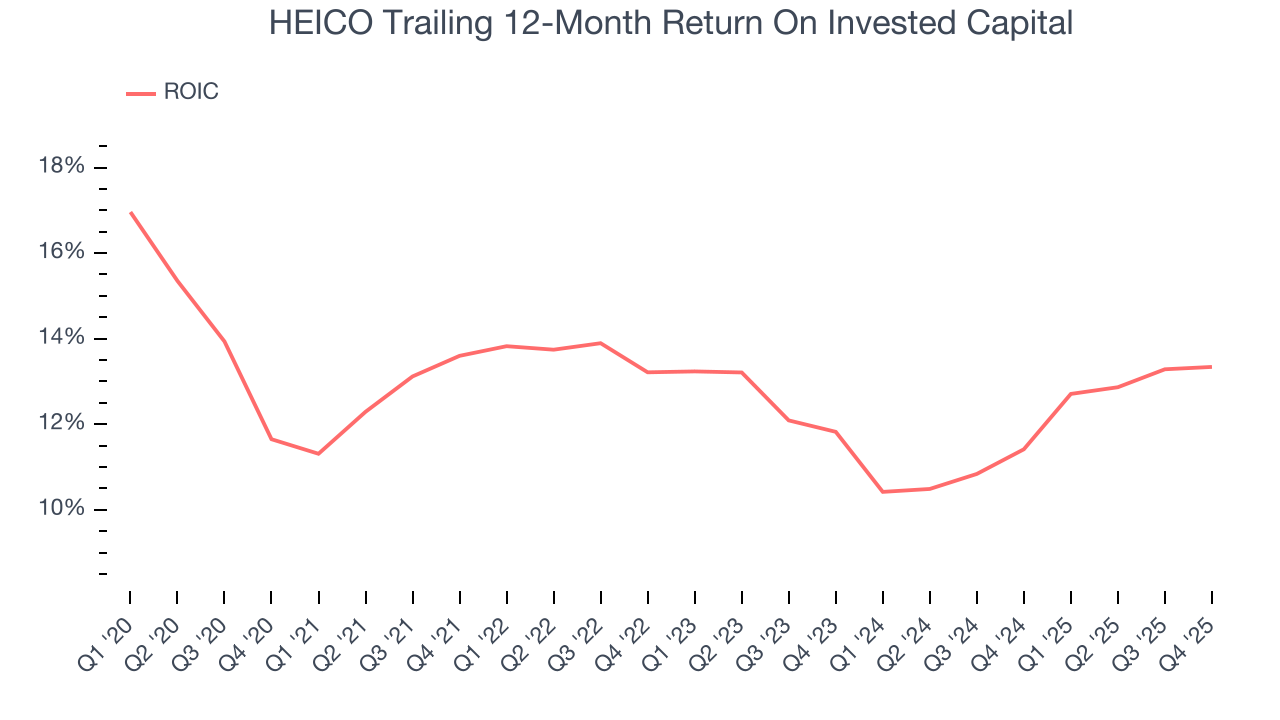
We like to invest in businesses with high returns, but the trend in a company’s ROIC is what often surprises the market and moves the stock price. Over the last few years, HEICO’s ROIC averaged 1 percentage point decreases each year. Only time will tell if its new bets can bear fruit and potentially reverse the trend.
10. Balance Sheet Assessment
HEICO reported $261 million of cash and $2.51 billion of debt on its balance sheet in the most recent quarter. As investors in high-quality companies, we primarily focus on two things: 1) that a company’s debt level isn’t too high and 2) that its interest payments are not excessively burdening the business.
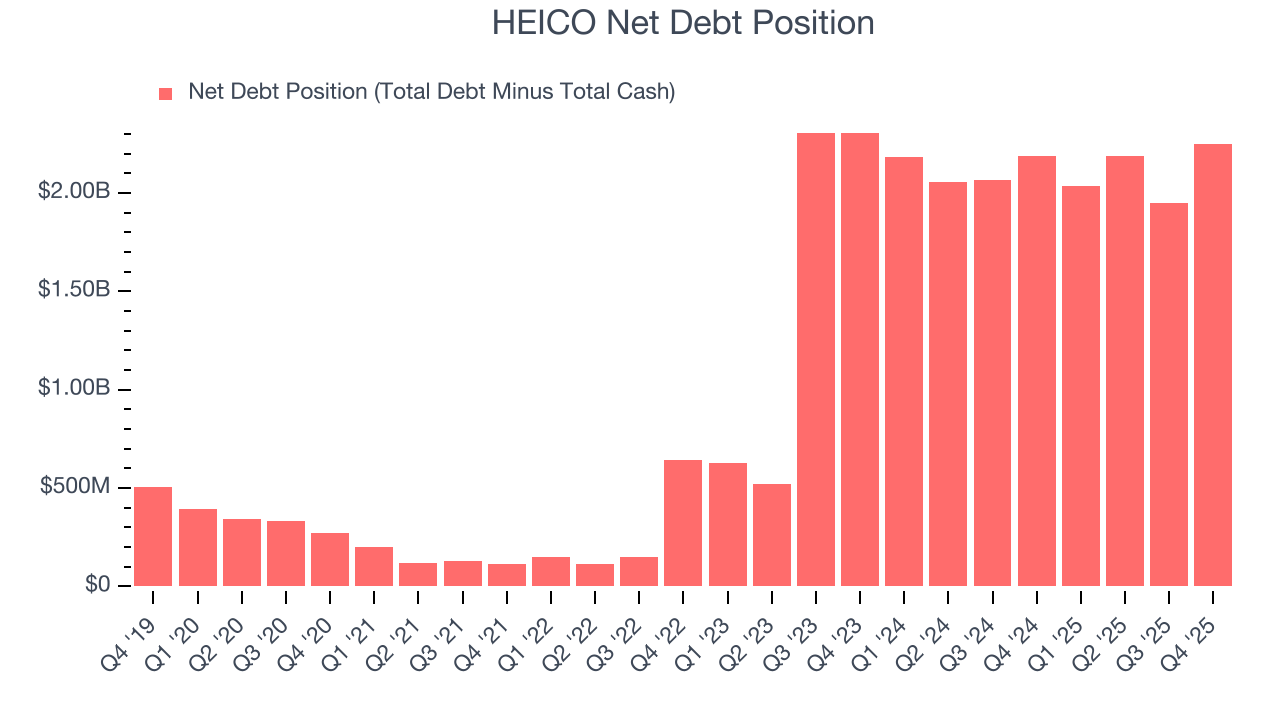
With $1.25 billion of EBITDA over the last 12 months, we view HEICO’s 1.8× net-debt-to-EBITDA ratio as safe. We also see its $67.93 million of annual interest expenses as appropriate. The company’s profits give it plenty of breathing room, allowing it to continue investing in growth initiatives.
11. Key Takeaways from HEICO’s Q4 Results
It was good to see HEICO narrowly top analysts’ revenue expectations this quarter. However, EPS missed if a favorable tax impact is included. Investors were likely hoping for more, and shares traded down 7.3% to $319.50 immediately after reporting.
12. Is Now The Time To Buy HEICO?
Updated: March 19, 2026 at 11:14 PM EDT
When considering an investment in HEICO, investors should account for its valuation and business qualities as well as what’s happened in the latest quarter.
There are multiple reasons why we think HEICO is an elite industrials company. First of all, the company’s revenue growth was exceptional over the last five years. On top of that, its powerful free cash flow generation enables it to stay ahead of the competition through consistent reinvestment of profits, and its impressive operating margins show it has a highly efficient business model.
HEICO’s P/E ratio based on the next 12 months is 49.7x. A lot of good news is certainly baked in given its premium multiple, but we’ll happily own what we believe is one of the best businesses in our coverage. It’s often wise to hold investments like this for at least three to five years, as the power of long-term compounding negates short-term price swings that can accompany high valuations.
Wall Street analysts have a consensus one-year price target of $371.50 on the company (compared to the current share price of $276.10).