
Huntington Ingalls (HII)
We wouldn’t recommend Huntington Ingalls. Its sales have underperformed and its low returns on capital show it has few growth opportunities.― StockStory Analyst Team
1. News


2. Summary
Why We Think Huntington Ingalls Will Underperform
Building Nimitz-class aircraft carriers used in active service, Huntington Ingalls (NYSE:HII) develops marine vessels and their mission systems and maintenance services.
- Falling earnings per share over the last five years has some investors worried as stock prices ultimately follow EPS over the long term
- Estimated sales growth of 3.4% for the next 12 months is soft and implies weaker demand
- Scale is a double-edged sword because it limits the company’s growth potential compared to its smaller competitors, as reflected in its below-average annual revenue increases of 4.4% for the last two years


Huntington Ingalls doesn’t check our boxes. We’re looking for better stocks elsewhere.
Why There Are Better Opportunities Than Huntington Ingalls


Huntington Ingalls’s stock price of $395.00 implies a valuation ratio of 23.5x forward P/E. This multiple is high given its weaker fundamentals.
It’s better to pay up for high-quality businesses with strong long-term earnings potential rather than to buy lower-quality companies with open questions and big downside risks.
3. Huntington Ingalls (HII) Research Report: Q4 CY2025 Update
Aerospace and defense company Huntington Ingalls (NYSE:HII) reported Q4 CY2025 results exceeding the market’s revenue expectations, with sales up 15.7% year on year to $3.48 billion. Its GAAP profit of $4.04 per share was 3.7% above analysts’ consensus estimates.
Huntington Ingalls (HII) Q4 CY2025 Highlights:
- Revenue: $3.48 billion vs analyst estimates of $3.08 billion (15.7% year-on-year growth, 12.7% beat)
- EPS (GAAP): $4.04 vs analyst estimates of $3.89 (3.7% beat)
- Operating Margin: 4.9%, up from 3.7% in the same quarter last year
- Free Cash Flow Margin: 14.8%, up from 9.2% in the same quarter last year
- Market Capitalization: $16.21 billion
Company Overview
Building Nimitz-class aircraft carriers used in active service, Huntington Ingalls (NYSE:HII) develops marine vessels and their mission systems and maintenance services.
Huntington Ingalls was established in 2011 as a spin-off from Northrop Grumman. Its roots trace back to the Newport News Shipbuilding and Dry Dock Company founded in 1886, which merged with Northrop Grumman in 2001. This historic shipyard has been a pivotal site for building U.S. Navy aircraft carriers and submarines, and Huntington Ingalls quickly cemented its reputation as a key military shipbuilder for the U.S. Navy and Coast Guard.
Today, Huntington Ingalls provides many maritime and defense solutions, ranging from the construction of nuclear-powered aircraft carriers and submarines to the provision of advanced defense and unmanned systems. Its core offerings include the design and construction of large-scale vessels for the U.S. Navy, such as amphibious assault ships. For instance, the LHAs (large deck amphibious assault ships) built at Huntington Ingalls are crucial for the U.S. Navy’s Expeditionary Strike Groups because they facilitate the rapid deployment and command of Marine units across naval and amphibious operations.
The company derives the majority of its revenue from contracts with the U.S. Government, specifically the Department of Defense (DoD), where it serves as a prime contractor, principal subcontractor, team member, or partner. The company's involvement in numerous high-priority U.S. defense programs provides a steady flow of governmental contracts.
Huntington Ingalls's fleet sustainment services also offer a significant revenue stream by providing extensive life-cycle support to its customers. These services encompass maintenance, modernization, and repair across all ship classes, which are crucial for extending the operational life and efficiency of naval fleets. They also cover the complex process of decommissioning ships and aircraft at the end of their service life.
4. Defense Contractors
Defense contractors typically require technical expertise and government clearance. Companies in this sector can also enjoy long-term contracts with government bodies, leading to more predictable revenues. Combined, these factors create high barriers to entry and can lead to limited competition. Lately, geopolitical tensions–whether it be Russia’s invasion of Ukraine or China’s aggression towards Taiwan–highlight the need for defense spending. On the other hand, demand for these products can ebb and flow with defense budgets and even who is president, as different administrations can have vastly different ideas of how to allocate federal funds.
Huntington Ingalls’ peers and competitors include Lockheed Martin (NYSE:LMT), Raytheon (NYSE:RTX), and General Dynamics (NYSE:GD)
5. Revenue Growth
A company’s long-term performance is an indicator of its overall quality. Even a bad business can shine for one or two quarters, but a top-tier one grows for years. Over the last five years, Huntington Ingalls grew its sales at a tepid 5.9% compounded annual growth rate. This was below our standard for the industrials sector and is a rough starting point for our analysis.
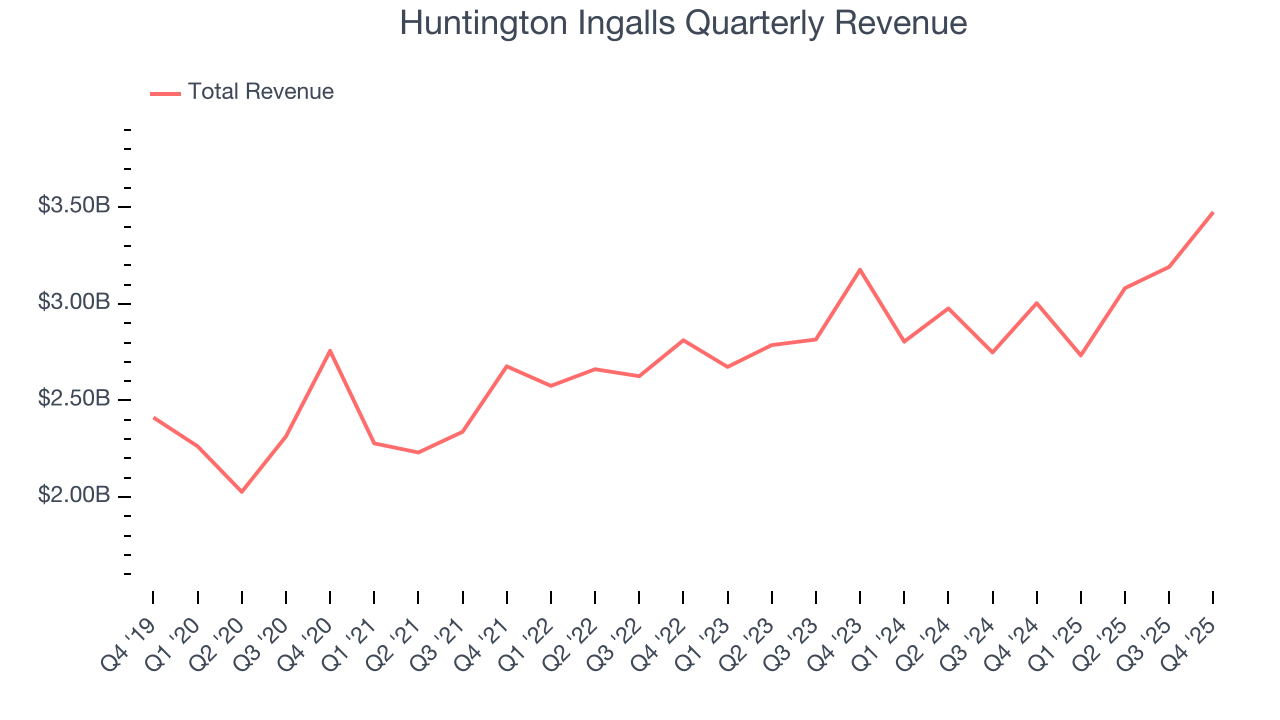
We at StockStory place the most emphasis on long-term growth, but within industrials, a half-decade historical view may miss cycles, industry trends, or a company capitalizing on catalysts such as a new contract win or a successful product line. Huntington Ingalls’s recent performance shows its demand has slowed as its annualized revenue growth of 4.4% over the last two years was below its five-year trend. 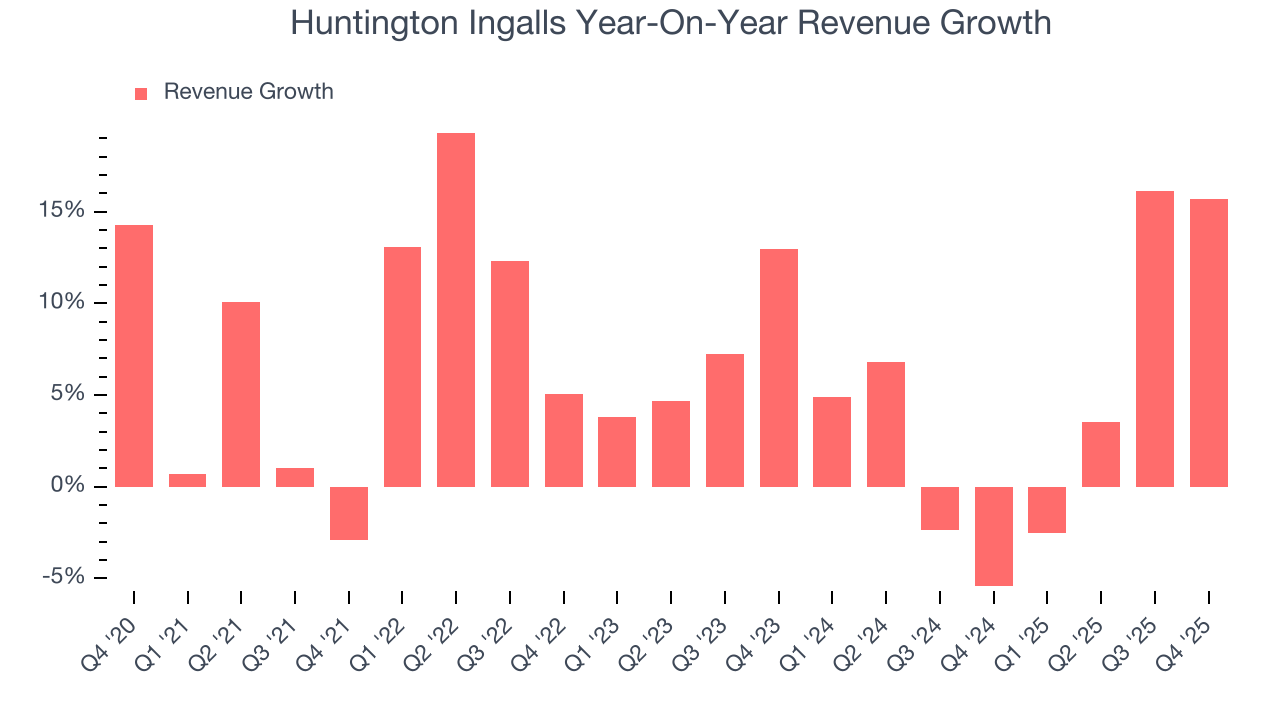
This quarter, Huntington Ingalls reported year-on-year revenue growth of 15.7%, and its $3.48 billion of revenue exceeded Wall Street’s estimates by 12.7%.
Looking ahead, sell-side analysts expect revenue to grow 1.9% over the next 12 months, a slight deceleration versus the last two years. This projection is underwhelming and indicates its products and services will see some demand headwinds.
6. Operating Margin
Huntington Ingalls’s operating margin might fluctuated slightly over the last 12 months but has generally stayed the same, averaging 5.5% over the last five years. This profitability was paltry for an industrials business and caused by its suboptimal cost structure.
Analyzing the trend in its profitability, Huntington Ingalls’s operating margin might fluctuated slightly but has generally stayed the same over the last five years. This raises questions about the company’s expense base because its revenue growth should have given it leverage on its fixed costs, resulting in better economies of scale and profitability.
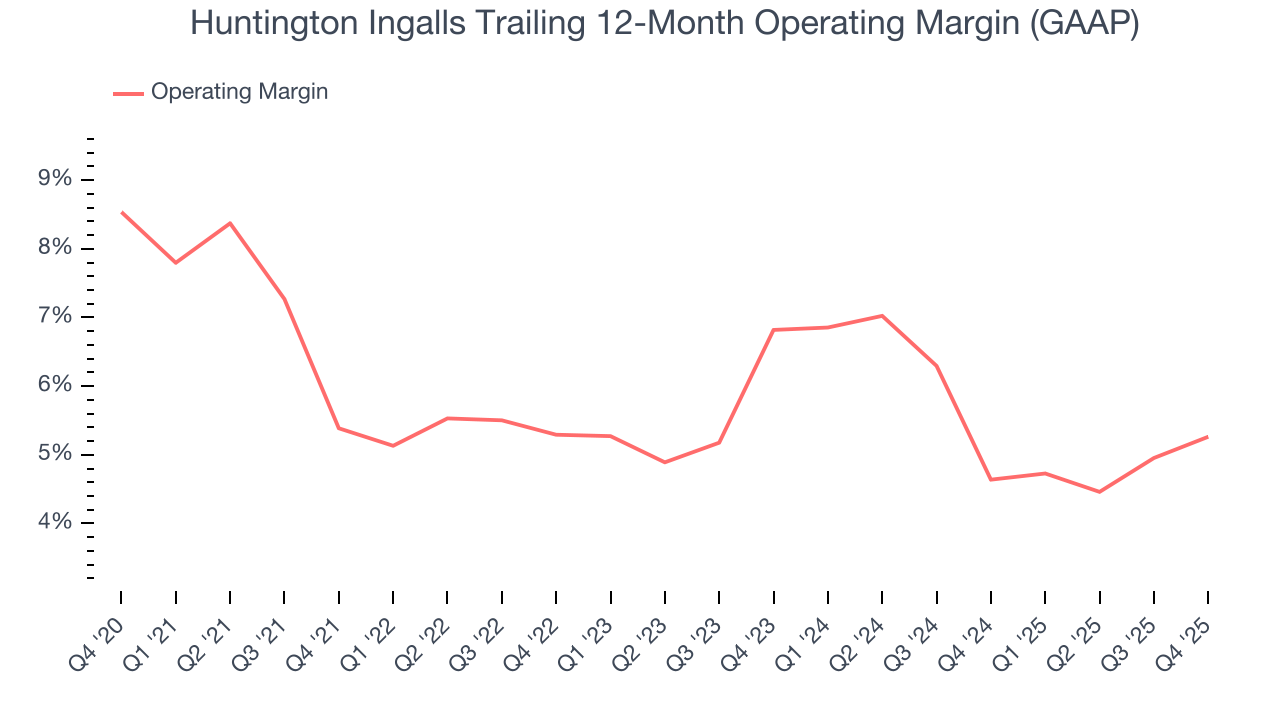
In Q4, Huntington Ingalls generated an operating margin profit margin of 4.9%, up 1.3 percentage points year on year. This increase was a welcome development and shows it was more efficient.
7. Earnings Per Share
Revenue trends explain a company’s historical growth, but the long-term change in earnings per share (EPS) points to the profitability of that growth – for example, a company could inflate its sales through excessive spending on advertising and promotions.
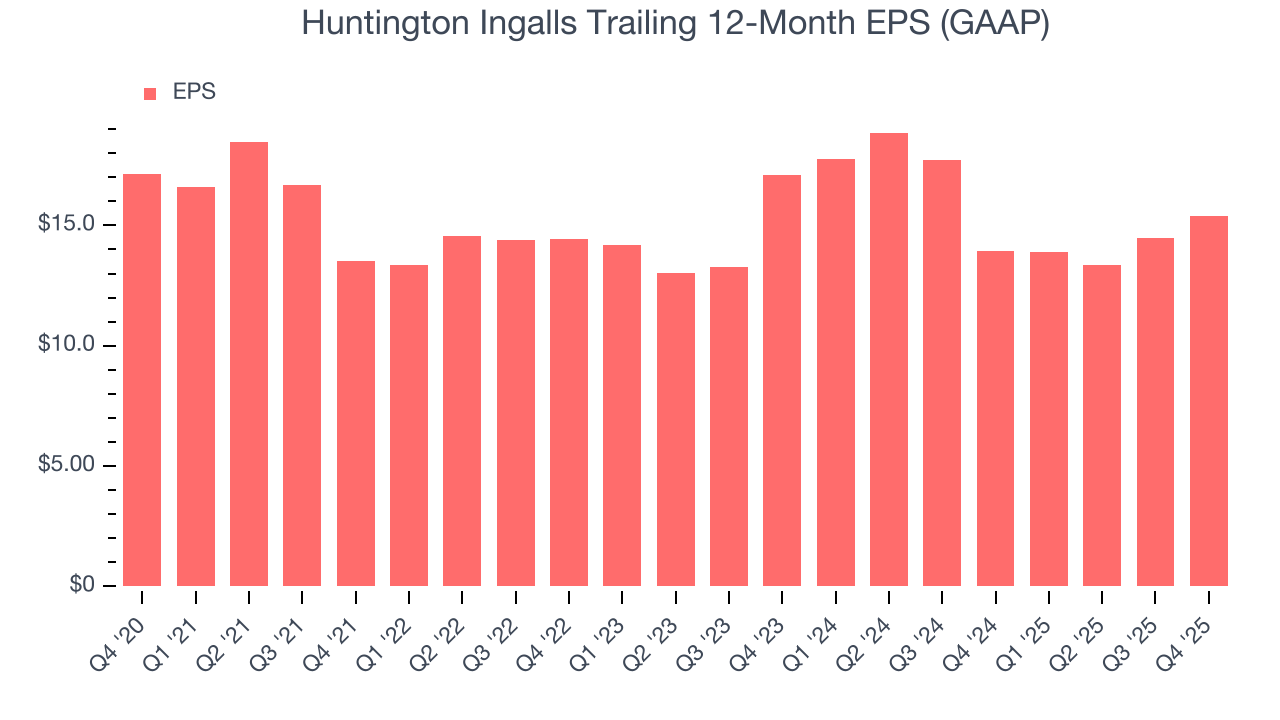
Sadly for Huntington Ingalls, its EPS declined by 2.1% annually over the last five years while its revenue grew by 5.9%. However, its operating margin didn’t change during this time, telling us that non-fundamental factors such as interest and taxes affected its ultimate earnings.
Like with revenue, we analyze EPS over a shorter period to see if we are missing a change in the business.
For Huntington Ingalls, its two-year annual EPS declines of 5.2% show it’s continued to underperform. These results were bad no matter how you slice the data.
In Q4, Huntington Ingalls reported EPS of $4.04, up from $3.15 in the same quarter last year. This print beat analysts’ estimates by 3.7%. Over the next 12 months, Wall Street expects Huntington Ingalls’s full-year EPS of $15.37 to grow 16%.
8. Cash Is King
Although earnings are undoubtedly valuable for assessing company performance, we believe cash is king because you can’t use accounting profits to pay the bills.
Huntington Ingalls has shown weak cash profitability over the last five years, giving the company limited opportunities to return capital to shareholders. Its free cash flow margin averaged 4.4%, subpar for an industrials business.
Taking a step back, an encouraging sign is that Huntington Ingalls’s margin expanded by 1.7 percentage points during that time. The company’s improvement shows it’s heading in the right direction, and we can see it became a less capital-intensive business because its free cash flow profitability rose while its operating profitability was flat.
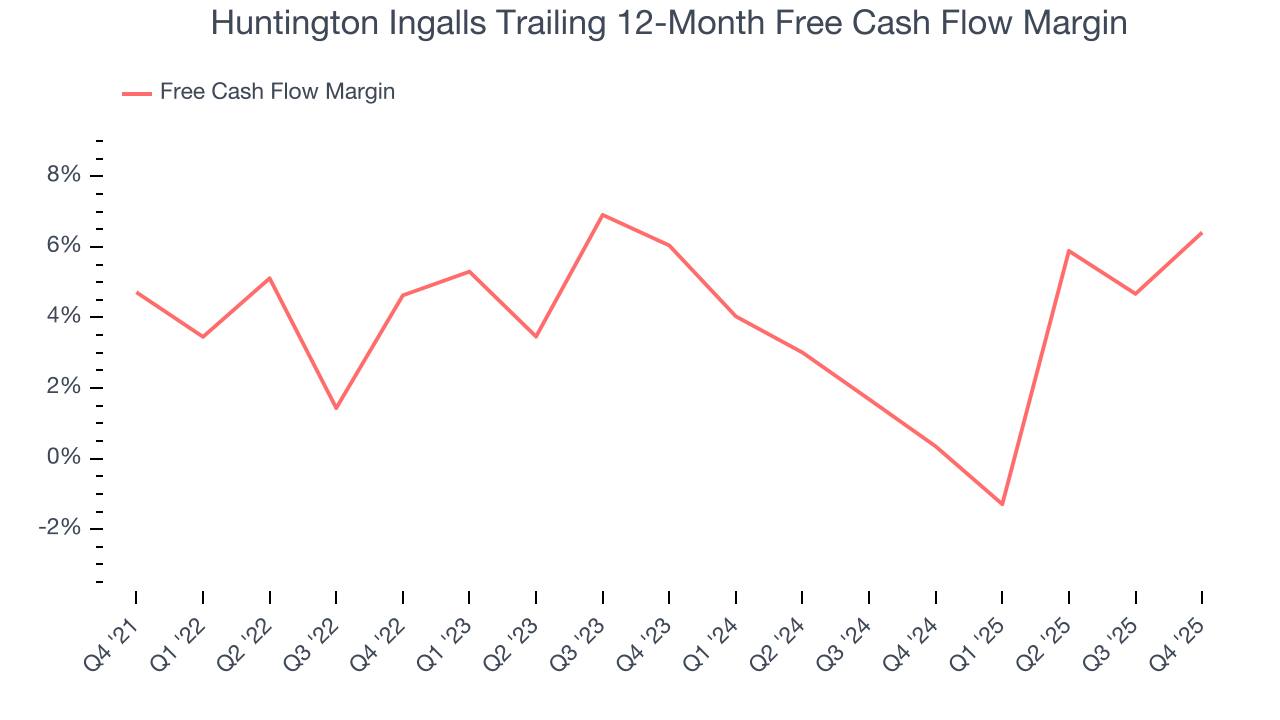
Huntington Ingalls’s free cash flow clocked in at $516 million in Q4, equivalent to a 14.8% margin. This result was good as its margin was 5.6 percentage points higher than in the same quarter last year, building on its favorable historical trend.
9. Return on Invested Capital (ROIC)
EPS and free cash flow tell us whether a company was profitable while growing its revenue. But was it capital-efficient? A company’s ROIC explains this by showing how much operating profit it makes compared to the money it has raised (debt and equity).
Huntington Ingalls historically did a mediocre job investing in profitable growth initiatives. Its five-year average ROIC was 8.1%, somewhat low compared to the best industrials companies that consistently pump out 20%+.
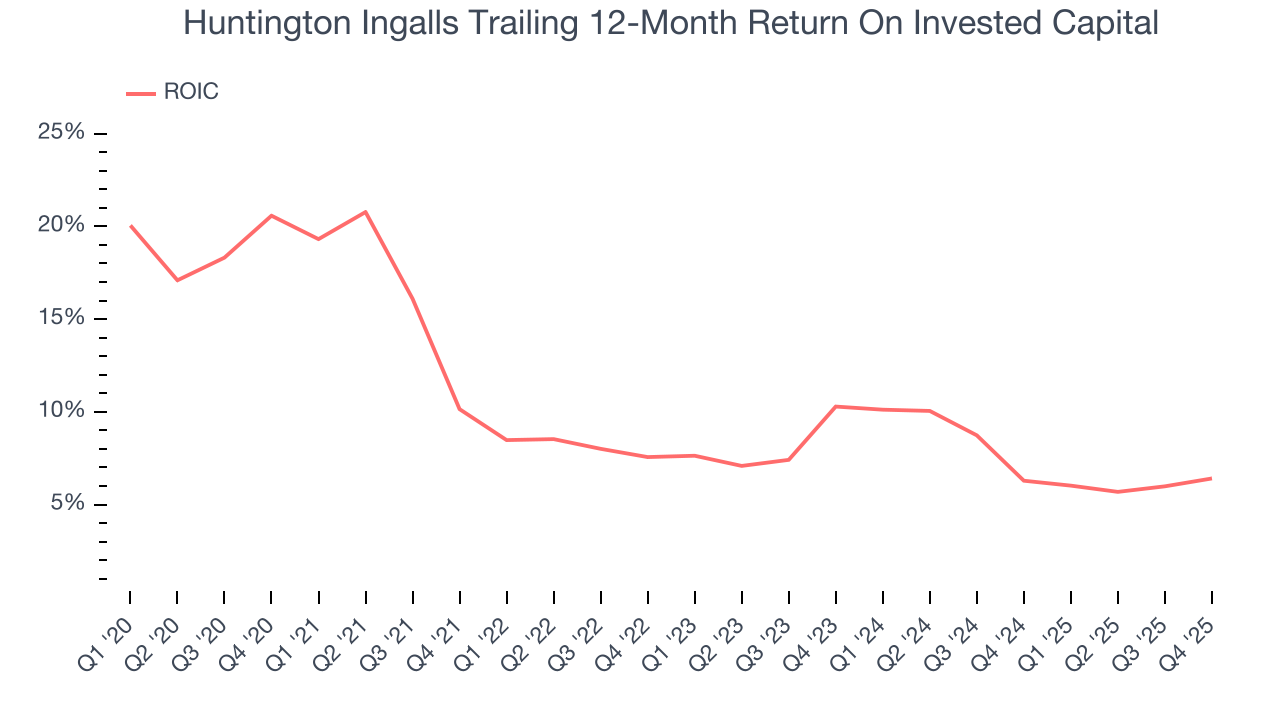
We like to invest in businesses with high returns, but the trend in a company’s ROIC is what often surprises the market and moves the stock price. Unfortunately, Huntington Ingalls’s ROIC averaged 2.5 percentage point decreases each year over the last few years. Paired with its already low returns, these declines suggest its profitable growth opportunities are few and far between.
10. Balance Sheet Assessment
Huntington Ingalls reported $774 million of cash and $2.92 billion of debt on its balance sheet in the most recent quarter. As investors in high-quality companies, we primarily focus on two things: 1) that a company’s debt level isn’t too high and 2) that its interest payments are not excessively burdening the business.
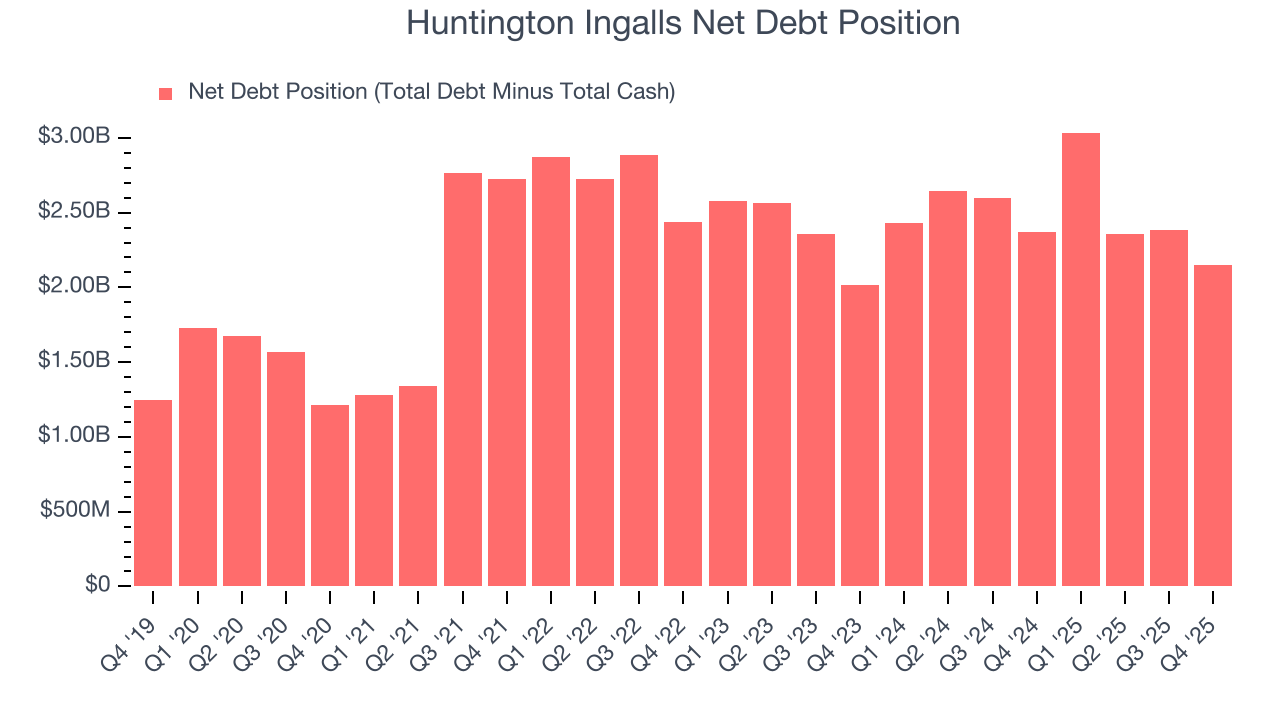
With $986 million of EBITDA over the last 12 months, we view Huntington Ingalls’s 2.2× net-debt-to-EBITDA ratio as safe. We also see its $20 million of annual interest expenses as appropriate. The company’s profits give it plenty of breathing room, allowing it to continue investing in growth initiatives.
11. Key Takeaways from Huntington Ingalls’s Q4 Results
We were impressed by how significantly Huntington Ingalls blew past analysts’ revenue expectations this quarter. We were also glad its EPS outperformed Wall Street’s estimates. Zooming out, we think this was a solid print. The market seemed to be hoping for more, and the stock traded down 10.7% to $368.93 immediately following the results.
12. Is Now The Time To Buy Huntington Ingalls?
Updated: March 23, 2026 at 11:32 PM EDT
Before deciding whether to buy Huntington Ingalls or pass, we urge investors to consider business quality, valuation, and the latest quarterly results.
We cheer for all companies making their customers lives easier, but in the case of Huntington Ingalls, we’ll be cheering from the sidelines. For starters, its revenue growth was uninspiring over the last five years, and analysts expect its demand to deteriorate over the next 12 months. While its projected EPS for the next year implies the company’s fundamentals will improve, the downside is its declining EPS over the last five years makes it a less attractive asset to the public markets. On top of that, its diminishing returns show management's prior bets haven't worked out.
Huntington Ingalls’s P/E ratio based on the next 12 months is 23.5x. This valuation tells us a lot of optimism is priced in - we think there are better opportunities elsewhere.
Wall Street analysts have a consensus one-year price target of $403 on the company (compared to the current share price of $395.00).