
MarineMax (HZO)
MarineMax is up against the odds. Its low returns on capital and plummeting sales suggest it struggles to generate demand and profits, a red flag.― StockStory Analyst Team
1. News


2. Summary
Why We Think MarineMax Will Underperform
Appropriately headquartered in Clearwater, Florida, MarineMax (NYSE:HZO) sells boats, yachts, and other marine products.
- Recent store closures and weak same-store sales point to soft demand and an operational restructuring
- Smaller revenue base of $2.31 billion means it hasn’t achieved the economies of scale that some industry juggernauts enjoy
- High net-debt-to-EBITDA ratio of 10× could force the company to raise capital at unfavorable terms if market conditions deteriorate


MarineMax doesn’t meet our quality standards. There are more promising alternatives.
Why There Are Better Opportunities Than MarineMax


MarineMax’s stock price of $28.17 implies a valuation ratio of 40.2x forward P/E. The current multiple is quite expensive, especially for the tepid revenue growth.
We prefer to invest in similarly-priced but higher-quality companies with superior earnings growth.
3. MarineMax (HZO) Research Report: Q3 CY2025 Update
Boat and marine products retailer MarineMax (NYSE:HZO) reported Q3 CY2025 results topping the market’s revenue expectations, but sales fell by 1.9% year on year to $552.2 million. Its non-GAAP loss of $0.04 per share was 65.5% above analysts’ consensus estimates.
MarineMax (HZO) Q3 CY2025 Highlights:
- Revenue: $552.2 million vs analyst estimates of $543.8 million (1.9% year-on-year decline, 1.5% beat)
- Adjusted EPS: -$0.04 vs analyst estimates of -$0.12 (65.5% beat)
- Adjusted EBITDA: $17.28 million vs analyst estimates of $19.66 million (3.1% margin, 12.1% miss)
- Adjusted EPS guidance for the upcoming financial year 2026 is $0.68 at the midpoint, missing analyst estimates by 64.4%
- EBITDA guidance for the upcoming financial year 2026 is $117.5 million at the midpoint, below analyst estimates of $154 million
- Operating Margin: 2.5%, down from 4.8% in the same quarter last year
- Locations: 70 at quarter end, down from 75 in the same quarter last year
- Same-Store Sales rose 2.3% year on year (-3.3% in the same quarter last year)
- Market Capitalization: $504 million
Company Overview
Appropriately headquartered in Clearwater, Florida, MarineMax (NYSE:HZO) sells boats, yachts, and other marine products.
The company’s product offering includes boats from many prestigious manufacturers such as Sea Ray, Boston Whaler, Azimut, and Galeon. In addition, MarineMax provides services such as financing, insurance, maintenance, and repair to make it a one-stop shop for recreational boating.
The core customer is an affluent individual or family who's interested in marine activities and has the proximity or access to water to use the company’s products. These customers are looking for high-quality products that offer some combination of luxury and performance. They also often demand personalized support and assistance through the life of their boats or yachts.
The average MarineMax store is around 30,000 square feet and typically located in prime waterfront locations such as marinas and harbors. The layout of stores is open and spacious, with ample room for display. MarineMax launched its e-commerce platform in 2018, and the platform allows customers to browse–including virtual tours and video consultations–and purchase products online. Customers can also access financing and insurance services through the website.
4. Boat & Marine Retailer
Retailers that sell boats and marine products sell products, sure, but they also sell an image and lifestyle to an often wealthier customer. Unlike a car–which many use daily to get to/from work and to run personal and family errands–a boat or yacht is certainly a discretionary, luxury, nice-to-have purchase. While there is online competition, especially for research and discovery, the boat and yacht market is still very brick-and-mortar based given the magnitude of the purchase and the logistical costs associated with moving these products over long distances.
Competitors offering recreational marine products include OneWater Marine (NASDAQ:ONEW), Yamaha Motor Co. (TSE:7272), and Brunswick Corp (NYSE:BC).
5. Revenue Growth
A company’s long-term sales performance can indicate its overall quality. Any business can put up a good quarter or two, but many enduring ones grow for years.
With $2.31 billion in revenue over the past 12 months, MarineMax is a small retailer, which sometimes brings disadvantages compared to larger competitors benefiting from economies of scale and negotiating leverage with suppliers. On the bright side, it can grow faster because it has more white space to build new stores.
As you can see below, MarineMax’s 11% annualized revenue growth over the last six years (we compare to 2019 to normalize for COVID-19 impacts) was decent despite closing stores.
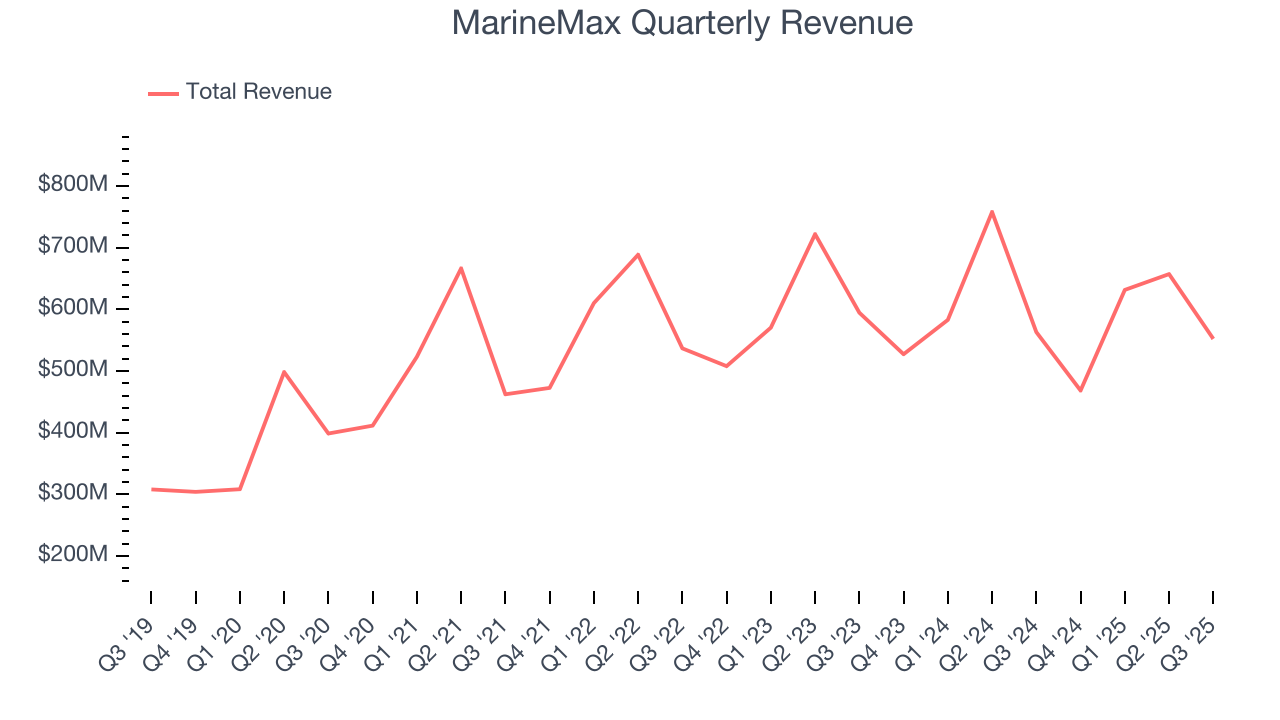
This quarter, MarineMax’s revenue fell by 1.9% year on year to $552.2 million but beat Wall Street’s estimates by 1.5%.
Looking ahead, sell-side analysts expect revenue to grow 5.4% over the next 12 months, a deceleration versus the last six years. Still, this projection is commendable and implies the market is forecasting success for its products.
6. Store Performance
Number of Stores
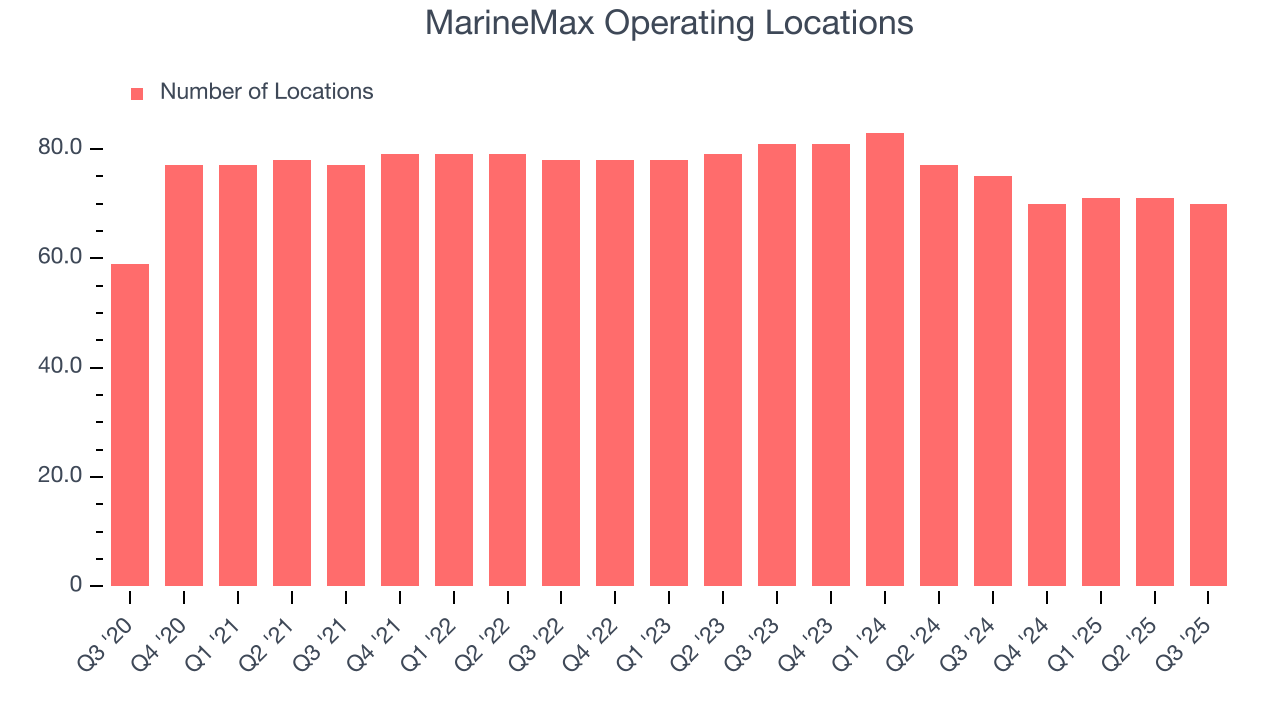
A retailer’s store count often determines how much revenue it can generate.
MarineMax operated 70 locations in the latest quarter. Over the last two years, the company has generally closed its stores, averaging 5.3% annual declines.
When a retailer shutters stores, it usually means that brick-and-mortar demand is less than supply, and it is responding by closing underperforming locations to improve profitability.
Same-Store Sales
A company's store base only paints one part of the picture. When demand is high, it makes sense to open more. But when demand is low, it’s prudent to close some locations and use the money in other ways. Same-store sales gives us insight into this topic because it measures organic growth for a retailer's e-commerce platform and brick-and-mortar shops that have existed for at least a year.
MarineMax’s demand within its existing locations has barely increased over the last two years as its same-store sales were flat. This performance isn’t ideal, and MarineMax is attempting to boost same-store sales by closing stores (fewer locations sometimes lead to higher same-store sales).

In the latest quarter, MarineMax’s same-store sales rose 2.3% year on year. This growth was a well-appreciated turnaround from its historical levels, showing the business is regaining momentum.
7. Gross Margin & Pricing Power
Gross profit margins are an important measure of a retailer’s pricing power, product differentiation, and negotiating leverage.
MarineMax has bad unit economics for a retailer, giving it less room to reinvest and grow its presence. As you can see below, it averaged a 32.7% gross margin over the last two years. Said differently, MarineMax had to pay a chunky $67.27 to its suppliers for every $100 in revenue. 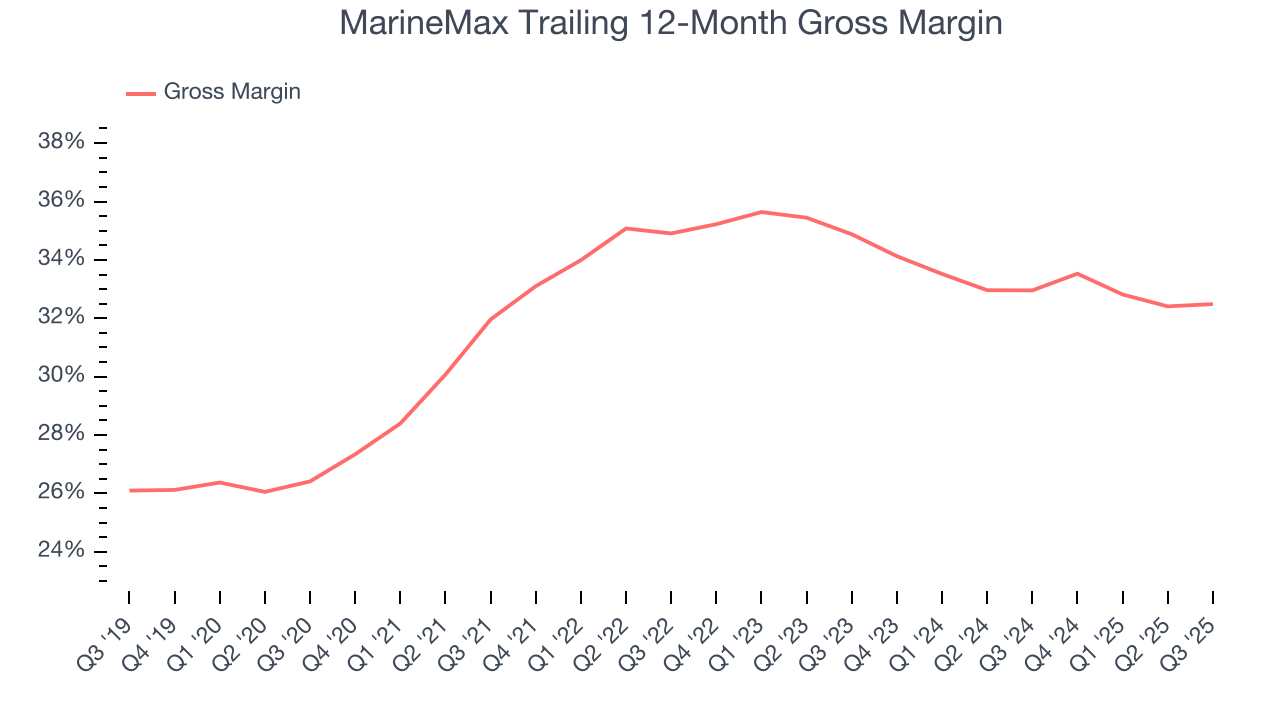
This quarter, MarineMax’s gross profit margin was 34.7%, in line with the same quarter last year. Zooming out, the company’s full-year margin has remained steady over the past 12 months, suggesting it strives to keep prices low for customers and has stable input costs (such as labor and freight expenses to transport goods).
8. Operating Margin
MarineMax was profitable over the last two years but held back by its large cost base. Its average operating margin of 3.4% was weak for a consumer retail business. This result isn’t too surprising given its low gross margin as a starting point.
Analyzing the trend in its profitability, MarineMax’s operating margin decreased by 3.8 percentage points over the last year. This raises questions about the company’s expense base because its revenue growth should have given it leverage on its fixed costs, resulting in better economies of scale and profitability. MarineMax’s performance was poor no matter how you look at it - it shows that costs were rising and it couldn’t pass them onto its customers.
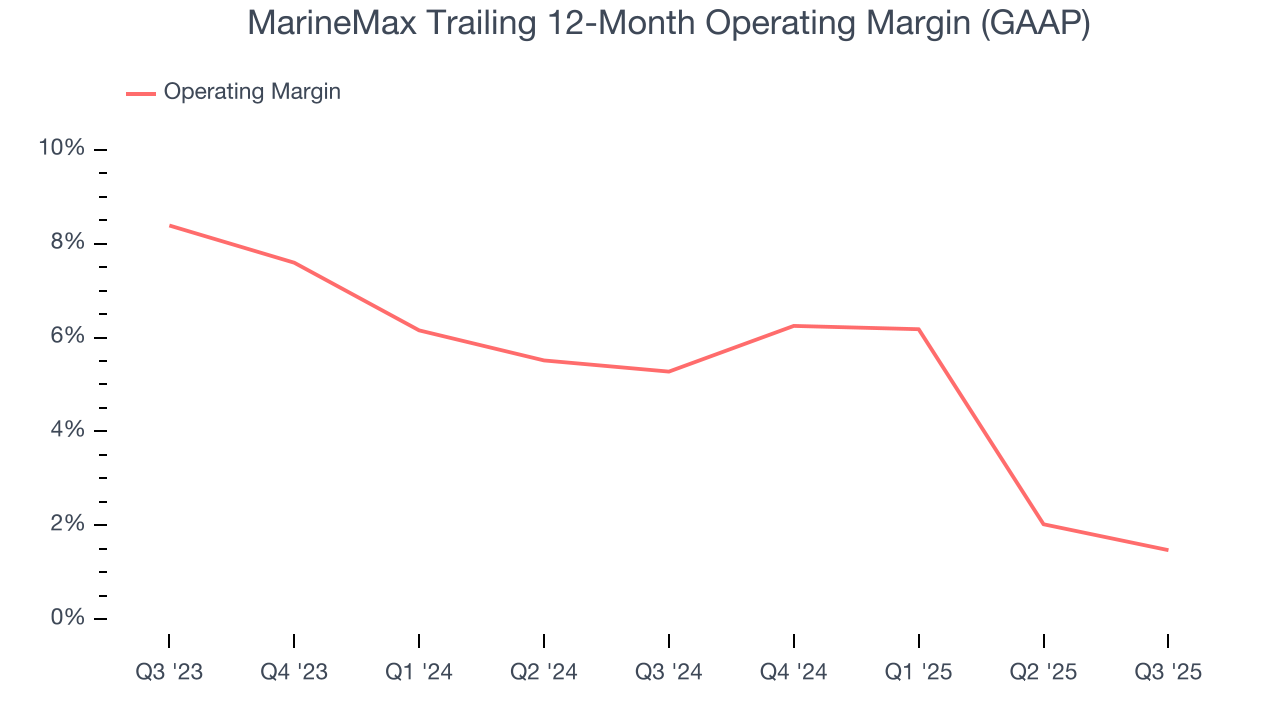
This quarter, MarineMax generated an operating margin profit margin of 2.5%, down 2.3 percentage points year on year. Since MarineMax’s operating margin decreased more than its gross margin, we can assume it was less efficient because expenses such as marketing, and administrative overhead increased.
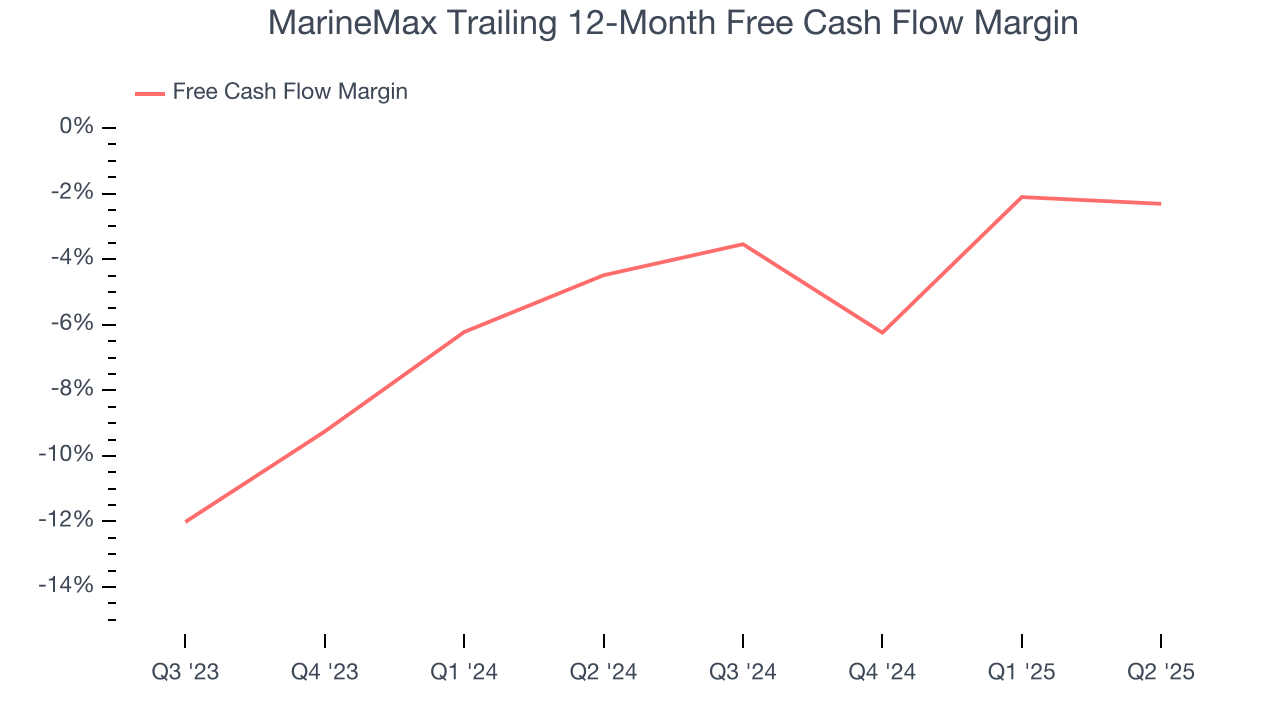
9. Cash Is King
Although earnings are undoubtedly valuable for assessing company performance, we believe cash is king because you can’t use accounting profits to pay the bills.
MarineMax’s demanding reinvestments have consumed many resources over the last two years, contributing to an average free cash flow margin of negative 2.9%. This means it lit $2.92 of cash on fire for every $100 in revenue.
10. Return on Invested Capital (ROIC)
EPS and free cash flow tell us whether a company was profitable while growing its revenue. But was it capital-efficient? Enter ROIC, a metric showing how much operating profit a company generates relative to the money it has raised (debt and equity).
MarineMax historically did a mediocre job investing in profitable growth initiatives. Its five-year average ROIC was 14.2%, somewhat low compared to the best consumer retail companies that consistently pump out 25%+.
11. Balance Sheet Risk
As long-term investors, the risk we care about most is the permanent loss of capital, which can happen when a company goes bankrupt or raises money from a disadvantaged position. This is separate from short-term stock price volatility, something we are much less bothered by.
MarineMax’s $1.25 billion of debt exceeds the $170.4 million of cash on its balance sheet. Furthermore, its 10× net-debt-to-EBITDA ratio (based on its EBITDA of $109.8 million over the last 12 months) shows the company is overleveraged.
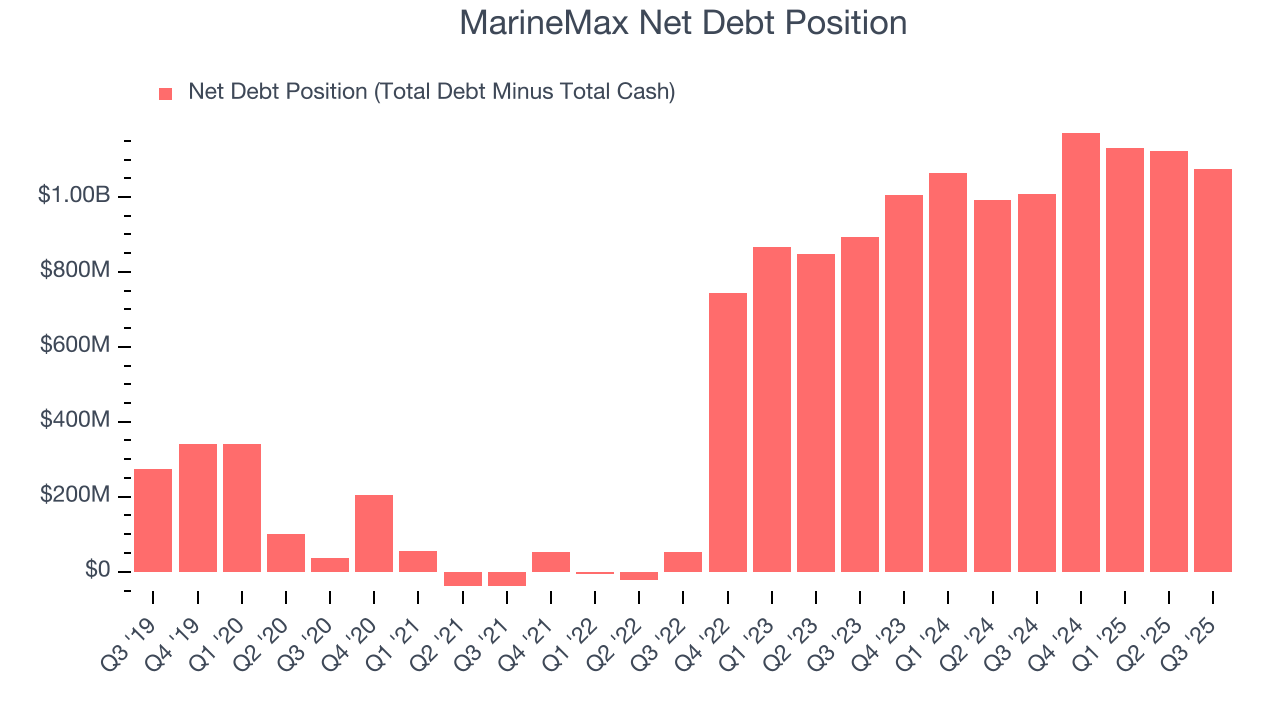
At this level of debt, incremental borrowing becomes increasingly expensive and credit agencies could downgrade the company’s rating if profitability falls. MarineMax could also be backed into a corner if the market turns unexpectedly – a situation we seek to avoid as investors in high-quality companies.
We hope MarineMax can improve its balance sheet and remain cautious until it increases its profitability or pays down its debt.
12. Key Takeaways from MarineMax’s Q3 Results
It was good to see MarineMax beat analysts’ EPS expectations this quarter. We were also excited its gross margin outperformed Wall Street’s estimates by a wide margin. On the other hand, its full-year EBITDA guidance missed and its EBITDA fell short of Wall Street’s estimates. Overall, this was a softer quarter. The stock traded down 8.8% to $21.44 immediately following the results.
13. Is Now The Time To Buy MarineMax?
Updated: January 24, 2026 at 9:35 PM EST
Before deciding whether to buy MarineMax or pass, we urge investors to consider business quality, valuation, and the latest quarterly results.
We see the value of companies helping consumers, but in the case of MarineMax, we’re out. To begin with, its revenue growth was weak over the last three years. On top of that, MarineMax’s declining EPS over the last three years makes it a less attractive asset to the public markets, and its declining physical locations suggests its demand is falling.
MarineMax’s P/E ratio based on the next 12 months is 40.2x. This multiple tells us a lot of good news is priced in - we think there are better opportunities elsewhere.
Wall Street analysts have a consensus one-year price target of $30.71 on the company (compared to the current share price of $28.17).