Intercontinental Exchange (ICE)
Intercontinental Exchange has some merits, but it’s largely unimpressive. We believe there are better opportunities in the market.― StockStory Analyst Team
1. News


2. Summary
Why Intercontinental Exchange Is Not Exciting
Starting as an energy trading platform in 2000 before acquiring the iconic New York Stock Exchange in 2013, Intercontinental Exchange (NYSE:ICE) operates global financial exchanges, clearing houses, and provides data services and mortgage technology solutions to financial institutions and corporations.
- Performance over the past five years shows its incremental sales were less profitable, as its 9.3% annual earnings per share growth trailed its revenue gains
- The good news is that its solid 11.5% annual revenue growth over the last five years indicates its offering’s solve complex business issues


Intercontinental Exchange’s quality is not up to our standards. We’d rather invest in businesses with stronger moats.
Why There Are Better Opportunities Than Intercontinental Exchange


Intercontinental Exchange’s stock price of $158.99 implies a valuation ratio of 21.6x forward P/E. Not only does Intercontinental Exchange trade at a premium to companies in the financials space, but this multiple is also high for its fundamentals.
We prefer to invest in similarly-priced but higher-quality companies with superior earnings growth.
3. Intercontinental Exchange (ICE) Research Report: Q3 CY2025 Update
Global market infrastructure company Intercontinental Exchange (NYSE:ICE) beat Wall Street’s revenue expectations in Q3 CY2025, with sales up 28% year on year to $3.01 billion. Its non-GAAP profit of $1.71 per share was 6.4% above analysts’ consensus estimates.
Intercontinental Exchange (ICE) Q3 CY2025 Highlights:
- Revenue: $3.01 billion vs analyst estimates of $2.41 billion (28% year-on-year growth, 24.7% beat)
- Pre-tax Profit: $1.08 billion (35.9% margin, 20.4% year-on-year growth)
- Adjusted EPS: $1.71 vs analyst estimates of $1.61 (6.4% beat)
- Market Capitalization: $86.22 billion
Company Overview
Starting as an energy trading platform in 2000 before acquiring the iconic New York Stock Exchange in 2013, Intercontinental Exchange (NYSE:ICE) operates global financial exchanges, clearing houses, and provides data services and mortgage technology solutions to financial institutions and corporations.
ICE's business is organized into three main segments. The Exchanges segment operates 13 regulated marketplaces and 6 clearing houses globally, where traders can buy and sell everything from energy futures and agricultural commodities to financial derivatives and equities. For example, a commercial airline might use ICE's markets to hedge against rising fuel costs by purchasing oil futures contracts. The company's flagship Brent crude oil contract serves as a global benchmark for oil pricing.
The Fixed Income and Data Services segment provides pricing information, reference data, and analytics on nearly three million fixed income securities. This segment also includes ICE Bonds, which offers electronic trading platforms for fixed income markets, and ICE Clear Credit, which clears credit default swaps. A portfolio manager might use ICE's fixed income data to accurately price bonds in their portfolio or execute trades through ICE's electronic platforms.
The Mortgage Technology segment offers digital solutions that connect various participants in the U.S. residential mortgage market. Its platform serves as a system of record for mortgage transactions, automating workflows from application through closing and servicing. A mortgage lender might use ICE's technology to process loan applications, verify borrower information, and electronically close loans, reducing paperwork and processing time.
ICE generates revenue through transaction fees, clearing fees, listing fees, subscription-based data services, and software licenses. The company has built its business through both organic growth and strategic acquisitions, including the New York Stock Exchange in 2013, which significantly expanded its equities business.
4. Financial Exchanges & Data
Financial exchanges and data providers operate trading platforms and sell market information. They enjoy relatively stable revenue from trading fees and subscriptions, increasing demand for data analytics, and expansion opportunities in emerging markets. Challenges include regulatory oversight of market structure, competition from alternative trading venues, and substantial technology investments needed to maintain low-latency trading infrastructure and data security.
Intercontinental Exchange competes with other global exchange operators including CME Group (NASDAQ:CME), Nasdaq (NASDAQ:NDAQ), London Stock Exchange Group (LON:LSEG), and Deutsche Börse (ETR:DB1). In mortgage technology, competitors include Black Knight (acquired by ICE in 2023), Ellie Mae (acquired by ICE in 2020), and Blend Labs (NYSE:BLND).
5. Revenue Growth
A company’s long-term performance is an indicator of its overall quality. Any business can put up a good quarter or two, but many enduring ones grow for years. Luckily, Intercontinental Exchange’s revenue grew at a solid 12.8% compounded annual growth rate over the last five years. Its growth beat the average financials company and shows its offerings resonate with customers.
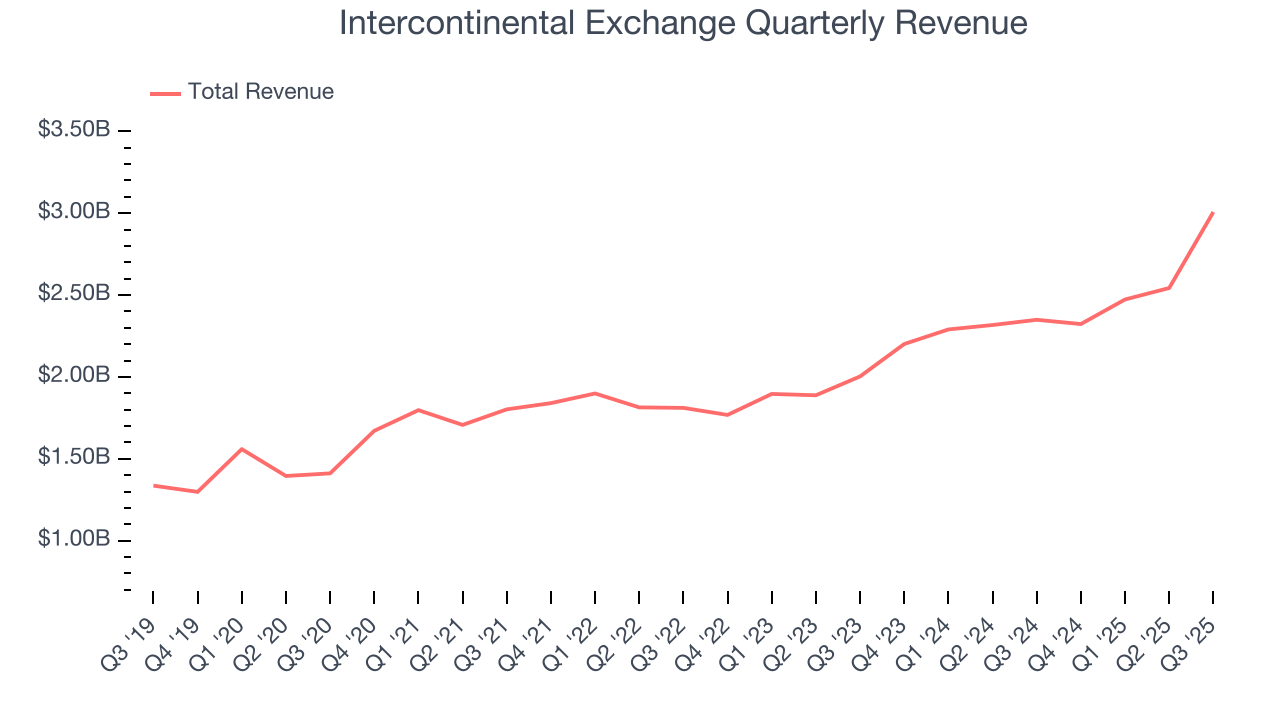
We at StockStory place the most emphasis on long-term growth, but within financials, a half-decade historical view may miss recent interest rate changes, market returns, and industry trends. Intercontinental Exchange’s annualized revenue growth of 17% over the last two years is above its five-year trend, suggesting its demand was strong and recently accelerated. 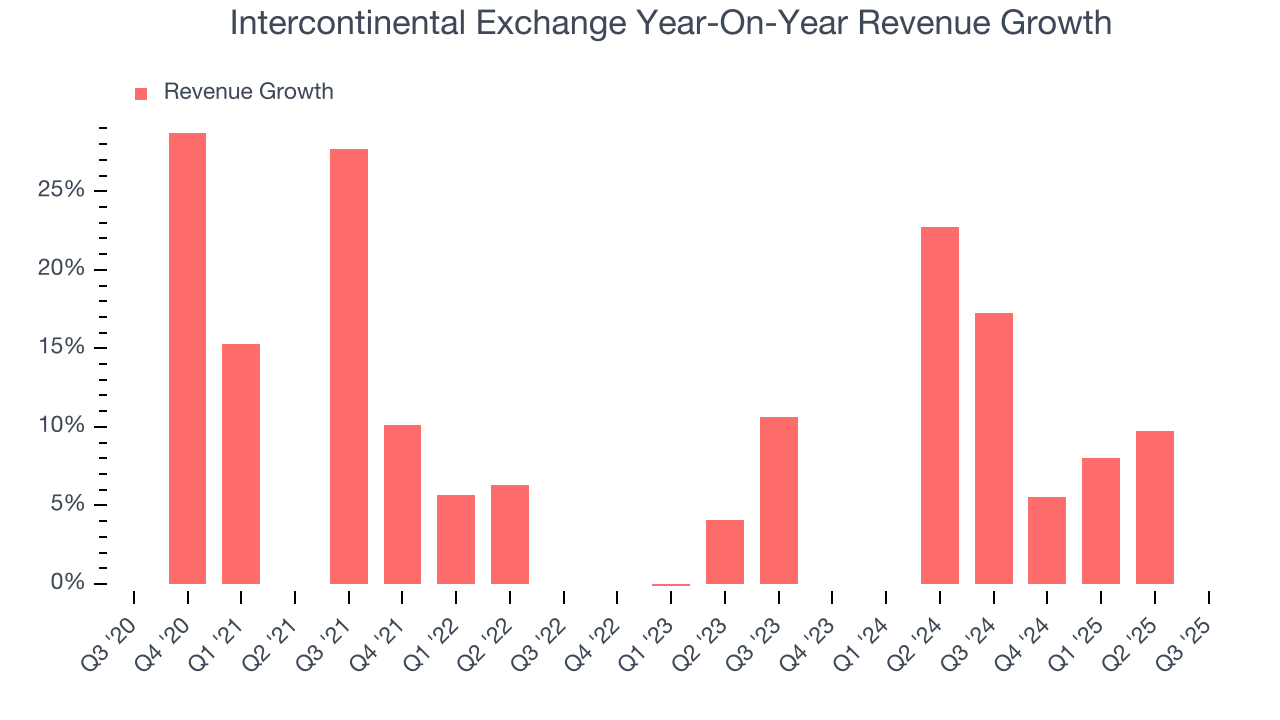 Note: Quarters not shown were determined to be outliers, impacted by outsized investment gains/losses that are not indicative of the recurring fundamentals of the business.
This quarter, Intercontinental Exchange reported robust year-on-year revenue growth of 28%, and its $3.01 billion of revenue topped Wall Street estimates by 24.7%.
6. Pre-Tax Profit Margin
Revenue growth is one major determinant of business quality, and the efficiency of operations is another. For Financial Exchanges & Data companies, we look at pre-tax profit rather than the operating margin that defines sectors such as consumer, tech, and industrials.
The pre-tax profit margin includes interest because it's central to how financial institutions generate revenue and manage costs. Tax considerations are excluded since they represent government policy rather than operational performance, giving investors a clearer view of business fundamentals.
Over the last four years, Intercontinental Exchange’s pre-tax profit margin has risen by 20.7 percentage points, going from 61.1% to 40.5%. Luckily, it seems the company has recently taken steps to address its expense base as its pre-tax profit margin expanded by 1.5 percentage points on a two-year basis.
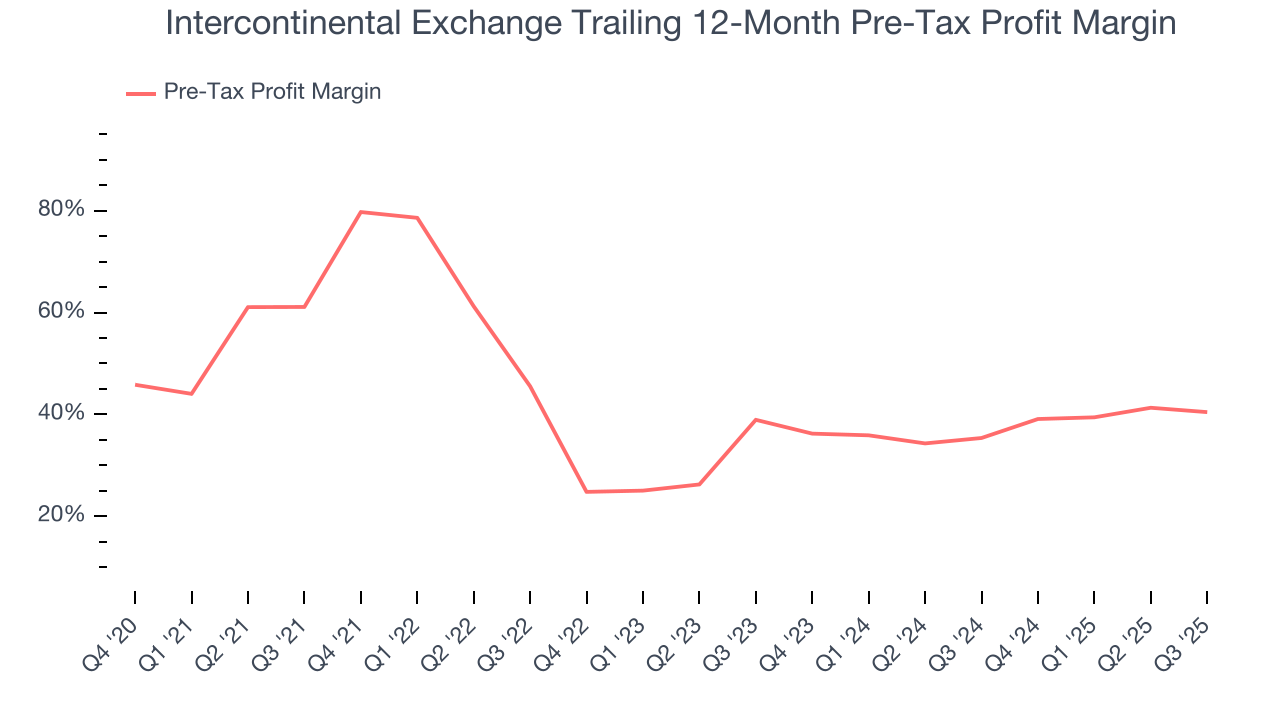
Intercontinental Exchange’s pre-tax profit margin came in at 35.9% this quarter. This result was 2.3 percentage points worse than the same quarter last year.
7. Earnings Per Share
We track the long-term change in earnings per share (EPS) for the same reason as long-term revenue growth. Compared to revenue, however, EPS highlights whether a company’s growth is profitable.
Intercontinental Exchange’s EPS grew at an unimpressive 9.3% compounded annual growth rate over the last five years, lower than its 12.8% annualized revenue growth. This tells us the company became less profitable on a per-share basis as it expanded.
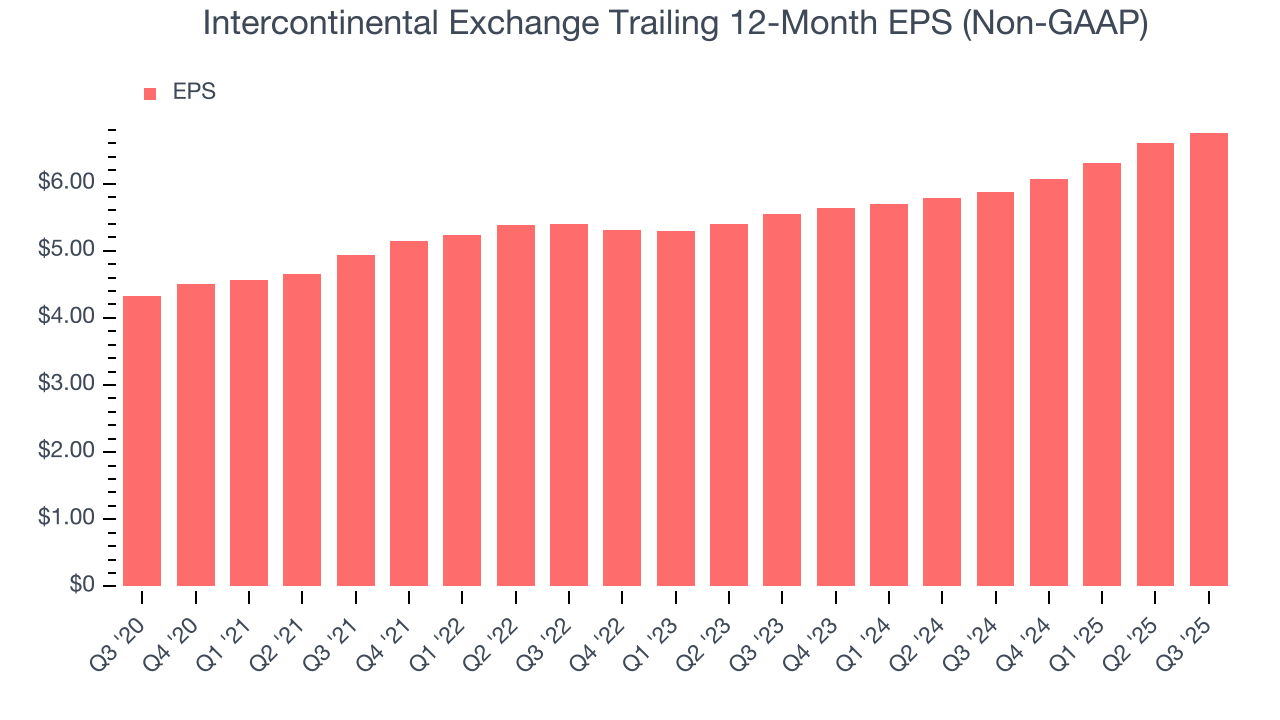
Like with revenue, we analyze EPS over a shorter period to see if we are missing a change in the business.
For Intercontinental Exchange, its two-year annual EPS growth of 10.4% was higher than its five-year trend. Accelerating earnings growth is almost always an encouraging data point.
In Q3, Intercontinental Exchange reported adjusted EPS of $1.71, up from $1.55 in the same quarter last year. This print beat analysts’ estimates by 6.4%. Over the next 12 months, Wall Street expects Intercontinental Exchange’s full-year EPS of $6.76 to grow 8.1%.
8. Return on Equity
Return on equity (ROE) measures how effectively banks generate profit from each dollar of shareholder equity - a critical funding source. High-ROE institutions typically compound shareholder wealth faster over time through retained earnings, share repurchases, and dividend payments.
Over the last five years, Intercontinental Exchange has averaged an ROE of 11.6%, respectable for a company operating in a sector where the average shakes out around 10% and those putting up 25%+ are greatly admired.
9. Balance Sheet Assessment
The debt-to-equity ratio is a widely used measure to assess a company's balance sheet health. A higher ratio means that a business aggressively financed its growth with debt. This can result in higher earnings (if the borrowed funds are invested profitably) but also increases risk.
If debt levels are too high, there could be difficulties in meeting obligations, especially during economic downturns or periods of rising interest rates if the debt has variable-rate payments.
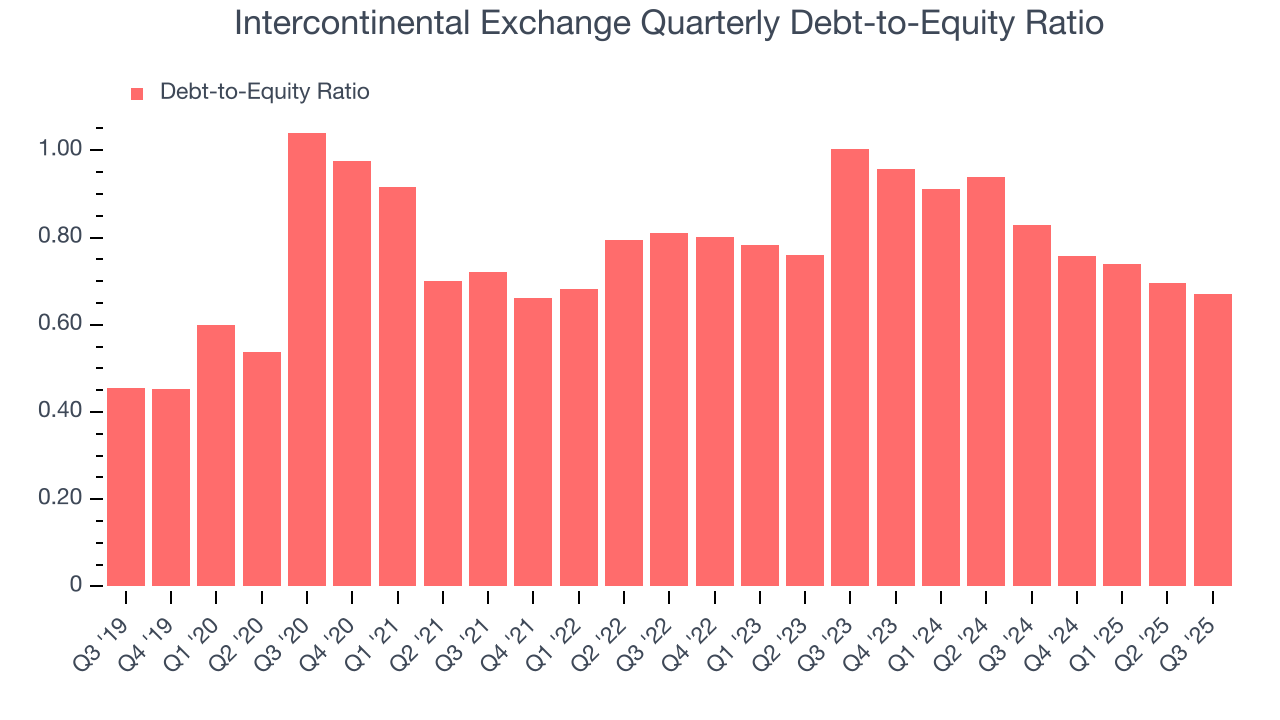
Intercontinental Exchange currently has $19.2 billion of debt and $28.64 billion of shareholder's equity on its balance sheet, and over the past four quarters, has averaged a debt-to-equity ratio of 0.7×. We think this is safe and raises no red flags. In general, we’re comfortable with any ratio below 3.5× for a financials business.
10. Key Takeaways from Intercontinental Exchange’s Q3 Results
We were impressed by how significantly Intercontinental Exchange blew past analysts’ revenue expectations this quarter. We were also glad its EPS outperformed Wall Street’s estimates. Zooming out, we think this was a good print with some key areas of upside. The stock traded up 1.5% to $152.96 immediately after reporting.
11. Is Now The Time To Buy Intercontinental Exchange?
Updated: December 4, 2025 at 11:13 PM EST
Are you wondering whether to buy Intercontinental Exchange or pass? We urge investors to not only consider the latest earnings results but also longer-term business quality and valuation as well.
Intercontinental Exchange’s business quality ultimately falls short of our standards. Although its revenue growth was solid over the last five years, it’s expected to deteriorate over the next 12 months and its declining pre-tax profit margin shows the business has become less efficient.
Intercontinental Exchange’s P/E ratio based on the next 12 months is 21.6x. This multiple tells us a lot of good news is priced in - we think there are better opportunities elsewhere.
Wall Street analysts have a consensus one-year price target of $190.29 on the company (compared to the current share price of $158.99).
Although the price target is bullish, readers should exercise caution because analysts tend to be overly optimistic. The firms they work for, often big banks, have relationships with companies that extend into fundraising, M&A advisory, and other rewarding business lines. As a result, they typically hesitate to say bad things for fear they will lose out. We at StockStory do not suffer from such conflicts of interest, so we’ll always tell it like it is.