Kellanova (K)
Kellanova doesn’t excite us. Strike one is its drop in sales and strike two is its falling cash conversion. No need to wait for strike three.― StockStory Analyst Team
1. News


2. Summary
Why We Think Kellanova Will Underperform
With Corn Flakes as its first and most iconic product, Kellanova (NYSE:K) is a packaged foods company that is dominant in the cereal and snack categories.
- Products aren't resonating with the market as its revenue declined by 5.3% annually over the last three years
- Falling earnings per share over the last three years has some investors worried as stock prices ultimately follow EPS over the long term
- A bright spot is that its revenue base of $12.67 billion gives it economies of scale and incentivizes retailers to stock its most popular products


Kellanova doesn’t meet our quality criteria. We’re redirecting our focus to better businesses.
Why There Are Better Opportunities Than Kellanova


Kellanova’s stock price of $83.48 implies a valuation ratio of 2.3x trailing 12-month price-to-sales. The market typically values companies like Kellanova based on their anticipated profits for the next 12 months, but there aren’t enough published estimates to arrive at a reliable number. You should avoid this stock for now - better opportunities lie elsewhere.
Paying a premium for high-quality companies with strong long-term earnings potential is preferable to owning challenged businesses with questionable prospects.
3. Kellanova (K) Research Report: Q3 CY2025 Update
Packaged foods company Kellanova (NYSE:K) met Wall Streets revenue expectations in Q3 CY2025, but sales were flat year on year at $3.26 billion. Its non-GAAP profit of $0.94 per share was 8.5% above analysts’ consensus estimates.
Kellanova (K) Q3 CY2025 Highlights:
- Revenue: $3.26 billion vs analyst estimates of $3.26 billion (flat year on year, in line)
- Adjusted EPS: $0.94 vs analyst estimates of $0.87 (8.5% beat)
- Adjusted EBITDA: $546 million vs analyst estimates of $543.8 million (16.7% margin, in line)
- Operating Margin: 13.9%, in line with the same quarter last year
- Free Cash Flow Margin: 11%, down from 12.7% in the same quarter last year
- Organic Revenue was flat year on year vs analyst estimates of flat growth (103 basis point miss)
- Sales Volumes fell 1.4% year on year (0.1% in the same quarter last year)
- Market Capitalization: $28.86 billion
Company Overview
With Corn Flakes as its first and most iconic product, Kellanova (NYSE:K) is a packaged foods company that is dominant in the cereal and snack categories.
The company traces its roots back to the late 1800s when the Kellogg brothers inadvertently created Corn Flakes while experimenting with foods for patients with chronic illnesses. Specifically, they accidentally left a pot of wheatberries boiling, which made them soft and flaky. The brothers decided to bake the flaky dough, resulting in a crunchy cereal.
Through organic development as well as mergers and acquisitions of companies such as Keebler (cookies and crackers) and Pringles (potato chips), Kellanova built a powerful portfolio of packaged foods brands. Today, the portfolio features iconic brands such as Rice Krispies, Nutri-Grain, Kashi, Pop Tart, Cheez-It, and Morningstar Farms, among many others.
Kellanova caters to middle-income households seeking convenience through trusted brands. The heads or caretakers of these households are usually busy and don’t have the time to cook meals or prepare snacks from scratch. The company’s products add convenience to everyday life, and the company’s brands are often ones that customers have been eating since childhood, which adds an element of comfort. Kellanova products are sold nearly everywhere. Retailers from the largest supermarkets to the corner deli or bodega all carry that box of Corn Flakes or the box of Pop-Tarts. Given the company’s scale and traffic-driving brands, Kellanova often enjoys prominent placement on retailer shelves.
In August 2024, Mars announced that it is acquiring Kellanova for $83.50 per share in cash, for a total consideration of $36 billion. The deal is expected to close int he first half of 2025.
4. Shelf-Stable Food
As America industrialized and moved away from an agricultural economy, people faced more demands on their time. Packaged foods emerged as a solution offering convenience to the evolving American family, whether it be canned goods or snacks. Today, Americans seek brands that are high in quality, reliable, and reasonably priced. Furthermore, there's a growing emphasis on health-conscious and sustainable food options. Packaged food stocks are considered resilient investments. People always need to eat, so these companies can enjoy consistent demand as long as they stay on top of changing consumer preferences. The industry spans from multinational corporations to smaller specialized firms and is subject to food safety and labeling regulations.
Competitors in packaged food with broad brand portfolios include General Mills (NYSE:GIS), Mondelez (NASDAQ:MDLZ), Kraft Heinz (NASDAQ:KHC), and Nestle (SWX:NESN).
5. Revenue Growth
Examining a company’s long-term performance can provide clues about its quality. Even a bad business can shine for one or two quarters, but a top-tier one grows for years.
With $12.67 billion in revenue over the past 12 months, Kellanova is one of the larger consumer staples companies and benefits from a well-known brand that influences purchasing decisions. However, its scale is a double-edged sword because it’s harder to find incremental growth when your existing brands have penetrated most of the market. For Kellanova to boost its sales, it likely needs to adjust its prices, launch new offerings, or lean into foreign markets.
As you can see below, Kellanova struggled to increase demand as its $12.67 billion of sales for the trailing 12 months was close to its revenue three years ago. This is mainly because it failed to grow its volumes.

This quarter, Kellanova’s $3.26 billion of revenue was flat year on year and in line with Wall Street’s estimates.
Looking ahead, sell-side analysts expect revenue to grow 2.4% over the next 12 months. Although this projection suggests its newer products will fuel better top-line performance, it is still below average for the sector.
6. Volume Growth
Revenue growth can be broken down into changes in price and volume (the number of units sold). While both are important, volume is the lifeblood of a successful staples business as there’s a ceiling to what consumers will pay for everyday goods; they can always trade down to non-branded products if the branded versions are too expensive.
To analyze whether Kellanova generated its growth from changes in price or volume, we can compare its volume growth to its organic revenue growth, which excludes non-fundamental impacts on company financials like mergers and currency fluctuations.
Over the last two years, Kellanova’s quarterly sales volumes have, on average, stayed about the same. This stability is normal as the quantity demanded for consumer staples products typically doesn’t see much volatility. The company’s flat volumes also indicate its average organic revenue growth of 3.7% was generated from price increases.
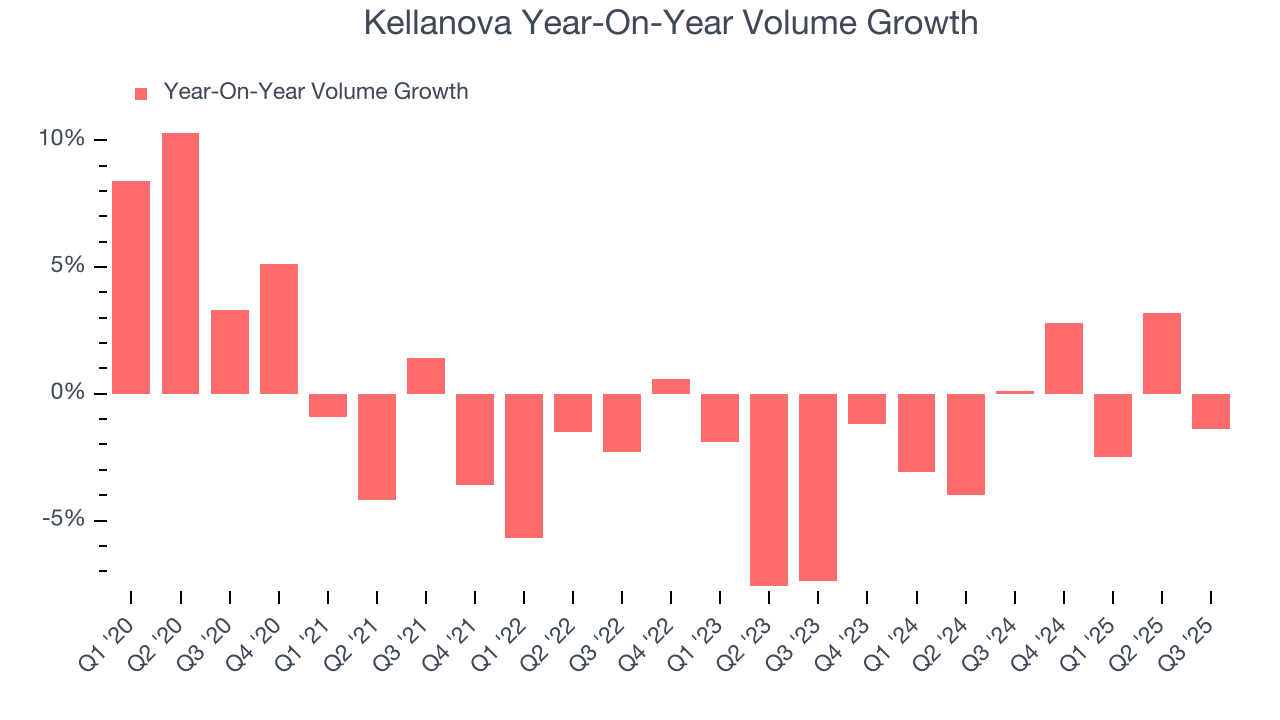
In Kellanova’s Q3 2025, sales volumes dropped 1.4% year on year. This result represents a further deceleration from its historical levels, showing the business is struggling to move its products.
7. Gross Margin & Pricing Power
At StockStory, we prefer high gross margin businesses because they indicate pricing power or differentiated products, giving the company a chance to generate higher operating profits.
Kellanova’s unit economics are higher than the typical consumer staples company, giving it the flexibility to invest in areas such as marketing and talent to reach more consumers. As you can see below, it averaged a decent 35.6% gross margin over the last two years. Said differently, Kellanova paid its suppliers $64.36 for every $100 in revenue. 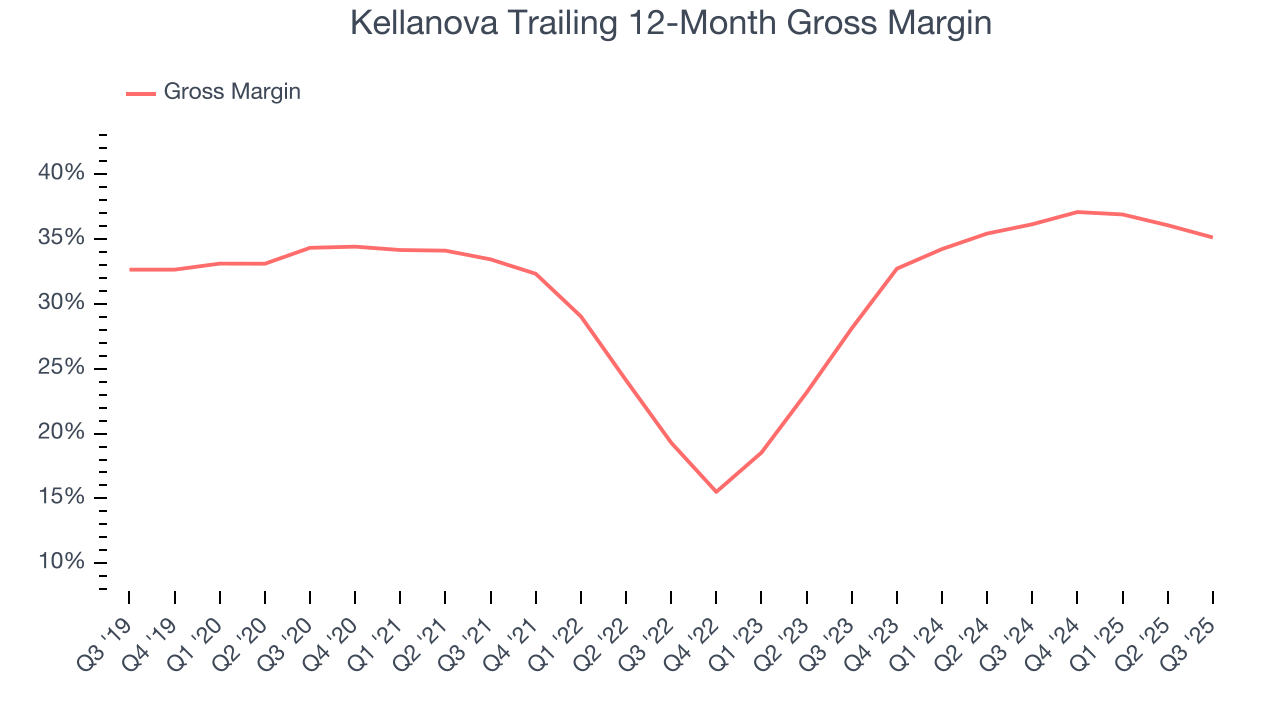
Kellanova produced a 33.3% gross profit margin in Q3, marking a 3.7 percentage point decrease from 36.9% in the same quarter last year. Kellanova’s full-year margin has also been trending down over the past 12 months, decreasing by 1 percentage points. If this move continues, it could suggest a more competitive environment with some pressure to lower prices and higher input costs (such as raw materials and manufacturing expenses).
8. Operating Margin
Operating margin is an important measure of profitability as it shows the portion of revenue left after accounting for all core expenses – everything from the cost of goods sold to advertising and wages. It’s also useful for comparing profitability across companies with different levels of debt and tax rates because it excludes interest and taxes.
Kellanova has managed its cost base well over the last two years. It demonstrated solid profitability for a consumer staples business, producing an average operating margin of 13.8%.
Looking at the trend in its profitability, Kellanova’s operating margin rose by 1.6 percentage points over the last year, showing its efficiency has improved.
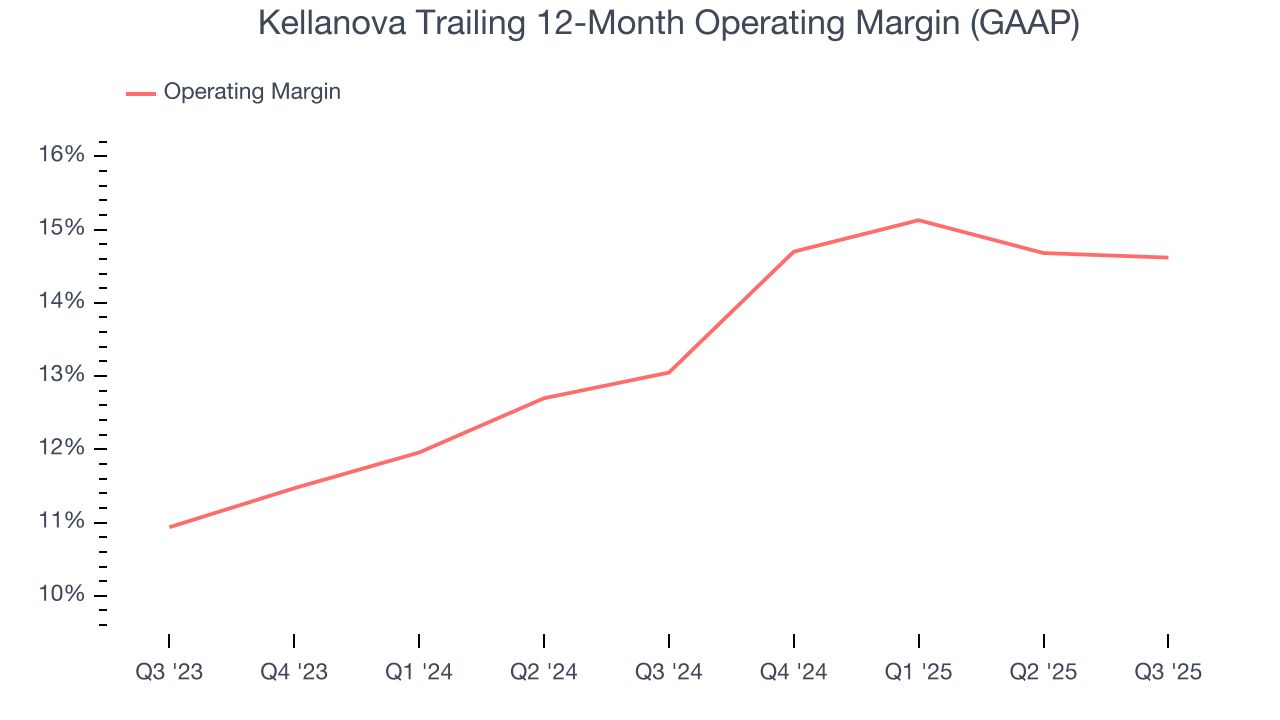
In Q3, Kellanova generated an operating margin profit margin of 13.9%, in line with the same quarter last year. This indicates the company’s cost structure has recently been stable.
9. Earnings Per Share
We track the change in earnings per share (EPS) for the same reason as long-term revenue growth. Compared to revenue, however, EPS highlights whether a company’s growth is profitable.
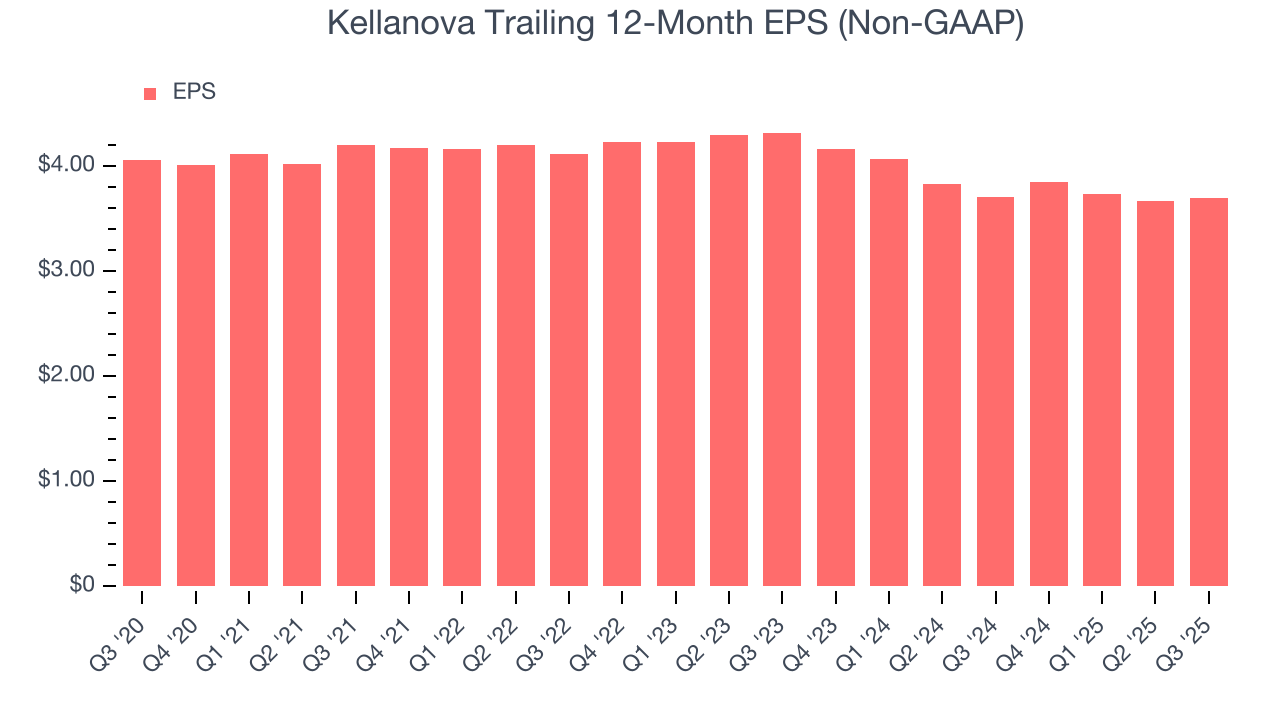
In Q3, Kellanova reported adjusted EPS of $0.94, up from $0.91 in the same quarter last year. This print beat analysts’ estimates by 8.5%. Over the next 12 months, Wall Street expects Kellanova’s full-year EPS of $3.70 to stay about the same.
10. Cash Is King
Although earnings are undoubtedly valuable for assessing company performance, we believe cash is king because you can’t use accounting profits to pay the bills.
Kellanova has shown decent cash profitability, giving it some flexibility to reinvest or return capital to investors. The company’s free cash flow margin averaged 6% over the last two years, slightly better than the broader consumer staples sector.
Taking a step back, we can see that Kellanova’s margin dropped by 2.5 percentage points over the last year. If its declines continue, it could signal increasing investment needs and capital intensity.
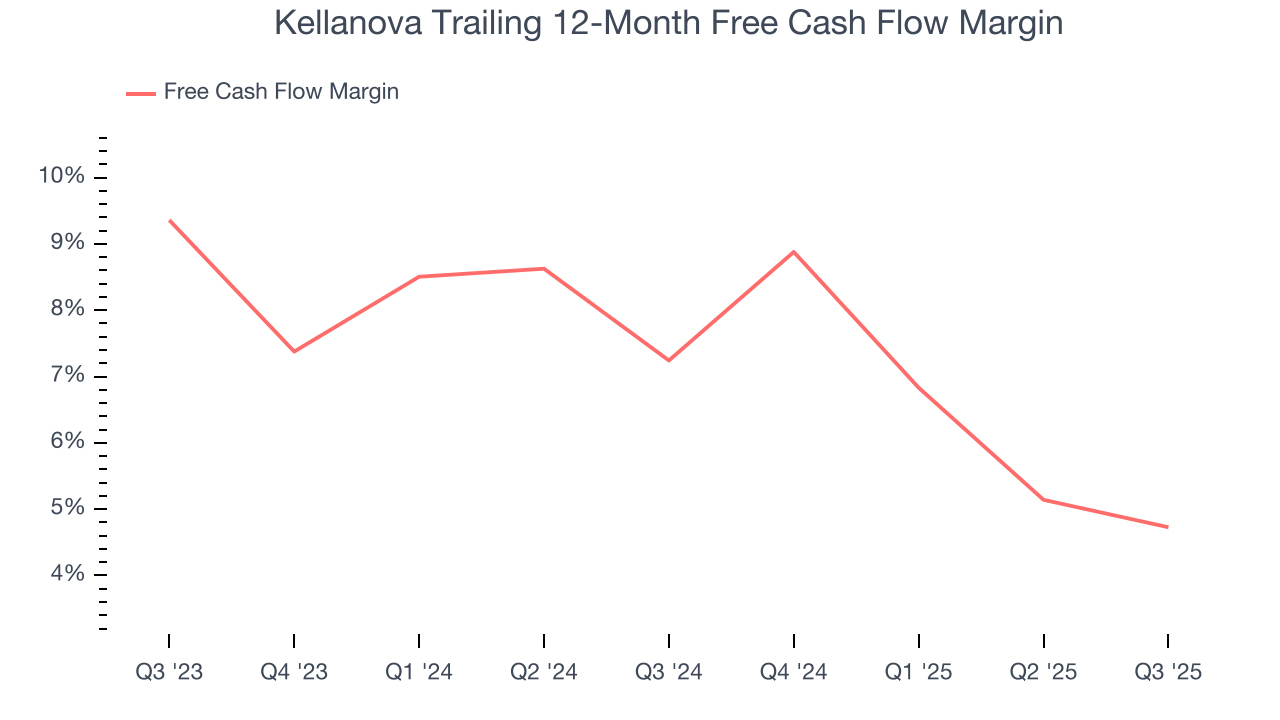
Kellanova’s free cash flow clocked in at $359 million in Q3, equivalent to a 11% margin. The company’s cash profitability regressed as it was 1.7 percentage points lower than in the same quarter last year, but it’s still above its two-year average. We wouldn’t read too much into this quarter’s decline because investment needs can be seasonal, causing short-term swings. Long-term trends trump temporary fluctuations.
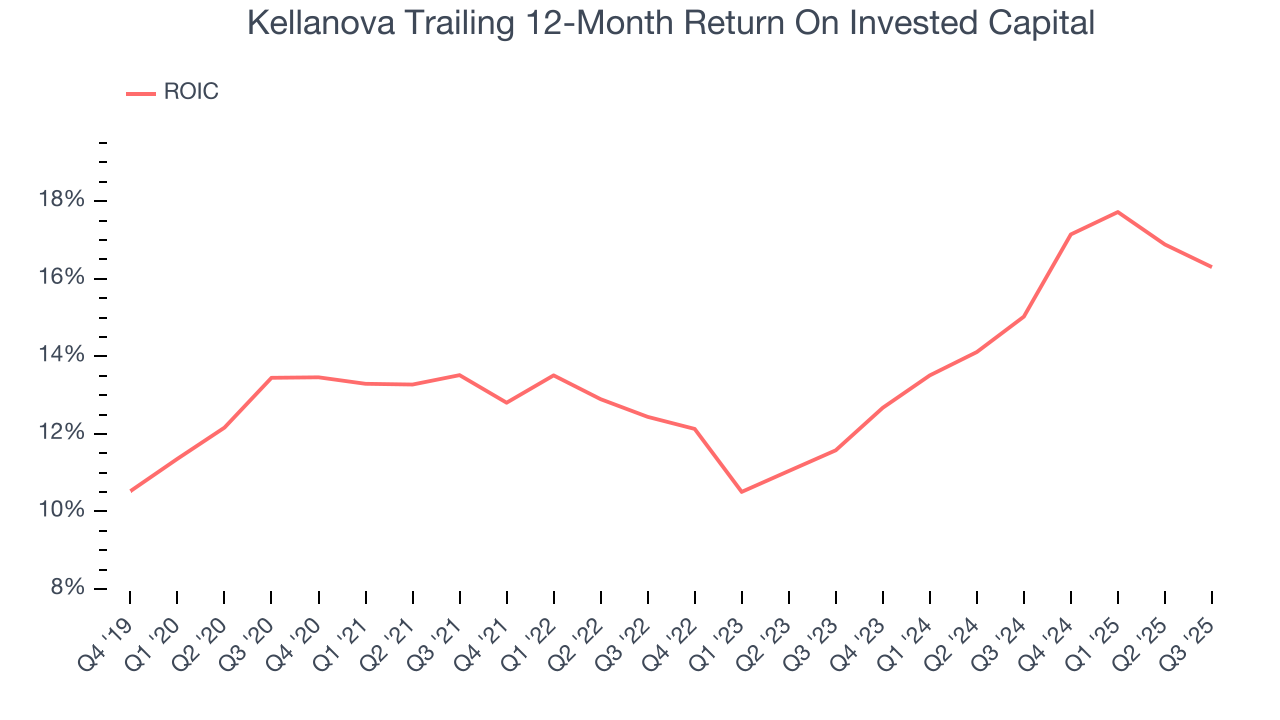
11. Return on Invested Capital (ROIC)
EPS and free cash flow tell us whether a company was profitable while growing its revenue. But was it capital-efficient? Enter ROIC, a metric showing how much operating profit a company generates relative to the money it has raised (debt and equity).
Kellanova’s management team makes decent investment decisions and generates value for shareholders. Its five-year average ROIC was 13.8%, slightly better than typical consumer staples business.
12. Balance Sheet Assessment
Kellanova reported $240 million of cash and $5.63 billion of debt on its balance sheet in the most recent quarter. As investors in high-quality companies, we primarily focus on two things: 1) that a company’s debt level isn’t too high and 2) that its interest payments are not excessively burdening the business.
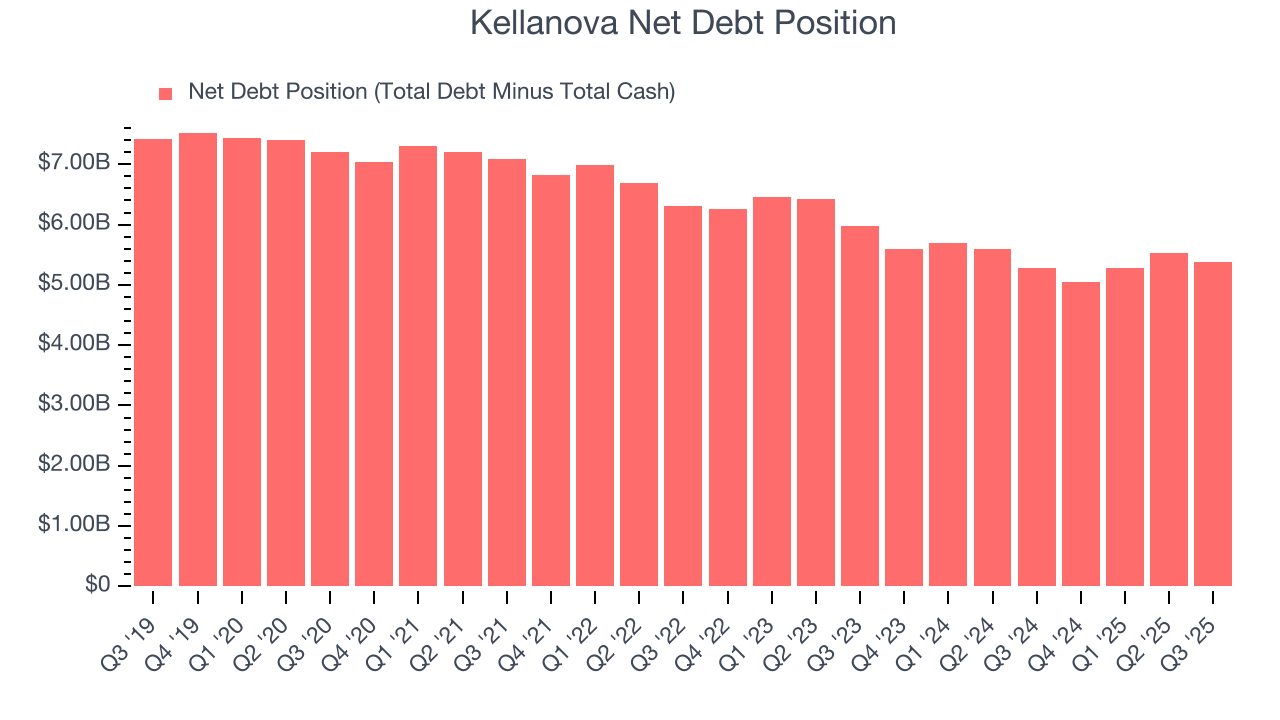
With $2.19 billion of EBITDA over the last 12 months, we view Kellanova’s 2.5× net-debt-to-EBITDA ratio as safe. We also see its $31 million of annual interest expenses as appropriate. The company’s profits give it plenty of breathing room, allowing it to continue investing in growth initiatives.
13. Key Takeaways from Kellanova’s Q3 Results
It was good to see Kellanova beat analysts’ EPS expectations this quarter. On the other hand, its gross margin missed and its organic revenue fell slightly short of Wall Street’s estimates. Overall, this was a mixed quarter. The stock remained flat at $83.05 immediately after reporting.
14. Is Now The Time To Buy Kellanova?
Updated: December 15, 2025 at 9:47 PM EST
A common mistake we notice when investors are deciding whether to buy a stock or not is that they simply look at the latest earnings results. Business quality and valuation matter more, so we urge you to understand these dynamics as well.
Kellanova isn’t a terrible business, but it isn’t one of our picks. For starters, its revenue has declined over the last three years. And while its favorable brand awareness gives it meaningful influence over consumers’ dining decisions, the downside is its declining EPS over the last three years makes it a less attractive asset to the public markets. On top of that, its cash profitability fell over the last year.
Kellanova’s price-to-sales ratio based on the trailing 12 months is 2.3x. The market typically values companies like Kellanova based on their anticipated profits for the next 12 months, but there aren’t enough published estimates to arrive at a reliable number. You should avoid this stock for now - better opportunities lie elsewhere.