KB Home (KBH)
We wouldn’t recommend KB Home. Its poor sales growth and falling returns on capital suggest its growth opportunities are shrinking.― StockStory Analyst Team
1. News


2. Summary
Why We Think KB Home Will Underperform
The first homebuilder to be listed on the NYSE, KB Home (NYSE:KBH) is a homebuilding company targeting the first-time home buyer and move-up buyer markets.
- Annual sales declines of 1.4% for the past two years show its products and services struggled to connect with the market during this cycle
- Earnings per share have dipped by 4.1% annually over the past two years, which is concerning because stock prices follow EPS over the long term
- Projected sales decline of 11.7% over the next 12 months indicates demand will continue deteriorating


KB Home falls below our quality standards. You should search for better opportunities.
Why There Are Better Opportunities Than KB Home


KB Home is trading at $52.75 per share, or 12.6x forward P/E. Yes, this valuation multiple is lower than that of other industrials peers, but we’ll remind you that you often get what you pay for.
It’s better to pay up for high-quality businesses with higher long-term earnings potential rather than to buy lower-quality stocks because they appear cheap. These challenged businesses often don’t re-rate, a phenomenon known as a “value trap”.
3. KB Home (KBH) Research Report: Q4 CY2025 Update
Homebuilder KB Home (NYSE:KBH) reported revenue ahead of Wall Streets expectations in Q4 CY2025, but sales fell by 15.3% year on year to $1.69 billion. Its non-GAAP profit of $1.92 per share was 7.4% above analysts’ consensus estimates.
KB Home (KBH) Q4 CY2025 Highlights:
- Revenue: $1.69 billion vs analyst estimates of $1.66 billion (15.3% year-on-year decline, 2.3% beat)
- Adjusted EPS: $1.92 vs analyst estimates of $1.79 (7.4% beat)
- Operating Margin: 6.9%, down from 11.7% in the same quarter last year
- Backlog: $1.40 billion at quarter end, down 37.4% year on year
- Market Capitalization: $4.08 billion
Company Overview
The first homebuilder to be listed on the NYSE, KB Home (NYSE:KB) is a homebuilding company targeting the first-time home buyer and move-up buyer markets.
KB Home (NYSE:KBH), one of the largest and most recognized homebuilding companies in the U.S., has been building homes for over 65 years, with more than 680,000 homes built since its founding in 1957.
The company builds a variety of new homes, including attached and detached single-family homes, townhomes, and condominiums. These properties are typically designed for first-time, first move-up (current homeowners looking to upgrade their homes), second move-up, and retirement age homebuyers. KB Home also offers homes in development communities, urban in-fill locations, and multi-purpose developments.
The company's homebuilding operations represent the majority of its business. The company supplements its core business with a financial services arm, which offers various insurance products to homebuyers in its markets and title services in certain areas, and KBHS Home Loans, an unconsolidated joint venture. KBHS Home Loans provides mortgage banking services, including residential consumer mortgage loan originations, to homebuyers.
KB Home generates revenue primarily through the sale of its homes. The company's homes are offered to a wide range of customers, from first-time homebuyers to active adults, with a focus on providing affordable, personalized homes within the reach of the largest segments of demand. KB Home's Built to Order process allows homebuyers to select their lot location, floor plan, elevation, and structural options. It also allows them to personalize their homes with a wide array of design choices and upgrades.
4. Home Builders
Traditionally, homebuilders have built competitive advantages with economies of scale that lead to advantaged purchasing and brand recognition among consumers. Aesthetic trends have always been important in the space, but more recently, energy efficiency and conservation are driving innovation. However, these companies are still at the whim of the macro, specifically interest rates that heavily impact new and existing home sales. In fact, homebuilders are one of the most cyclical subsectors within industrials.
Competitors of KB Home include D.R. Horton (NYSE:DHI), Lennar (NYSE:LEN), and PulteGroup (NYSE:PHM).
5. Revenue Growth
A company’s long-term performance is an indicator of its overall quality. Any business can put up a good quarter or two, but many enduring ones grow for years. Luckily, KB Home’s sales grew at a decent 8.3% compounded annual growth rate over the last five years. Its growth was slightly above the average industrials company and shows its offerings resonate with customers.
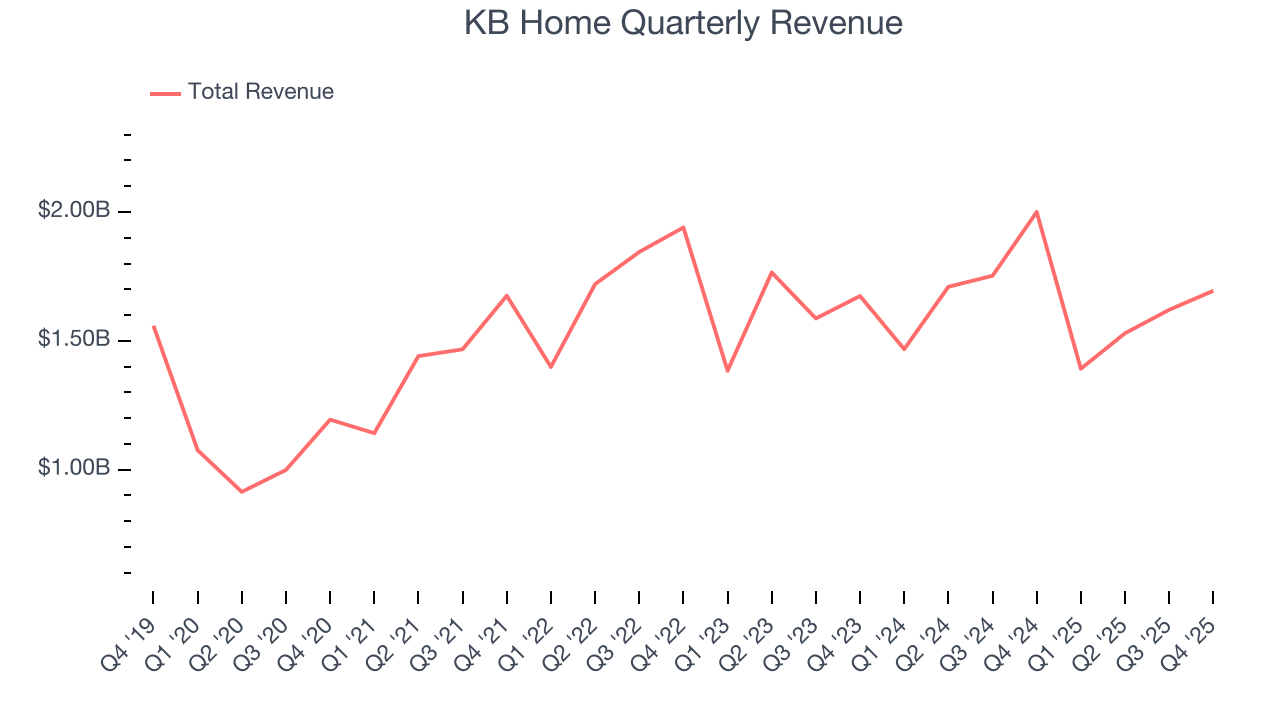
Long-term growth is the most important, but within industrials, a half-decade historical view may miss new industry trends or demand cycles. KB Home’s recent performance marks a sharp pivot from its five-year trend as its revenue has shown annualized declines of 1.4% over the last two years. 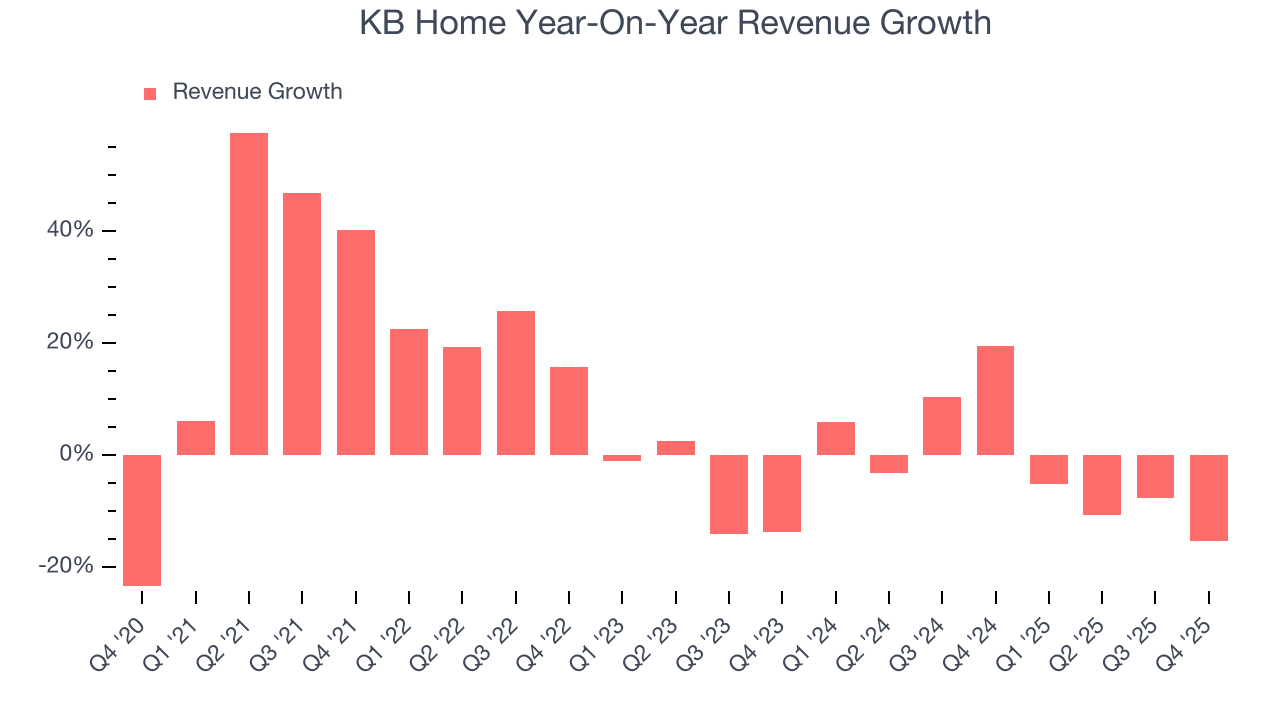
KB Home also reports its backlog, or the value of its outstanding orders that have not yet been executed or delivered. KB Home’s backlog reached $1.40 billion in the latest quarter and averaged 21.6% year-on-year declines over the last two years. Because this number is lower than its revenue growth, we can see the company hasn’t secured enough new orders to maintain its growth rate in the future. 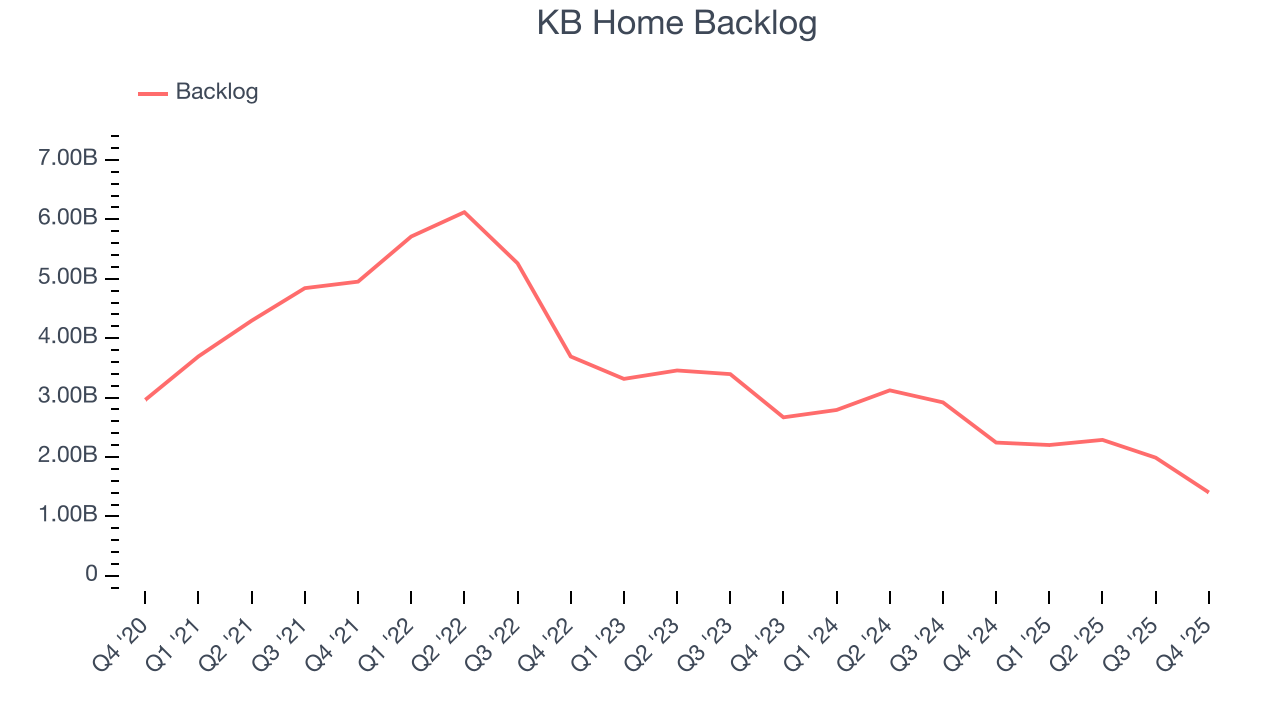
This quarter, KB Home’s revenue fell by 15.3% year on year to $1.69 billion but beat Wall Street’s estimates by 2.3%.
Looking ahead, sell-side analysts expect revenue to decline by 7.8% over the next 12 months, a deceleration versus the last two years. This projection is underwhelming and indicates its products and services will face some demand challenges.
6. Gross Margin & Pricing Power
Gross profit margin is a critical metric to track because it sheds light on its pricing power, complexity of products, and ability to procure raw materials, equipment, and labor.
KB Home has bad unit economics for an industrials business, signaling it operates in a competitive market. As you can see below, it averaged a 22.2% gross margin over the last five years. Said differently, KB Home had to pay a chunky $77.84 to its suppliers for every $100 in revenue. 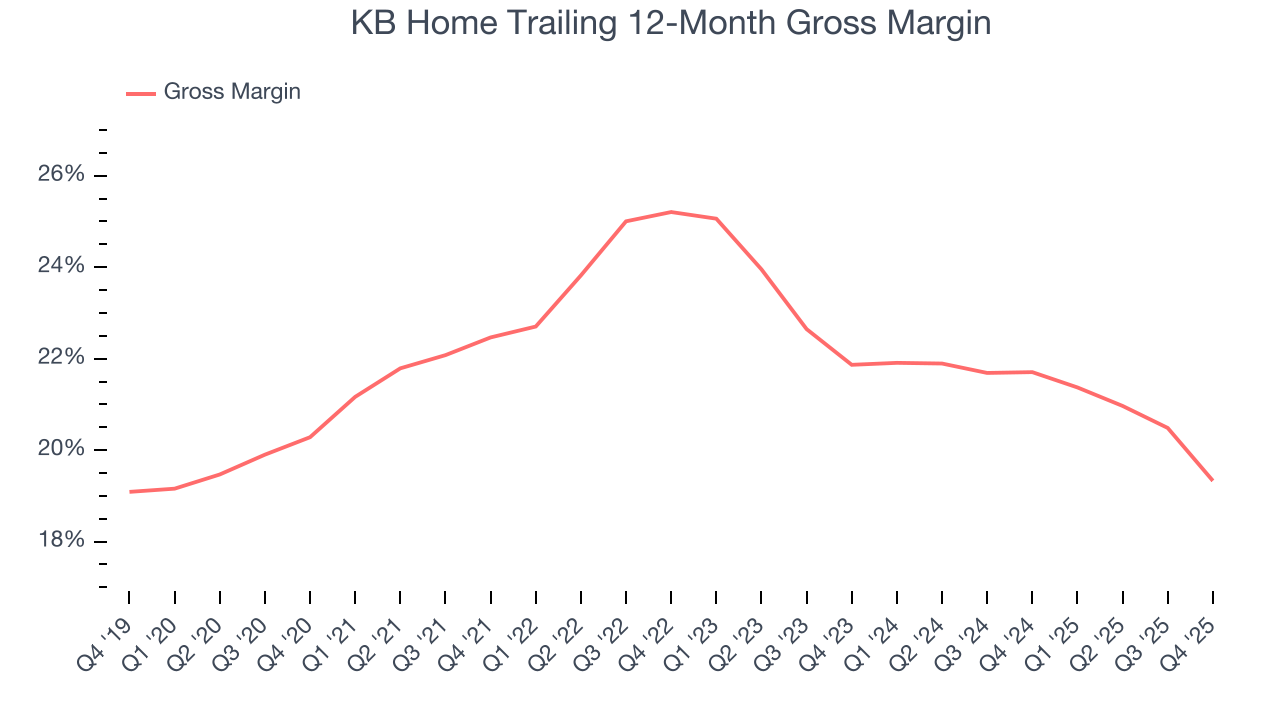
This quarter, KB Home’s gross profit margin was 17.4%, marking a 4.1 percentage point decrease from 21.5% in the same quarter last year. KB Home’s full-year margin has also been trending down over the past 12 months, decreasing by 2.4 percentage points. If this move continues, it could suggest a more competitive environment with some pressure to lower prices and higher input costs (such as raw materials and manufacturing expenses).
7. Operating Margin
KB Home has managed its cost base well over the last five years. It demonstrated solid profitability for an industrials business, producing an average operating margin of 11.7%. This result was particularly impressive because of its low gross margin, which is mostly a factor of what it sells and takes huge shifts to move meaningfully. Companies have more control over their operating margins, and it’s a show of well-managed operations if they’re high when gross margins are low.
Analyzing the trend in its profitability, KB Home’s operating margin decreased by 3.5 percentage points over the last five years. This raises questions about the company’s expense base because its revenue growth should have given it leverage on its fixed costs, resulting in better economies of scale and profitability.
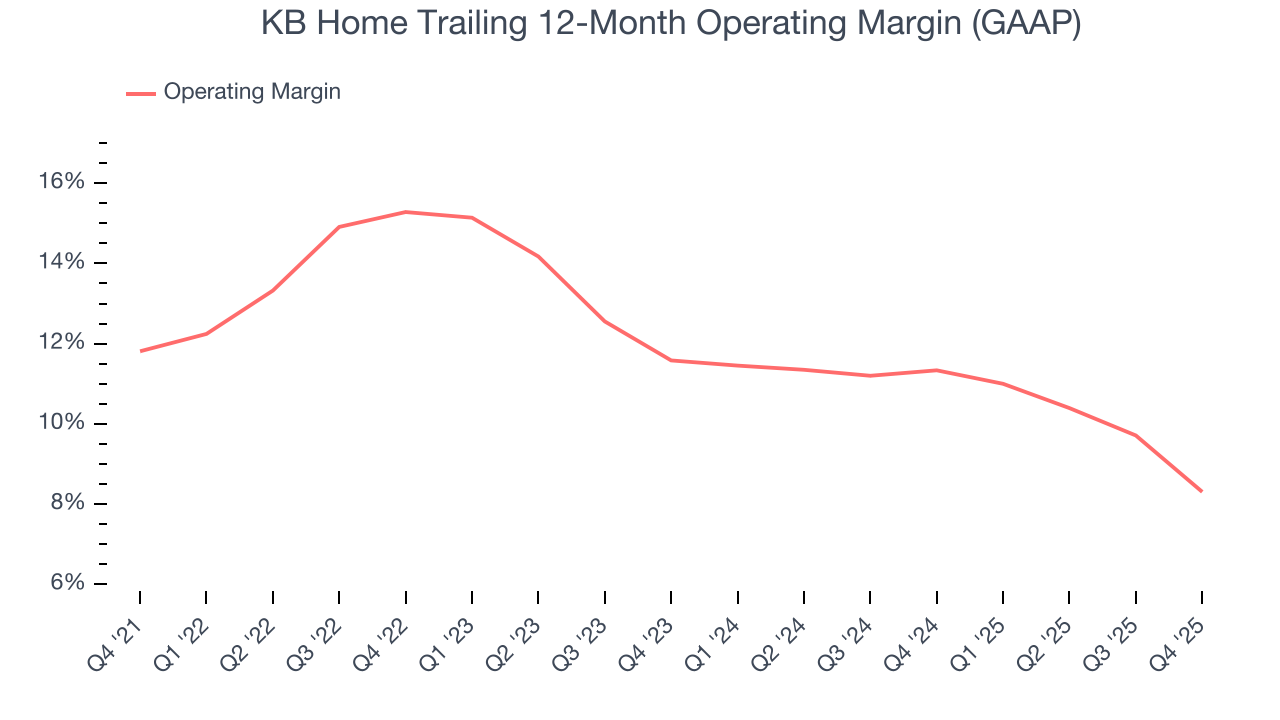
In Q4, KB Home generated an operating margin profit margin of 6.9%, down 4.8 percentage points year on year. Since KB Home’s operating margin decreased more than its gross margin, we can assume it was less efficient because expenses such as marketing, R&D, and administrative overhead increased.
8. Earnings Per Share
Revenue trends explain a company’s historical growth, but the long-term change in earnings per share (EPS) points to the profitability of that growth – for example, a company could inflate its sales through excessive spending on advertising and promotions.
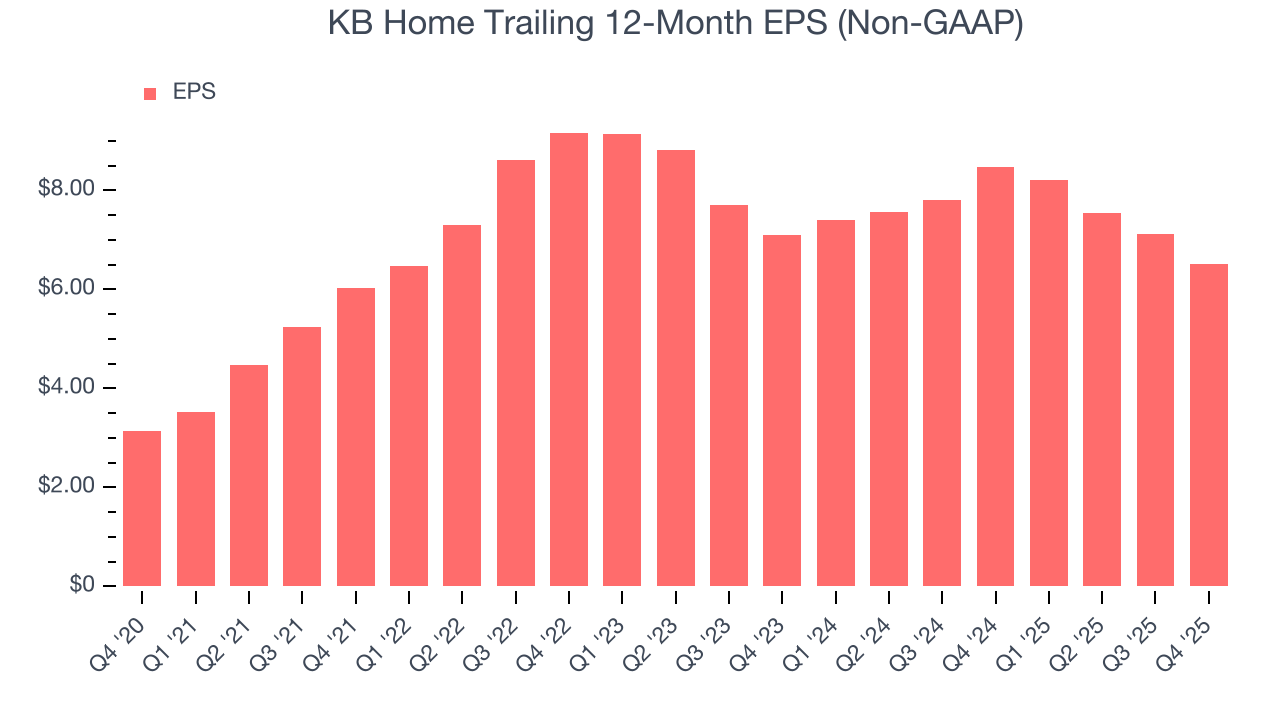
KB Home’s EPS grew at a spectacular 15.8% compounded annual growth rate over the last five years, higher than its 8.3% annualized revenue growth. However, this alone doesn’t tell us much about its business quality because its operating margin didn’t improve.
Diving into the nuances of KB Home’s earnings can give us a better understanding of its performance. A five-year view shows that KB Home has repurchased its stock, shrinking its share count by 31.2%. This tells us its EPS outperformed its revenue not because of increased operational efficiency but financial engineering, as buybacks boost per share earnings. 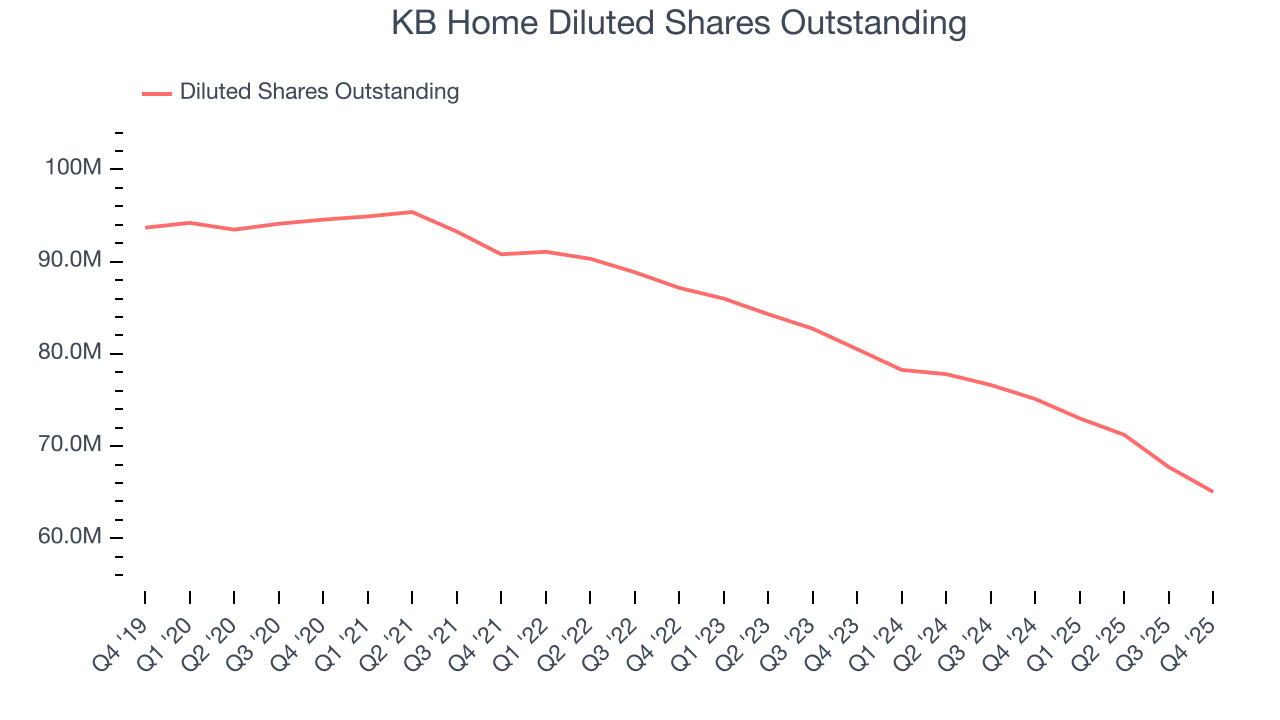
Like with revenue, we analyze EPS over a more recent period because it can provide insight into an emerging theme or development for the business.
For KB Home, its two-year annual EPS declines of 4.1% mark a reversal from its (seemingly) healthy five-year trend. We hope KB Home can return to earnings growth in the future.
In Q4, KB Home reported adjusted EPS of $1.92, down from $2.52 in the same quarter last year. Despite falling year on year, this print beat analysts’ estimates by 7.4%. Over the next 12 months, Wall Street expects KB Home’s full-year EPS of $6.52 to shrink by 8.2%.
9. Cash Is King
Although earnings are undoubtedly valuable for assessing company performance, we believe cash is king because you can’t use accounting profits to pay the bills.
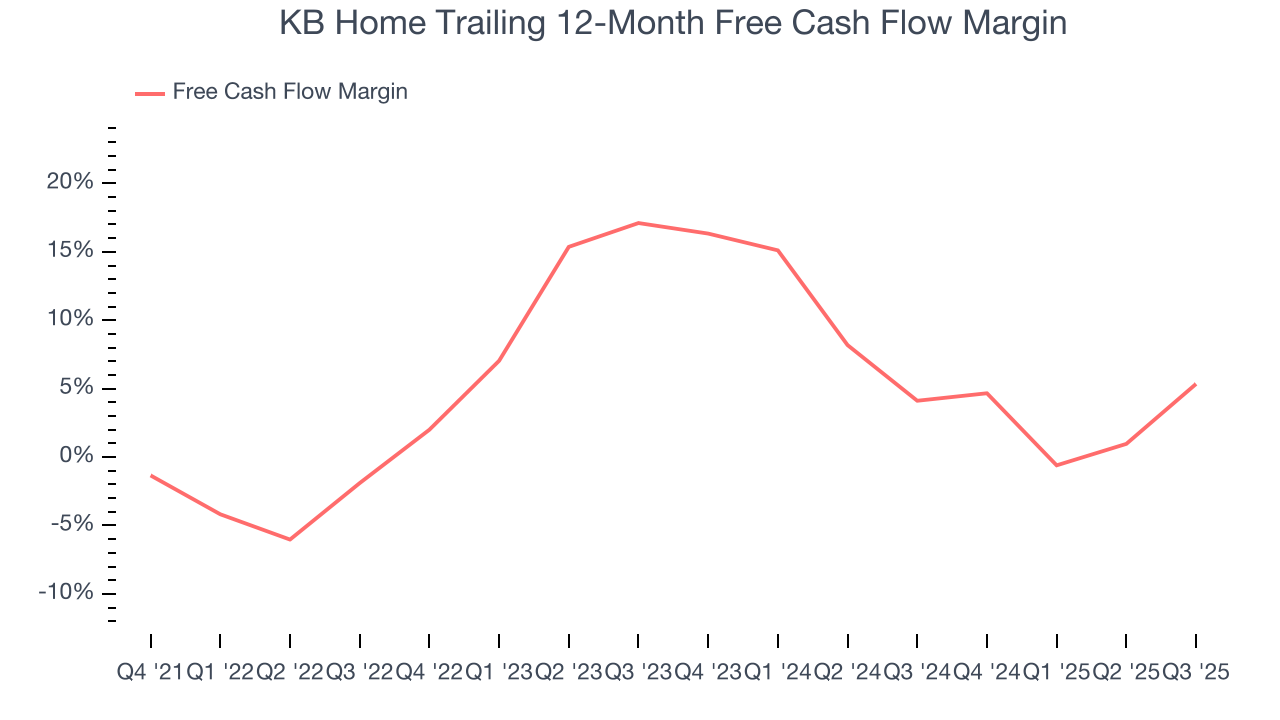
KB Home has shown weak cash profitability over the last five years, giving the company limited opportunities to return capital to shareholders. Its free cash flow margin averaged 4.7%, subpar for an industrials business. The divergence from its good operating margin stems from its capital-intensive business model, which requires KB Home to make large cash investments in working capital and capital expenditures.
Taking a step back, an encouraging sign is that KB Home’s margin expanded by 5.1 percentage points during that time. The company’s improvement shows it’s heading in the right direction, and we can see it became a less capital-intensive business because its free cash flow profitability rose while its operating profitability fell.
10. Return on Invested Capital (ROIC)
EPS and free cash flow tell us whether a company was profitable while growing its revenue. But was it capital-efficient? A company’s ROIC explains this by showing how much operating profit it makes compared to the money it has raised (debt and equity).
KB Home’s management team makes decent investment decisions and generates value for shareholders. Its five-year average ROIC was 12%, slightly better than typical industrials business.
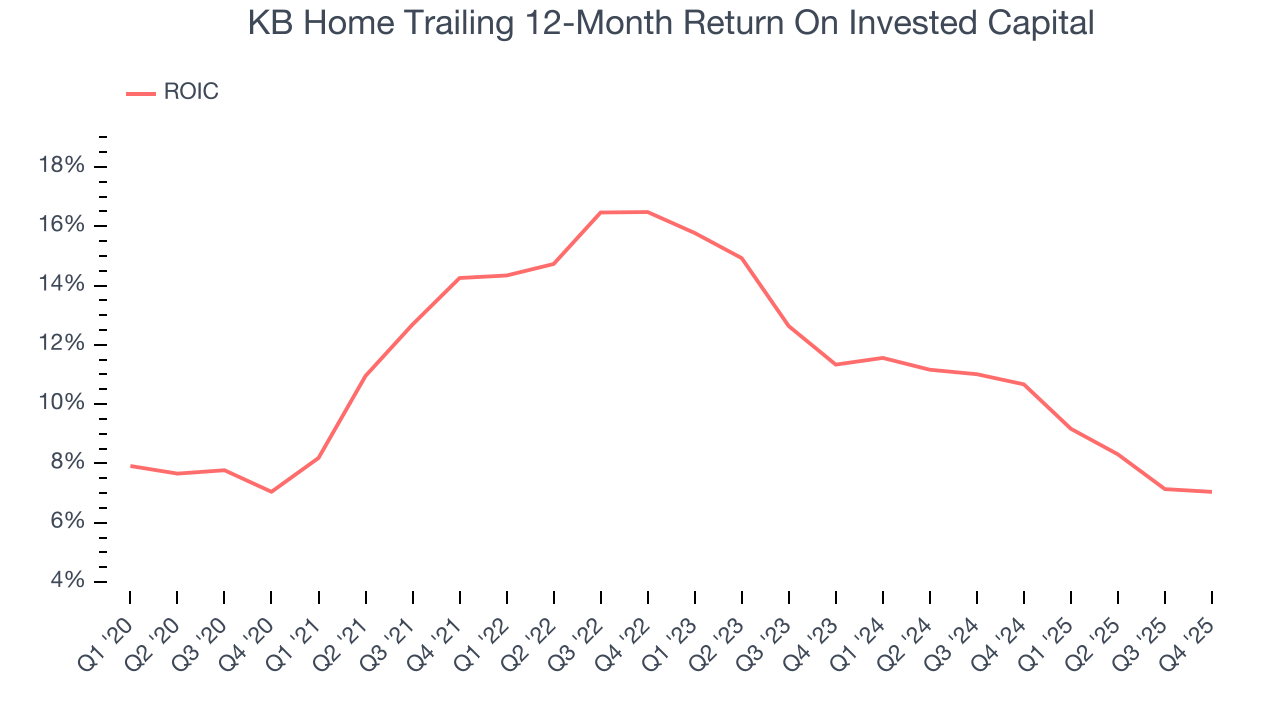
We like to invest in businesses with high returns, but the trend in a company’s ROIC is what often surprises the market and moves the stock price. Unfortunately, KB Home’s ROIC has decreased over the last few years. We like what management has done in the past, but its declining returns are perhaps a symptom of fewer profitable growth opportunities.
11. Balance Sheet Assessment
KB Home reported $228.6 million of cash and $1.69 billion of debt on its balance sheet in the most recent quarter. As investors in high-quality companies, we primarily focus on two things: 1) that a company’s debt level isn’t too high and 2) that its interest payments are not excessively burdening the business.
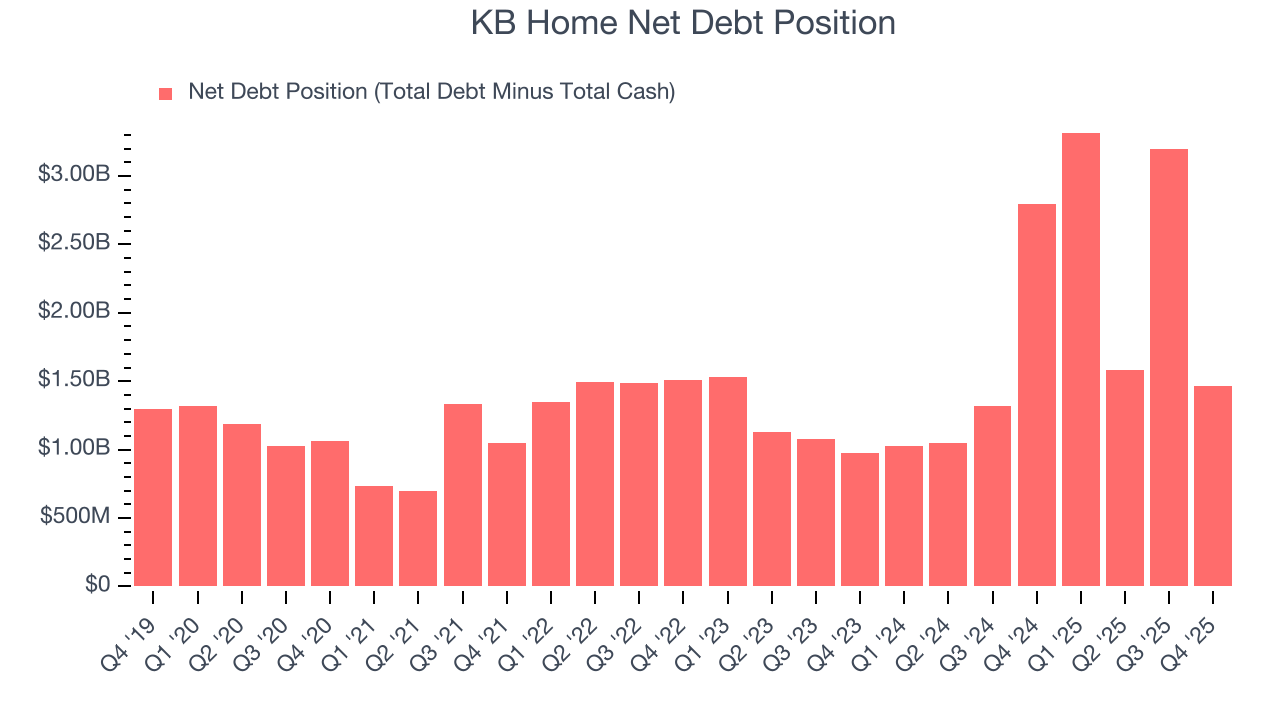
With $556.2 million of EBITDA over the last 12 months, we view KB Home’s 2.6× net-debt-to-EBITDA ratio as safe. We also see its $3.87 million of annual interest expenses as appropriate. The company’s profits give it plenty of breathing room, allowing it to continue investing in growth initiatives.
12. Key Takeaways from KB Home’s Q4 Results
We enjoyed seeing KB Home beat analysts’ revenue expectations this quarter. We were also glad its EPS outperformed Wall Street’s estimates. On the other hand, its backlog fell short of Wall Street’s estimates, and this is weighing on shares since backlog is a leading indicator of future revenue. Overall, this was a mixed quarter. The stock traded down 5.1% to $59.55 immediately after reporting.
13. Is Now The Time To Buy KB Home?
Updated: March 15, 2026 at 11:09 PM EDT
Before deciding whether to buy KB Home or pass, we urge investors to consider business quality, valuation, and the latest quarterly results.
KB Home doesn’t pass our quality test. Although its revenue growth was good over the last five years, it’s expected to deteriorate over the next 12 months and its diminishing returns show management's prior bets haven't worked out. And while the company’s rising cash profitability gives it more optionality, the downside is its projected EPS for the next year is lacking.
KB Home’s P/E ratio based on the next 12 months is 12.6x. This valuation multiple is fair, but we don’t have much confidence in the company. There are superior stocks to buy right now.
Wall Street analysts have a consensus one-year price target of $61.42 on the company (compared to the current share price of $52.75).
Although the price target is bullish, readers should exercise caution because analysts tend to be overly optimistic. The firms they work for, often big banks, have relationships with companies that extend into fundraising, M&A advisory, and other rewarding business lines. As a result, they typically hesitate to say bad things for fear they will lose out. We at StockStory do not suffer from such conflicts of interest, so we’ll always tell it like it is.