Leggett & Platt (LEG)
Leggett & Platt keeps us up at night. Not only are its sales cratering but also its low returns on capital suggest it struggles to generate profits.― StockStory Analyst Team
1. News


2. Summary
Why We Think Leggett & Platt Will Underperform
Founded in 1883, Leggett & Platt (NYSE:LEG) is a diversified manufacturer of products and components for various industries.
- Annual revenue declines of 1.1% over the last five years indicate problems with its market positioning
- Earnings per share decreased by more than its revenue over the last five years, showing each sale was less profitable
- Forecasted revenue decline of 4% for the upcoming 12 months implies demand will fall even further


Leggett & Platt doesn’t live up to our standards. We’d rather invest in businesses with stronger moats.
Why There Are Better Opportunities Than Leggett & Platt


Leggett & Platt is trading at $9.49 per share, or 9.1x forward P/E. This sure is a cheap multiple, but you get what you pay for.
Our advice is to pay up for elite businesses whose advantages are tailwinds to earnings growth. Don’t get sucked into lower-quality businesses just because they seem like bargains. These mediocre businesses often never achieve a higher multiple as hoped, a phenomenon known as a “value trap”.
3. Leggett & Platt (LEG) Research Report: Q4 CY2025 Update
Manufacturing company Leggett & Platt (NYSE:LEG) met Wall Street’s revenue expectations in Q4 CY2025, but sales fell by 11.2% year on year to $938.6 million. The company’s outlook for the full year was close to analysts’ estimates with revenue guided to $3.9 billion at the midpoint. Its non-GAAP profit of $1.05 per share was significantly above analysts’ consensus estimates.
Leggett & Platt (LEG) Q4 CY2025 Highlights:
- Revenue: $938.6 million vs analyst estimates of $938.7 million (11.2% year-on-year decline, in line)
- Adjusted EPS: $1.05 vs analyst estimates of $0.23 (significant beat)
- Adjusted EBITDA: $79.6 million vs analyst estimates of $88.18 million (8.5% margin, 9.7% miss)
- Adjusted EPS guidance for the upcoming financial year 2026 is $1.10 at the midpoint, beating analyst estimates by 1.1%
- Operating Margin: 3.4%, in line with the same quarter last year
- Free Cash Flow Margin: 10.9%, up from 9.5% in the same quarter last year
- Market Capitalization: $1.71 billion
Company Overview
Founded in 1883, Leggett & Platt (NYSE:LEG) is a diversified manufacturer of products and components for various industries.
The company started as a producer of bedding components and has since expanded into numerous other sectors. Leggett & Platt's business is divided into several segments, including Bedding, Specialized Products, and Furniture, Flooring & Textile (FF&T). This diversification strategy has enabled the company to maintain stability.
In the Bedding Products segment, Leggett & Platt is a leading manufacturer of components used in the production of mattresses, such as innerspring mattresses and foundations. The company has numerous patents and industry-firsts that have shaped the way mattresses are made and experienced.
The Specialized Products segment focuses on producing components for automobiles, such as lumbar support systems and seat suspension systems.
Leggett & Platt's Furniture, Flooring & Textile Products segment includes the production of components used in the manufacturing of upholstered furniture, such as recliner mechanisms and sofa sleeper mechanisms. Additionally, this segment produces carpet cushions and hard surface flooring underlayment for residential and commercial markets.
4. Home Furnishings
A healthy housing market is good for furniture demand as more consumers are buying, renting, moving, and renovating. On the other hand, periods of economic weakness or high interest rates discourage home sales and can squelch demand. In addition, home furnishing companies must contend with shifting consumer preferences such as the growing propensity to buy goods online, including big things like mattresses and sofas that were once thought to be immune from e-commerce competition.
Leggett & Platt's primary competitors include Tempur Sealy (NYSE:TPX), Serta Simmons Bedding, Herman Miller (NASDAQ:MLHR), Flexsteel Industries (NASDAQ:FLXS), and private companies L&P Aerospace and Precision Fabrics.
5. Revenue Growth
A company’s long-term sales performance is one signal of its overall quality. Any business can have short-term success, but a top-tier one grows for years. Over the last five years, Leggett & Platt’s demand was weak and its revenue declined by 1.1% per year. This wasn’t a great result and suggests it’s a low quality business.
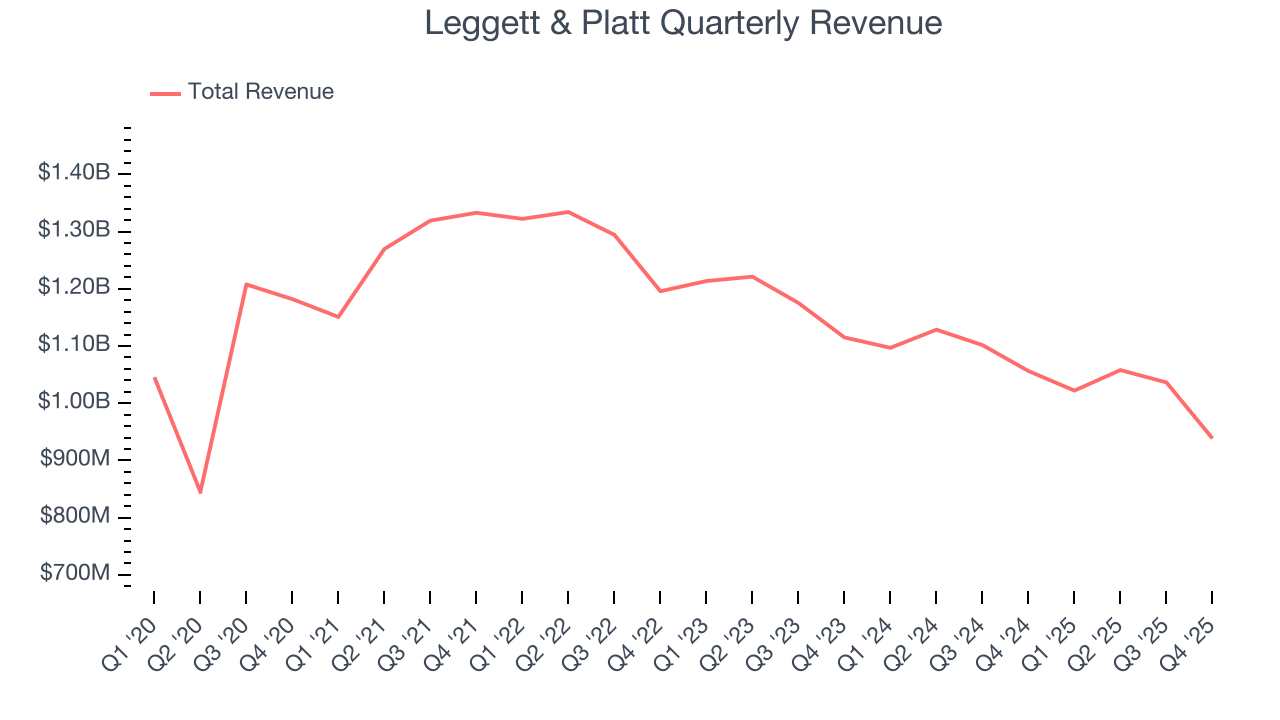
We at StockStory place the most emphasis on long-term growth, but within consumer discretionary, a stretched historical view may miss a company riding a successful new product or trend. Leggett & Platt’s recent performance shows its demand remained suppressed as its revenue has declined by 7.4% annually over the last two years. 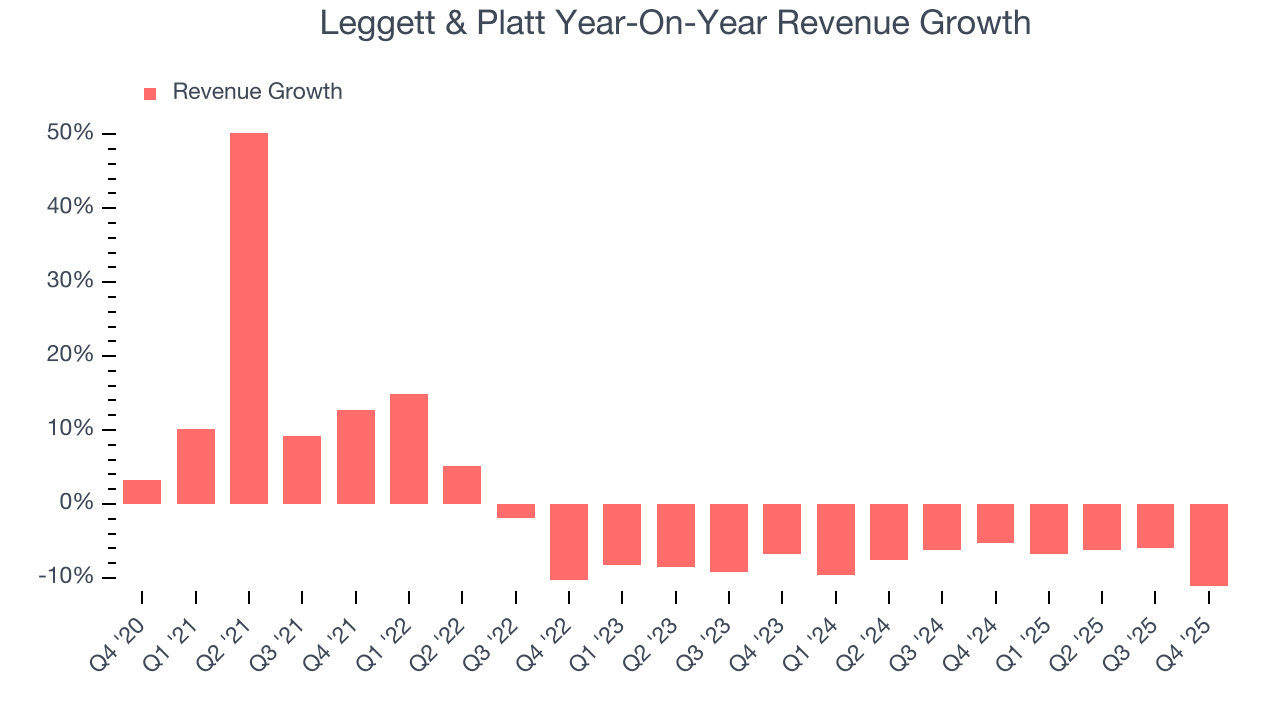
We can dig further into the company’s revenue dynamics by analyzing its three most important segments: Bedding, FF&T, and Specialized Products, which are 39.8%, 25.6%, and 34.5% of revenue. Over the last two years, Leggett & Platt’s Bedding (mattresses and foundations) and FF&T (sofa parts and tiles ) revenues averaged year-on-year declines of 11.7% and 9.3% while its Specialized Products revenue (automobile components) averaged 4.2% growth. 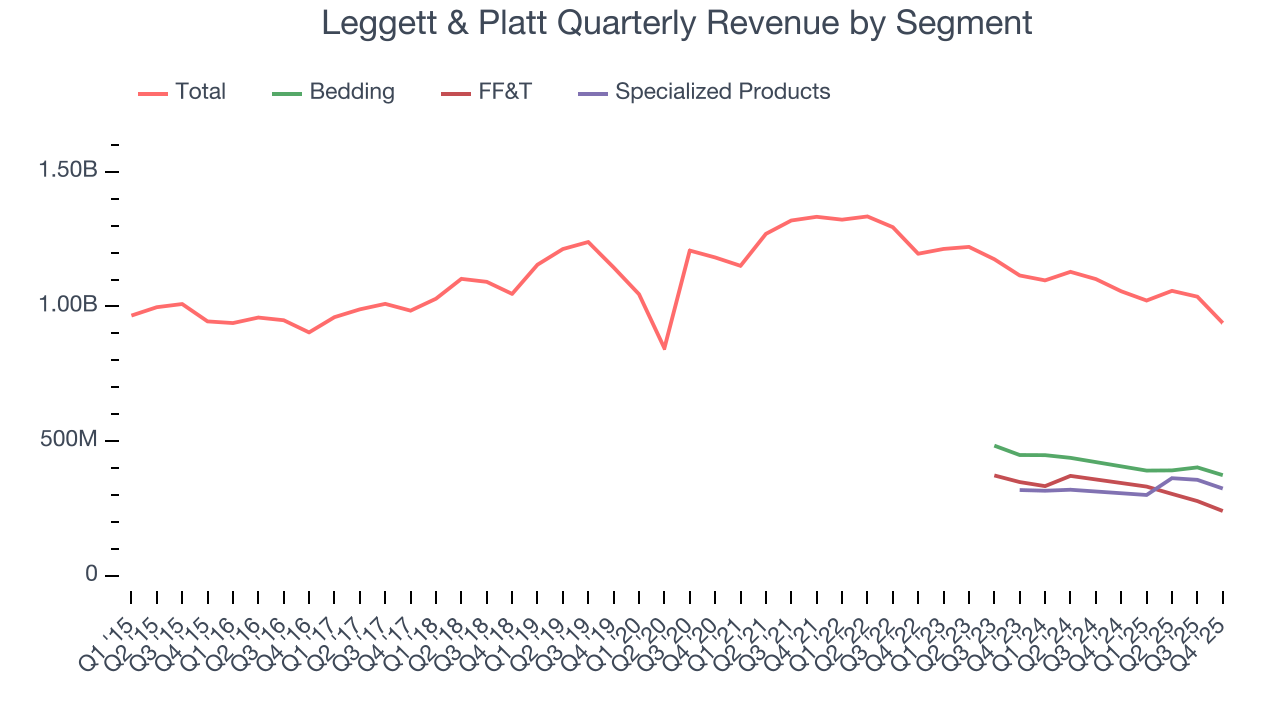
This quarter, Leggett & Platt reported a rather uninspiring 11.2% year-on-year revenue decline to $938.6 million of revenue, in line with Wall Street’s estimates.
Looking ahead, sell-side analysts expect revenue to decline by 3.8% over the next 12 months. While this projection is better than its two-year trend, it’s hard to get excited about a company that is struggling with demand.
6. Operating Margin
Leggett & Platt’s operating margin has been trending up over the last 12 months, leading to break even profits over the last two years. However, its large expense base and inefficient cost structure mean it still sports inadequate profitability for a consumer discretionary business.
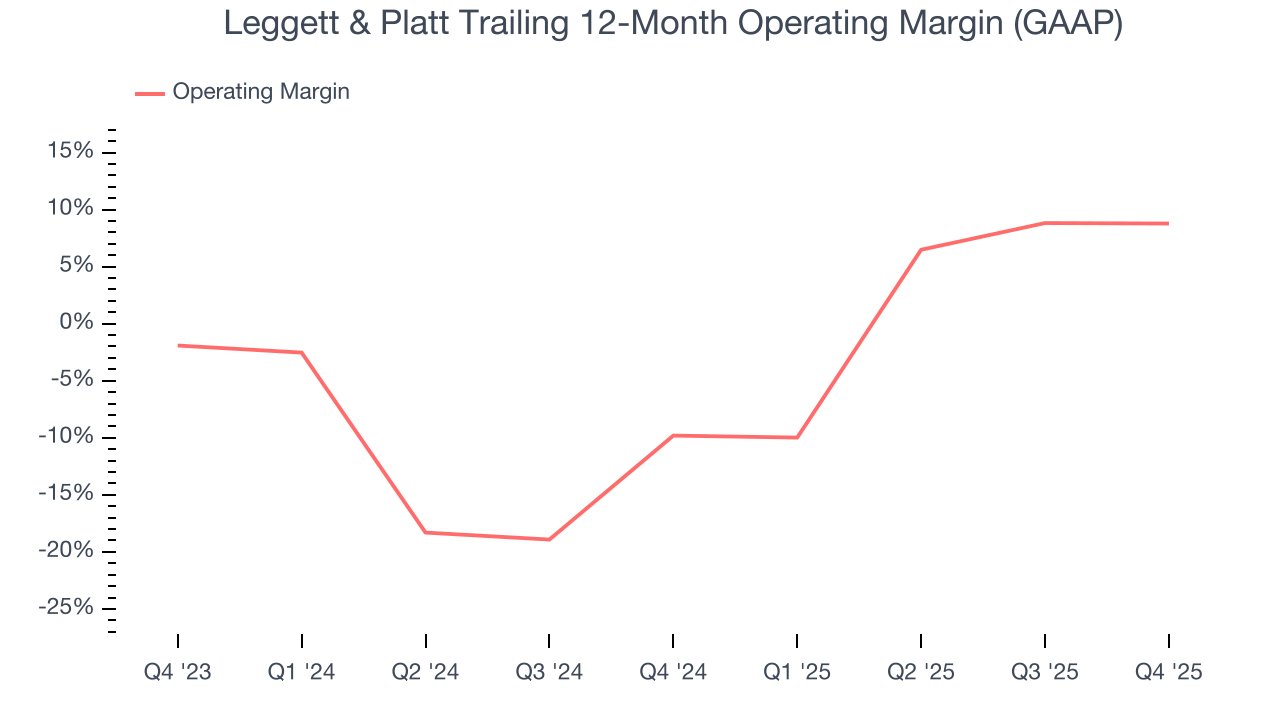
This quarter, Leggett & Platt generated an operating margin profit margin of 3.4%, in line with the same quarter last year. This indicates the company’s overall cost structure has been relatively stable.
7. Earnings Per Share
Revenue trends explain a company’s historical growth, but the long-term change in earnings per share (EPS) points to the profitability of that growth – for example, a company could inflate its sales through excessive spending on advertising and promotions.
Sadly for Leggett & Platt, its EPS and revenue declined by 2.5% and 1.1% annually over the last five years. We tend to steer our readers away from companies with falling revenue and EPS, where diminishing earnings could imply changing secular trends and preferences. Consumer Discretionary companies are particularly exposed to this, and if the tide turns unexpectedly, Leggett & Platt’s low margin of safety could leave its stock price susceptible to large downswings.
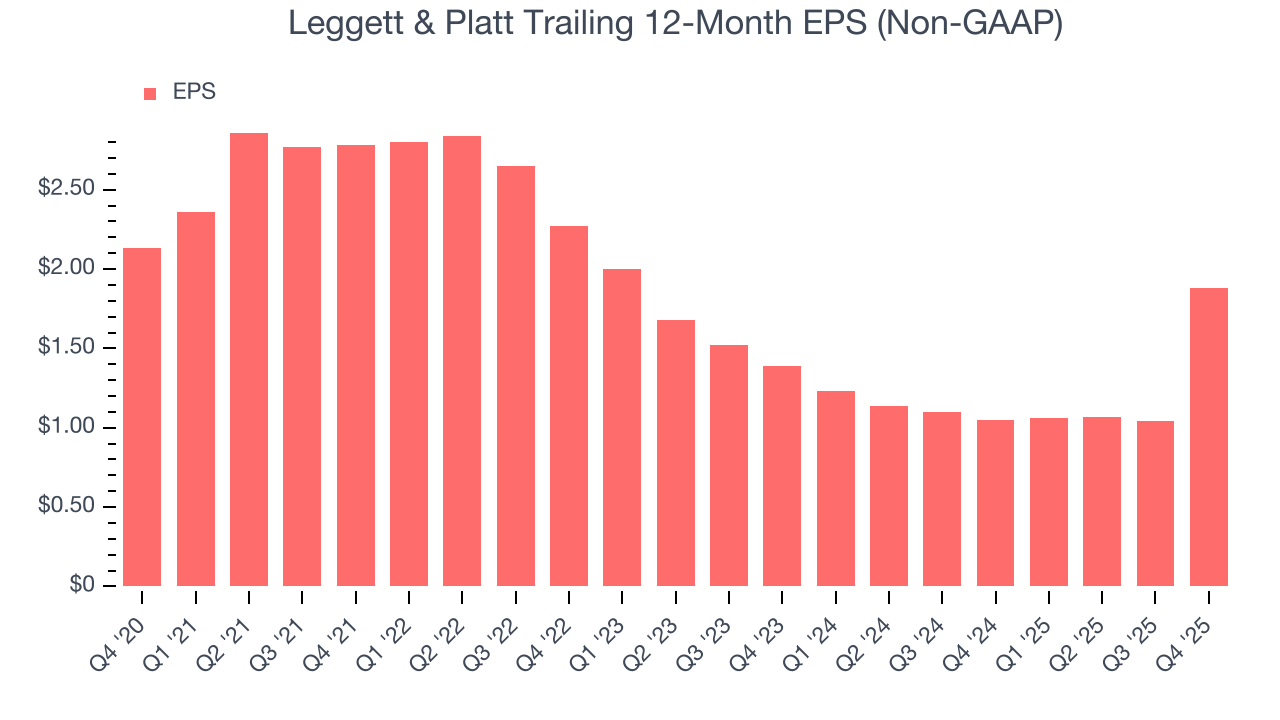
In Q4, Leggett & Platt reported adjusted EPS of $1.05, up from $0.21 in the same quarter last year. This print easily cleared analysts’ estimates, and shareholders should be content with the results. Over the next 12 months, Wall Street expects Leggett & Platt’s full-year EPS of $1.88 to shrink by 42.7%.
8. Cash Is King
Although earnings are undoubtedly valuable for assessing company performance, we believe cash is king because you can’t use accounting profits to pay the bills.
Leggett & Platt has shown poor cash profitability over the last two years, giving the company limited opportunities to return capital to shareholders. Its free cash flow margin averaged 6%, lousy for a consumer discretionary business.
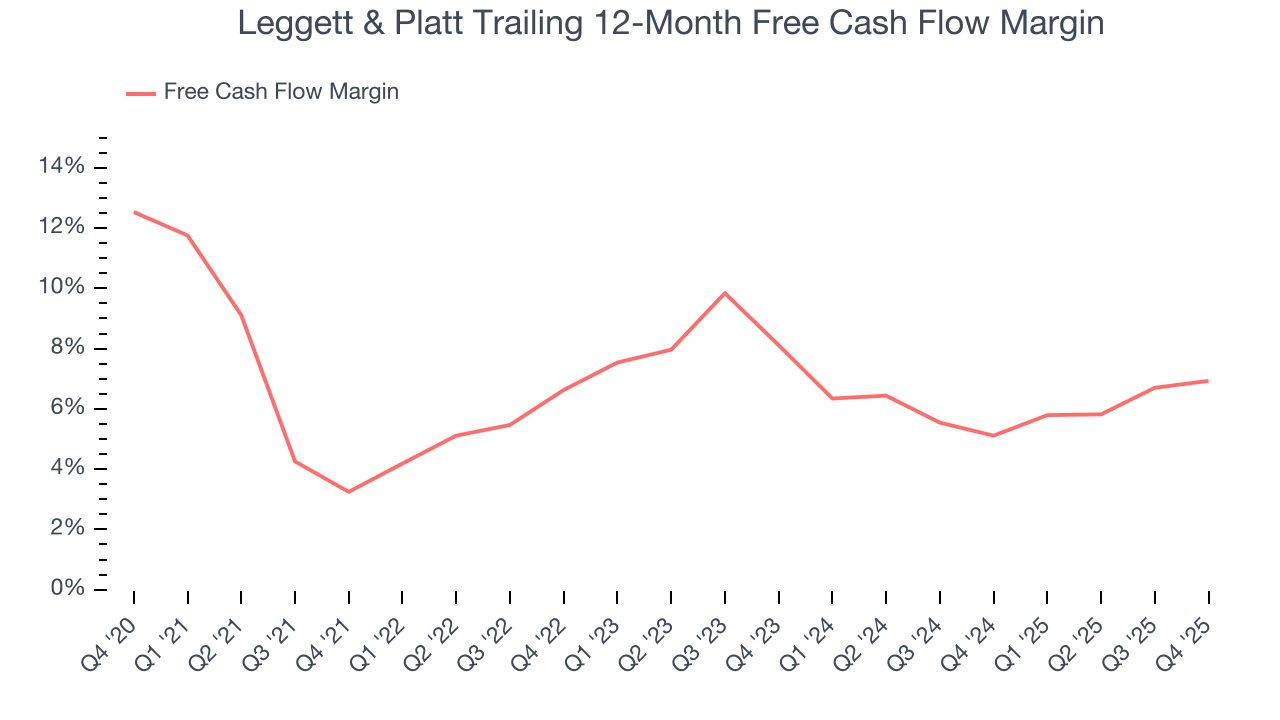
Leggett & Platt’s free cash flow clocked in at $101.9 million in Q4, equivalent to a 10.9% margin. This result was good as its margin was 1.3 percentage points higher than in the same quarter last year, but we wouldn’t read too much into the short term because investment needs can be seasonal, causing temporary swings. Long-term trends carry greater meaning.
9. Return on Invested Capital (ROIC)
EPS and free cash flow tell us whether a company was profitable while growing its revenue. But was it capital-efficient? Enter ROIC, a metric showing how much operating profit a company generates relative to the money it has raised (debt and equity).
Leggett & Platt historically did a mediocre job investing in profitable growth initiatives. Its five-year average ROIC was 3.7%, lower than the typical cost of capital (how much it costs to raise money) for consumer discretionary companies.
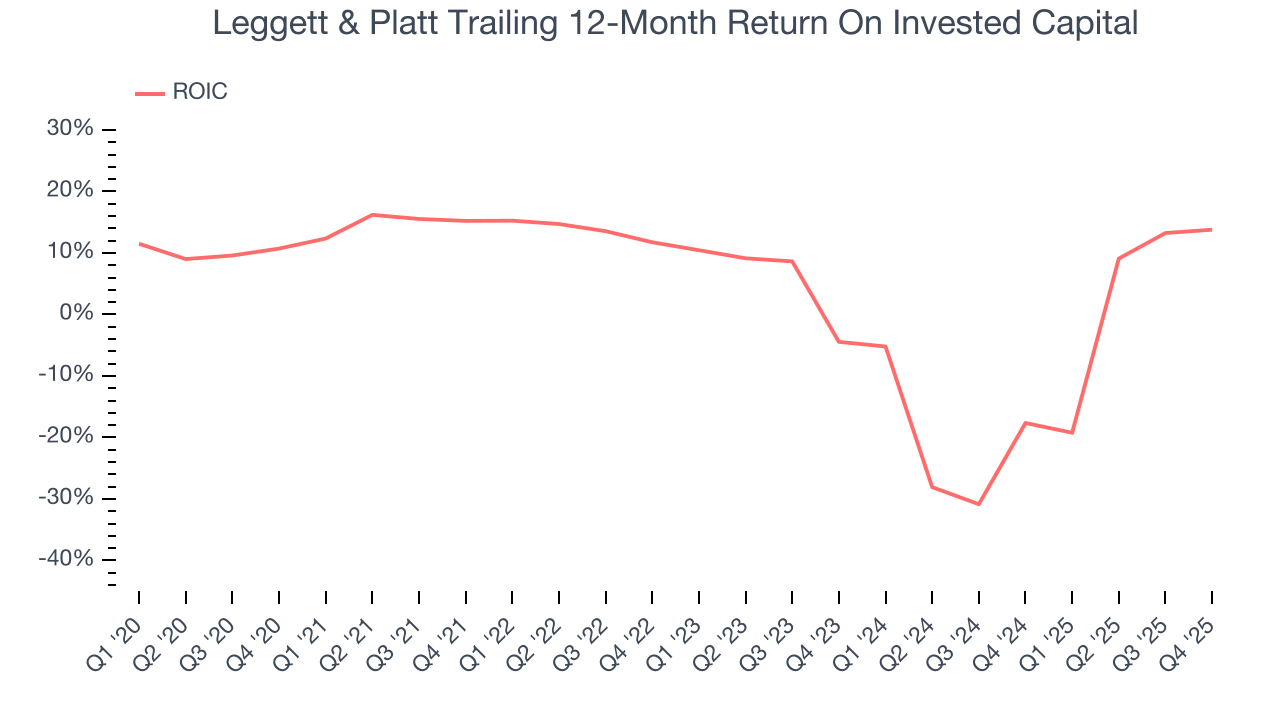
We like to invest in businesses with high returns, but the trend in a company’s ROIC is what often surprises the market and moves the stock price. Over the last few years, Leggett & Platt’s ROIC has unfortunately decreased significantly. Paired with its already low returns, these declines suggest its profitable growth opportunities are few and far between.
10. Balance Sheet Assessment
Leggett & Platt reported $587.4 million of cash and $1.66 billion of debt on its balance sheet in the most recent quarter. As investors in high-quality companies, we primarily focus on two things: 1) that a company’s debt level isn’t too high and 2) that its interest payments are not excessively burdening the business.
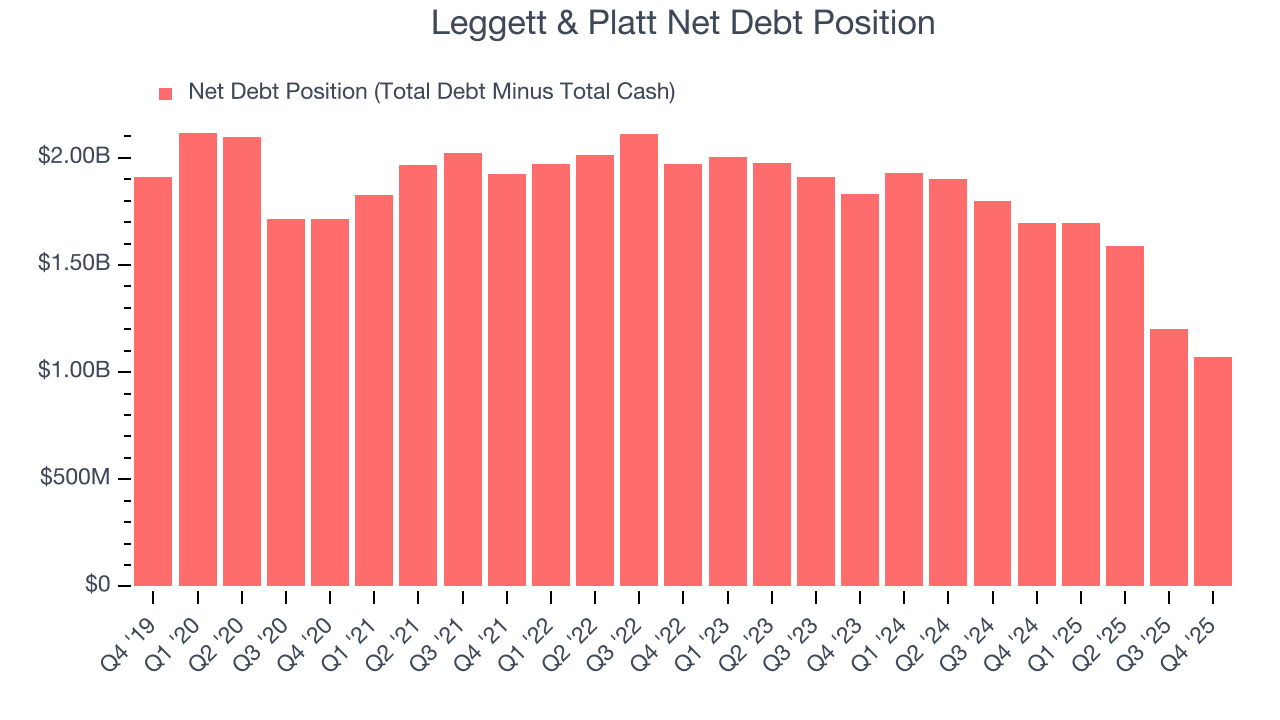
With $385.3 million of EBITDA over the last 12 months, we view Leggett & Platt’s 2.8× net-debt-to-EBITDA ratio as safe. We also see its $40.1 million of annual interest expenses as appropriate. The company’s profits give it plenty of breathing room, allowing it to continue investing in growth initiatives.
11. Key Takeaways from Leggett & Platt’s Q4 Results
It was good to see Leggett & Platt beat analysts’ EPS expectations this quarter. We were also glad its full-year EPS guidance slightly exceeded Wall Street’s estimates. On the other hand, its EBITDA missed. Overall, this print had some key positives. The stock remained flat at $12.40 immediately after reporting.
12. Is Now The Time To Buy Leggett & Platt?
Updated: March 29, 2026 at 11:00 PM EDT
The latest quarterly earnings matters, sure, but we actually think longer-term fundamentals and valuation matter more. Investors should consider all these pieces before deciding whether or not to invest in Leggett & Platt.
Leggett & Platt falls short of our quality standards. On top of that, Leggett & Platt’s declining EPS over the last five years makes it a less attractive asset to the public markets, and its projected EPS for the next year is lacking.
Leggett & Platt’s P/E ratio based on the next 12 months is 9.1x. While this valuation is optically cheap, the potential downside is huge given its shaky fundamentals. There are superior stocks to buy right now.
Wall Street analysts have a consensus one-year price target of $12.50 on the company (compared to the current share price of $9.49).
Although the price target is bullish, readers should exercise caution because analysts tend to be overly optimistic. The firms they work for, often big banks, have relationships with companies that extend into fundraising, M&A advisory, and other rewarding business lines. As a result, they typically hesitate to say bad things for fear they will lose out. We at StockStory do not suffer from such conflicts of interest, so we’ll always tell it like it is.