
Lennox (LII)
We see potential in Lennox. It generates heaps of cash that are reinvested into the business, creating a virtuous cycle of returns.― StockStory Analyst Team
1. News


2. Summary
Why Lennox Is Interesting
Based in Texas and founded over a century ago, Lennox (NYSE:LII) is a climate control solutions company offering heating, ventilation, air conditioning, and refrigeration (HVACR) goods.
- ROIC punches in at 48.7%, illustrating management’s expertise in identifying profitable investments
- Additional sales over the last five years increased its profitability as the 17.9% annual growth in its earnings per share outpaced its revenue
- One pitfall is its organic revenue growth fell short of our benchmarks over the past two years and implies it may need to improve its products, pricing, or go-to-market strategy


Lennox is solid, but not perfect. If you believe in the company, the price looks fair.
Why Is Now The Time To Buy Lennox?


Lennox is trading at $479.98 per share, or 20x forward P/E. Lennox’s current valuation is below that of most industrials companies, but this doesn’t make it a bargain. Instead, the price is warranted for the quality you get.
Now could be a good time to invest if you believe in the story.
3. Lennox (LII) Research Report: Q4 CY2025 Update
Climate control solutions innovator Lennox International (NYSE:LII) missed Wall Street’s revenue expectations in Q4 CY2025, with sales falling 11.2% year on year to $1.20 billion. Its non-GAAP profit of $4.45 per share was 5.7% below analysts’ consensus estimates.
Lennox (LII) Q4 CY2025 Highlights:
- Revenue: $1.20 billion vs analyst estimates of $1.27 billion (11.2% year-on-year decline, 5.7% miss)
- Adjusted EPS: $4.45 vs analyst expectations of $4.72 (5.7% miss)
- Adjusted EBITDA: $237.2 million vs analyst estimates of $249.3 million (19.8% margin, 4.9% miss)
- Adjusted EPS guidance for the upcoming financial year 2026 is $24.25 at the midpoint, missing analyst estimates by 1.1%
- Operating Margin: 16.4%, down from 18.2% in the same quarter last year
- Free Cash Flow Margin: 31.5%, up from 20.2% in the same quarter last year
- Organic Revenue fell 11% year on year (miss)
- Market Capitalization: $17.49 billion
Company Overview
Based in Texas and founded over a century ago, Lennox (NYSE:LII) is a climate control solutions company offering heating, ventilation, air conditioning, and refrigeration (HVACR) goods.
The company has since evolved into a major player in the heating, ventilation, air conditioning, and refrigeration (HVACR) markets, known for its innovation, quality, and reliability. LII operates through three primary business segments: Home Comfort Solutions (formerly Residential Heating & Cooling), Building Climate Solutions (formerly Commercial Heating & Cooling), and Corporate and Other.
The Home Comfort Solutions segment is the largest contributor to LII's revenue, focusing on residential heating and cooling products. This segment offers a line of furnaces, air conditioners, heat pumps, packaged heating and cooling systems, and indoor air quality equipment. The company employs multiple distribution channels, including direct sales to independent dealers, company-owned Lennox Stores, and sales through independent wholesale distributors.
The Building Climate Solutions segment caters to the commercial HVAC and refrigeration markets. This segment manufactures and sells unitary heating and air conditioning equipment, applied systems, controls, and refrigeration products. LII's offerings in this segment range from rooftop units and split systems for light commercial applications to more complex systems for larger commercial buildings. The segment also includes National Account Services, which provides installation and maintenance services for commercial HVAC national account customers.
LII's revenue structure is primarily based on the sale of its HVACR products and related services. The company's sales tend to be seasonally higher in the second and third quarters due to the peak demand for air conditioning equipment in the U.S. and Canada during summer months.
Notable recent acquisitions were that of AES Industries, Inc. and AES Mechanical Service Group, Inc. in October 2023. This acquisition brought additional manufacturing and service capabilities in the light commercial markets, enhancing LII's offerings in curbs, curb adapters, and HVAC recycling services.
4. HVAC and Water Systems
Many HVAC and water systems companies sell essential, non-discretionary infrastructure for buildings. Since the useful lives of these water heaters and vents are fairly standard, these companies have a portion of predictable replacement revenue. In the last decade, trends in energy efficiency and clean water are driving innovation that is leading to incremental demand. On the other hand, new installations for these companies are at the whim of residential and commercial construction volumes, which tend to be cyclical and can be impacted heavily by economic factors such as interest rates.
Other companies offering heating, ventilation, air conditioning, and refrigeration (HVACR) goods include Carrier Global (NYSE:CARR), Trane Technologies (NYSE:TT), and Johnson Controls International (NYSE:JCI)
5. Revenue Growth
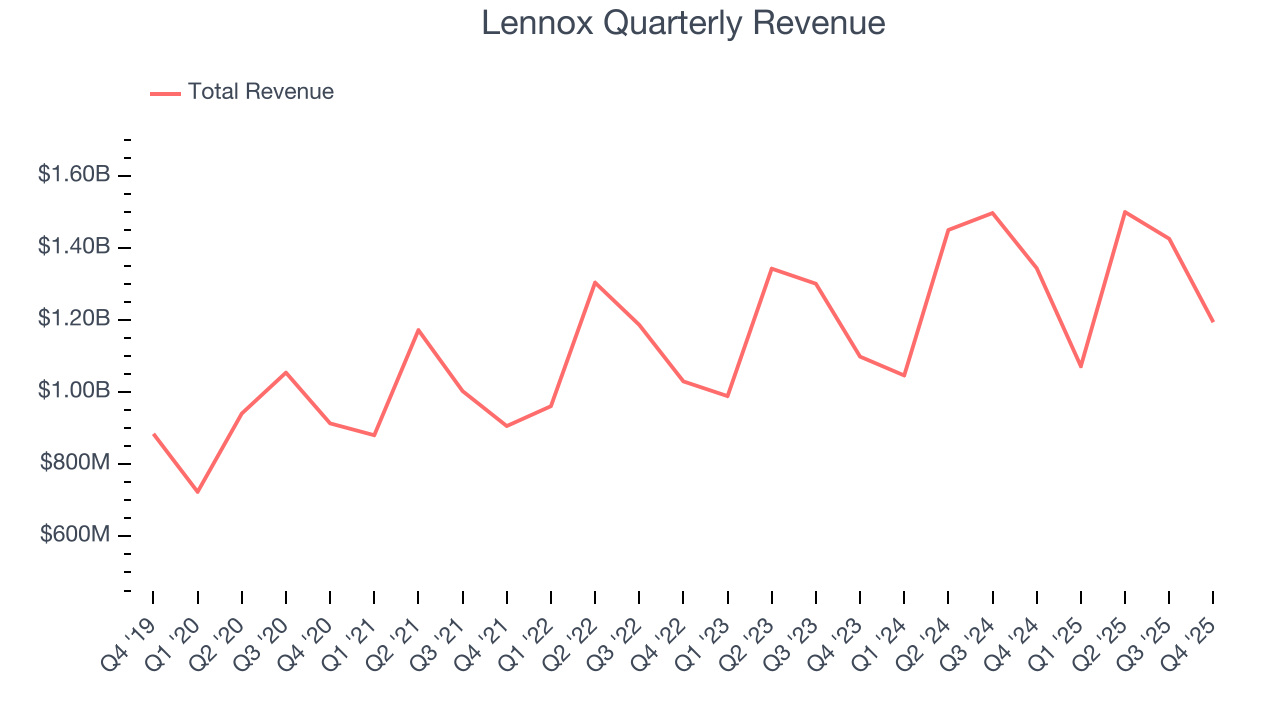
Reviewing a company’s long-term sales performance reveals insights into its quality. Any business can put up a good quarter or two, but the best consistently grow over the long haul. Unfortunately, Lennox’s 7.4% annualized revenue growth over the last five years was mediocre. This wasn’t a great result compared to the rest of the industrials sector, but there are still things to like about Lennox.
We at StockStory place the most emphasis on long-term growth, but within industrials, a half-decade historical view may miss cycles, industry trends, or a company capitalizing on catalysts such as a new contract win or a successful product line. Lennox’s recent performance shows its demand has slowed as its annualized revenue growth of 4.8% over the last two years was below its five-year trend. 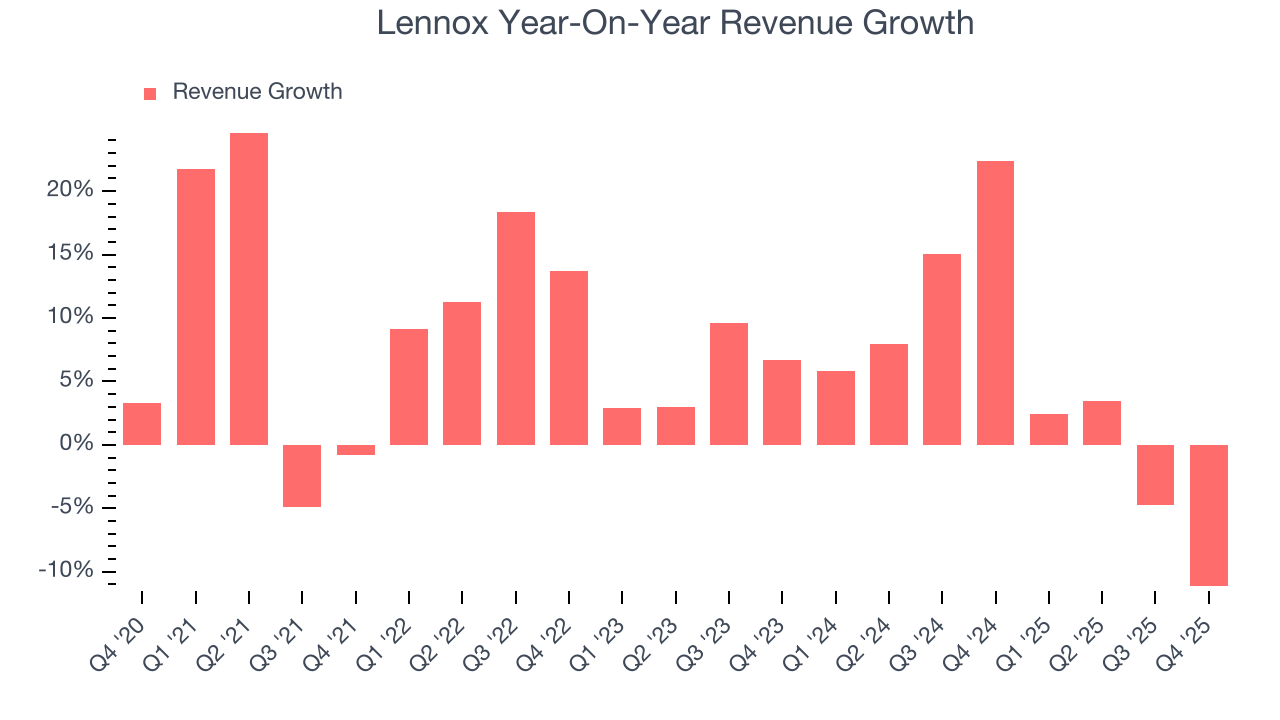
We can dig further into the company’s sales dynamics by analyzing its organic revenue, which strips out one-time events like acquisitions and currency fluctuations that don’t accurately reflect its fundamentals. Over the last two years, Lennox’s organic revenue averaged 4.3% year-on-year growth. Because this number aligns with its two-year revenue growth, we can see the company’s core operations (not acquisitions and divestitures) drove most of its results. 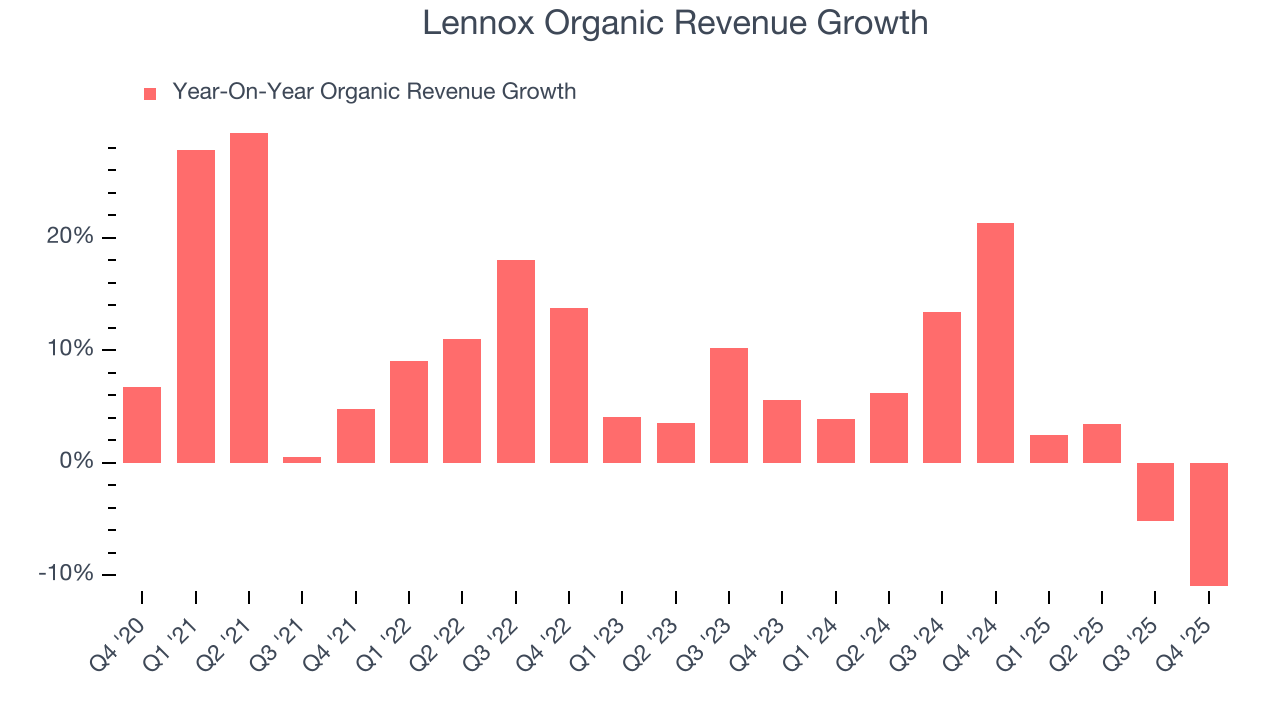
This quarter, Lennox missed Wall Street’s estimates and reported a rather uninspiring 11.2% year-on-year revenue decline, generating $1.20 billion of revenue.
Looking ahead, sell-side analysts expect revenue to grow 8.6% over the next 12 months, an improvement versus the last two years. This projection is above the sector average and suggests its newer products and services will catalyze better top-line performance.
6. Gross Margin & Pricing Power
At StockStory, we prefer high gross margin businesses because they indicate the company has pricing power or differentiated products, giving it a chance to generate higher operating profits.
Lennox’s gross margin is slightly below the average industrials company, giving it less room to invest in areas such as research and development. As you can see below, it averaged a 28.6% gross margin over the last five years. That means Lennox paid its suppliers a lot of money ($71.37 for every $100 in revenue) to run its business. 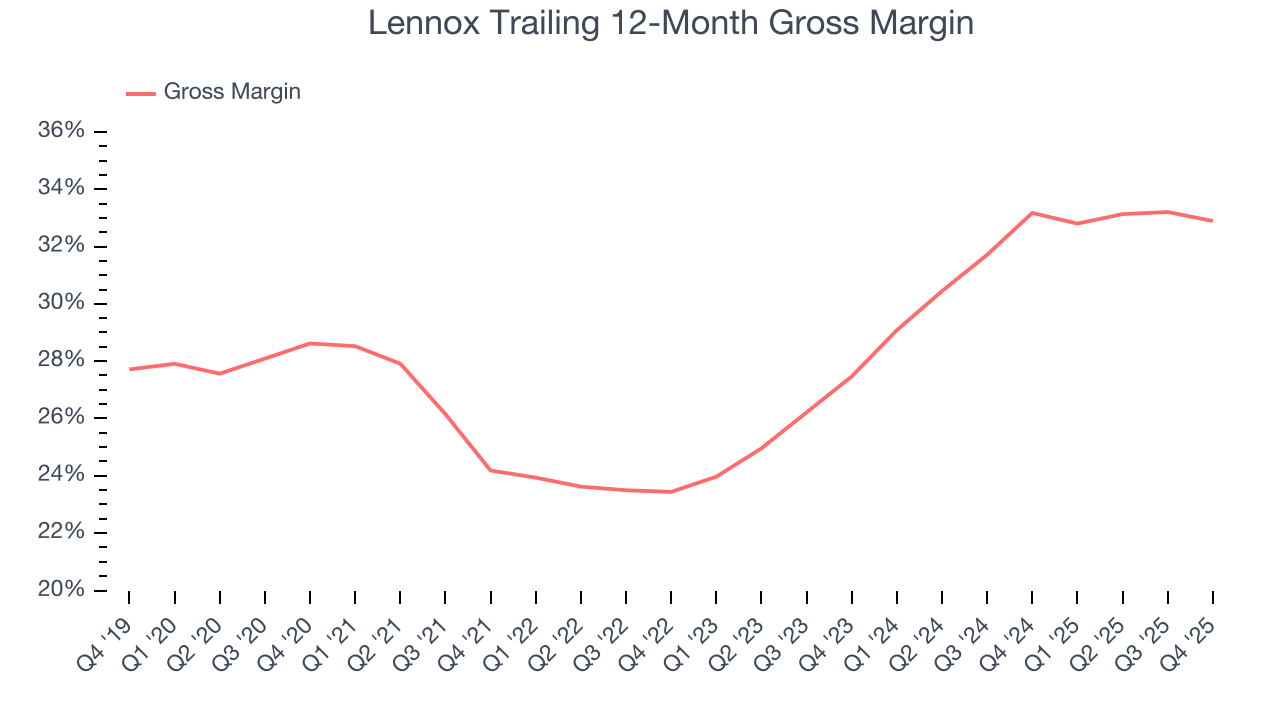
This quarter, Lennox’s gross profit margin was 32.6%, down 1.3 percentage points year on year. Zooming out, the company’s full-year margin has remained steady over the past 12 months, suggesting its input costs (such as raw materials and manufacturing expenses) have been stable and it isn’t under pressure to lower prices.
7. Operating Margin
Lennox has been a well-oiled machine over the last five years. It demonstrated elite profitability for an industrials business, boasting an average operating margin of 17.2%. This result was particularly impressive because of its low gross margin, which is mostly a factor of what it sells and takes huge shifts to move meaningfully. Companies have more control over their operating margins, and it’s a show of well-managed operations if they’re high when gross margins are low.
Analyzing the trend in its profitability, Lennox’s operating margin rose by 4.7 percentage points over the last five years, as its sales growth gave it operating leverage.
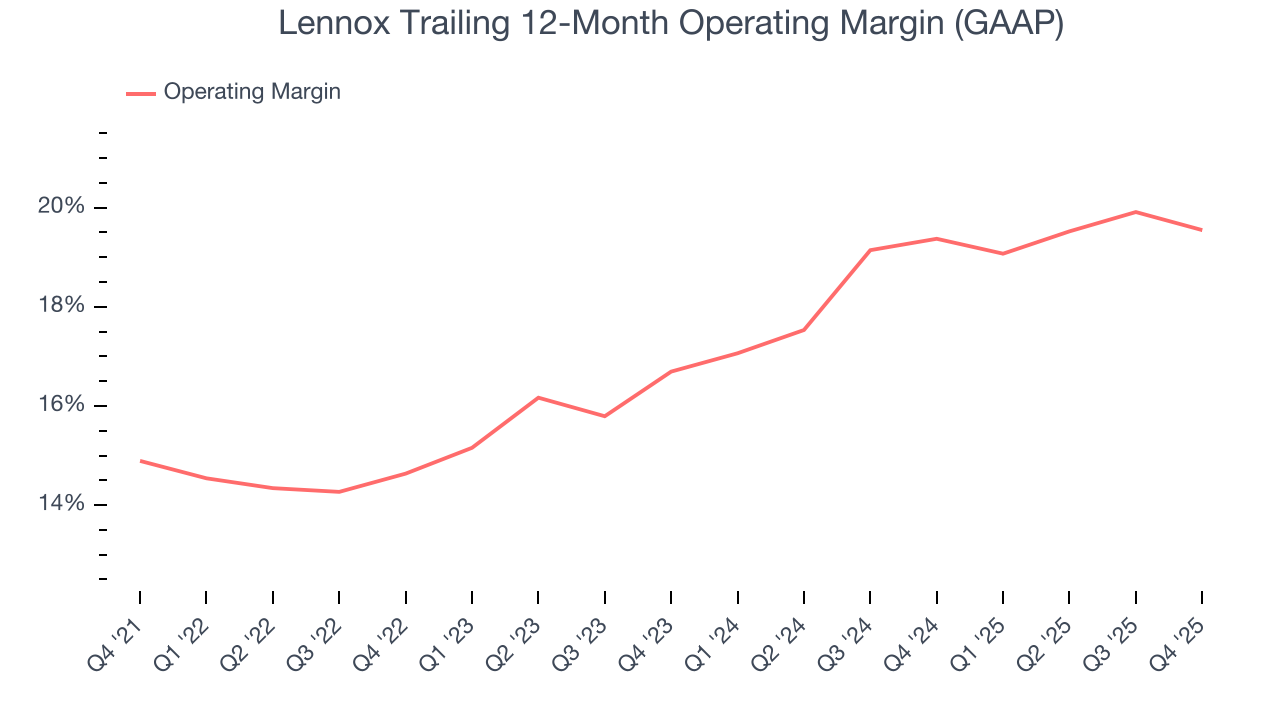
In Q4, Lennox generated an operating margin profit margin of 16.4%, down 1.8 percentage points year on year. Since Lennox’s operating margin decreased more than its gross margin, we can assume it was less efficient because expenses such as marketing, R&D, and administrative overhead increased.
8. Earnings Per Share
Revenue trends explain a company’s historical growth, but the long-term change in earnings per share (EPS) points to the profitability of that growth – for example, a company could inflate its sales through excessive spending on advertising and promotions.
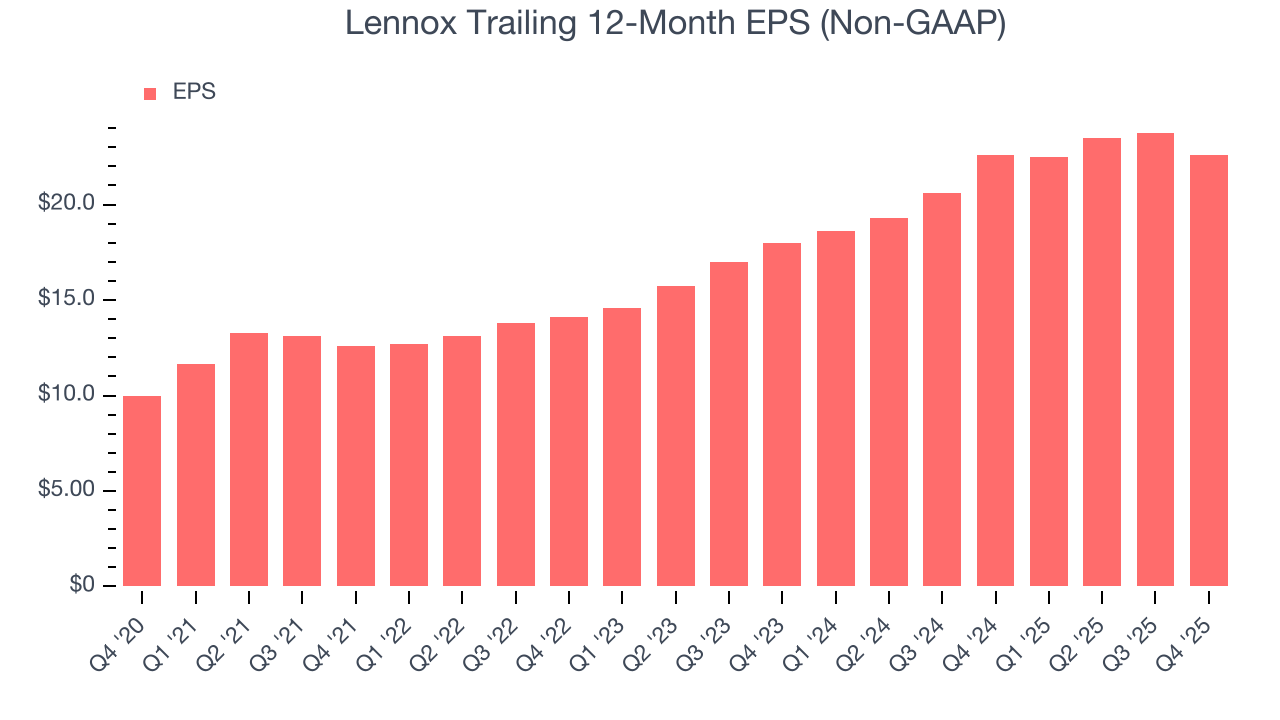
Lennox’s EPS grew at an astounding 17.9% compounded annual growth rate over the last five years, higher than its 7.4% annualized revenue growth. This tells us the company became more profitable on a per-share basis as it expanded.
Diving into the nuances of Lennox’s earnings can give us a better understanding of its performance. As we mentioned earlier, Lennox’s operating margin declined this quarter but expanded by 4.7 percentage points over the last five years. Its share count also shrank by 9.1%, and these factors together are positive signs for shareholders because improving profitability and share buybacks turbocharge EPS growth relative to revenue growth. 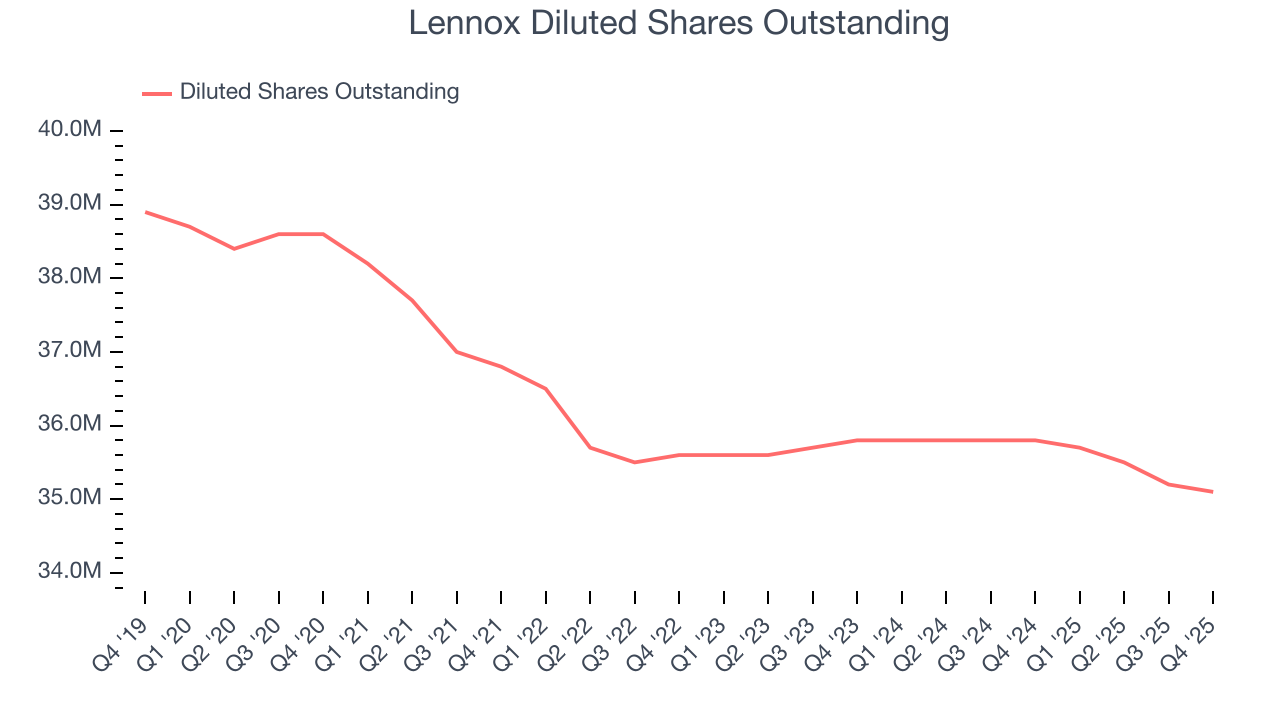
Like with revenue, we analyze EPS over a more recent period because it can provide insight into an emerging theme or development for the business.
For Lennox, its two-year annual EPS growth of 12.2% was lower than its five-year trend. We still think its growth was good and hope it can accelerate in the future.
In Q4, Lennox reported adjusted EPS of $4.45, down from $5.60 in the same quarter last year. This print missed analysts’ estimates, but we care more about long-term adjusted EPS growth than short-term movements. Over the next 12 months, Wall Street expects Lennox’s full-year EPS of $22.62 to grow 7.7%.
9. Cash Is King
Free cash flow isn't a prominently featured metric in company financials and earnings releases, but we think it's telling because it accounts for all operating and capital expenses, making it tough to manipulate. Cash is king.
Lennox has shown robust cash profitability, enabling it to comfortably ride out cyclical downturns while investing in plenty of new offerings and returning capital to investors. The company’s free cash flow margin averaged 10.6% over the last five years, quite impressive for an industrials business.
Taking a step back, we can see that Lennox’s margin expanded by 2 percentage points during that time. This is encouraging because it gives the company more optionality.
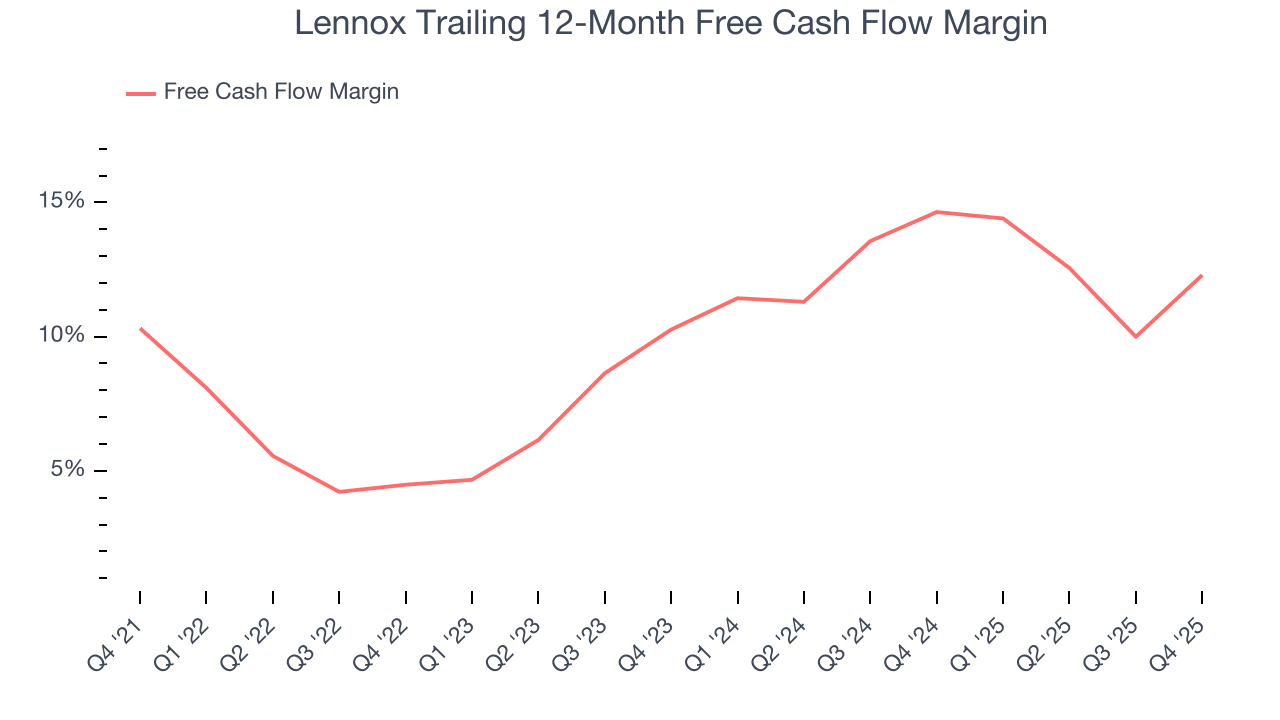
Lennox’s free cash flow clocked in at $376.7 million in Q4, equivalent to a 31.5% margin. This result was good as its margin was 11.3 percentage points higher than in the same quarter last year, building on its favorable historical trend.
10. Return on Invested Capital (ROIC)
EPS and free cash flow tell us whether a company was profitable while growing its revenue. But was it capital-efficient? A company’s ROIC explains this by showing how much operating profit it makes compared to the money it has raised (debt and equity).
Lennox’s five-year average ROIC was 48.9%, placing it among the best industrials companies. This illustrates its management team’s ability to invest in highly profitable ventures and produce tangible results for shareholders.
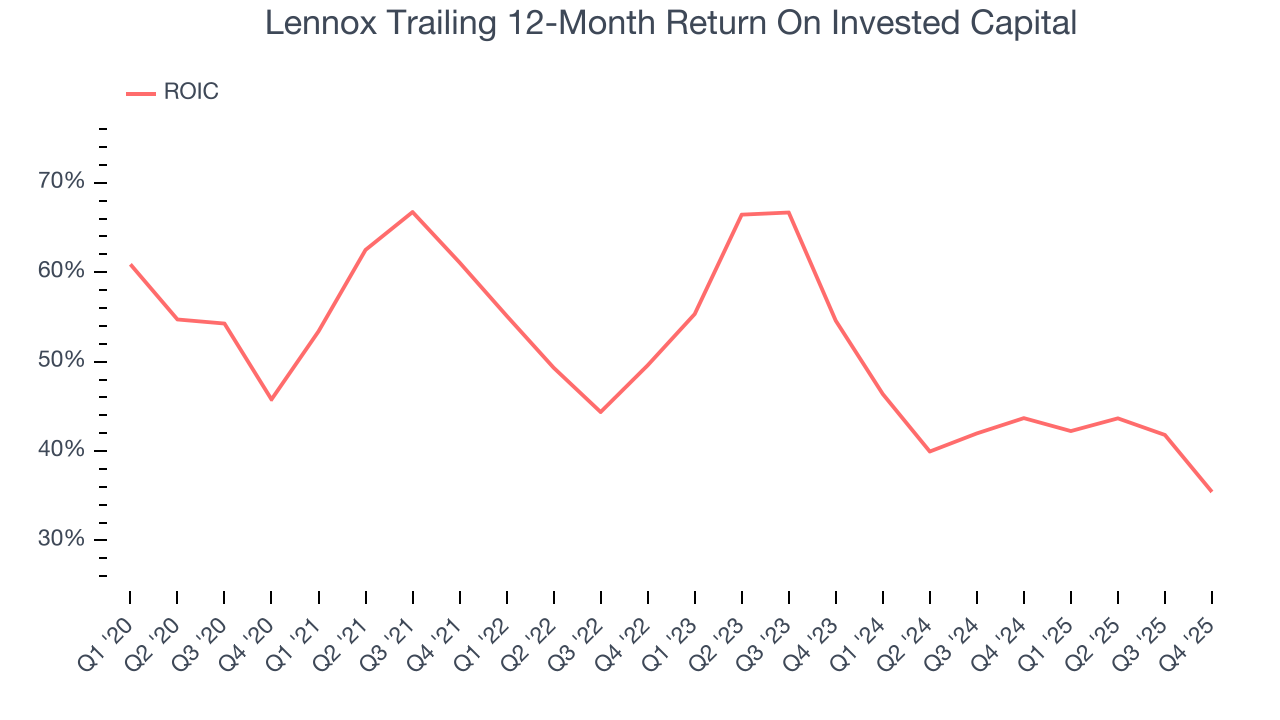
We like to invest in businesses with high returns, but the trend in a company’s ROIC is what often surprises the market and moves the stock price. Unfortunately, Lennox’s ROIC has decreased significantly over the last few years. Only time will tell if its new bets can bear fruit and potentially reverse the trend.
11. Balance Sheet Assessment
Lennox reported $34.7 million of cash and $1.77 billion of debt on its balance sheet in the most recent quarter. As investors in high-quality companies, we primarily focus on two things: 1) that a company’s debt level isn’t too high and 2) that its interest payments are not excessively burdening the business.
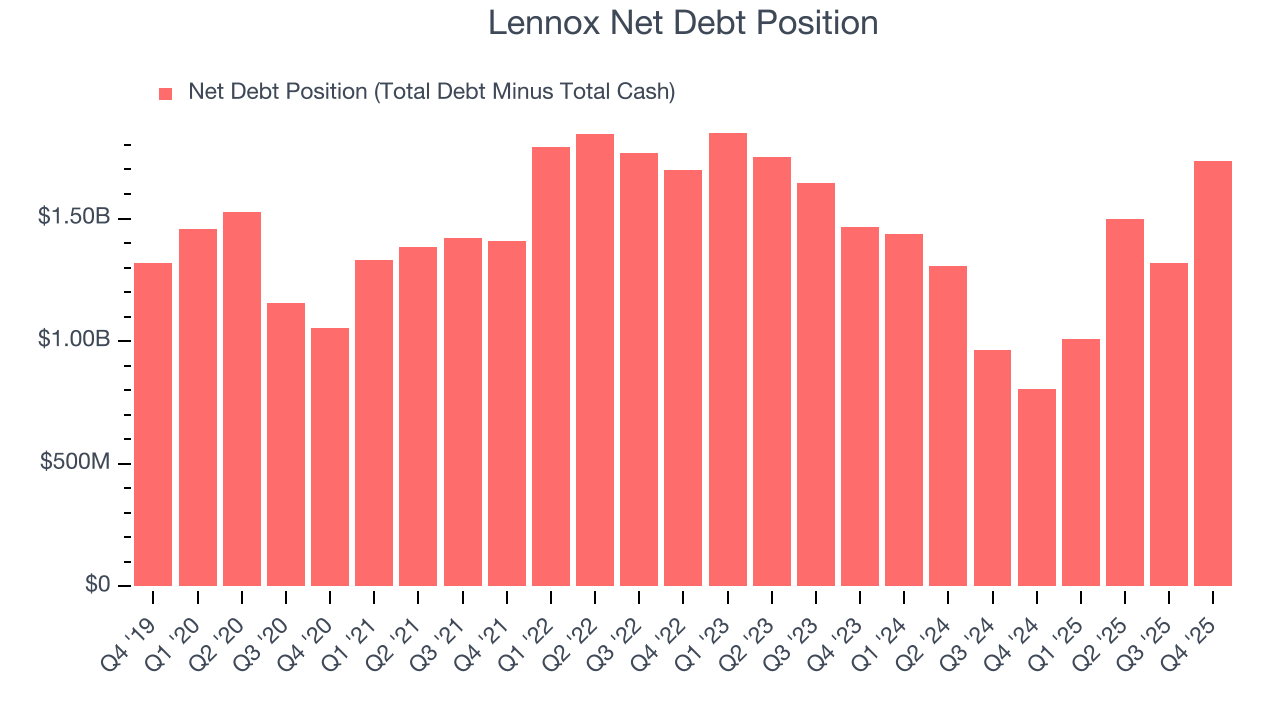
With $1.14 billion of EBITDA over the last 12 months, we view Lennox’s 1.5× net-debt-to-EBITDA ratio as safe. We also see its $9.1 million of annual interest expenses as appropriate. The company’s profits give it plenty of breathing room, allowing it to continue investing in growth initiatives.
12. Key Takeaways from Lennox’s Q4 Results
We struggled to find many positives in these results. Its revenue missed and its EPS fell short of Wall Street’s estimates. Overall, this was a softer quarter. The stock traded down 3.8% to $480 immediately after reporting.
13. Is Now The Time To Buy Lennox?
Updated: March 15, 2026 at 11:35 PM EDT
A common mistake we notice when investors are deciding whether to buy a stock or not is that they simply look at the latest earnings results. Business quality and valuation matter more, so we urge you to understand these dynamics as well.
There are things to like about Lennox. Although its revenue growth was mediocre over the last five years and analysts expect growth to slow over the next 12 months, its expanding operating margin shows the business has become more efficient. And while its diminishing returns show management's recent bets still have yet to bear fruit, its astounding EPS growth over the last five years shows its profits are trickling down to shareholders.
Lennox’s P/E ratio based on the next 12 months is 20x. Looking at the industrials space right now, Lennox trades at a compelling valuation. If you trust the business and its direction, this is an ideal time to buy.
Wall Street analysts have a consensus one-year price target of $562.44 on the company (compared to the current share price of $479.98), implying they see 17.2% upside in buying Lennox in the short term.