
Lincoln Financial Group (LNC)
We’re skeptical of Lincoln Financial Group. Its low returns on capital and plummeting sales suggest it struggles to generate demand and profits, a red flag.― StockStory Analyst Team
1. News


2. Summary
Why We Think Lincoln Financial Group Will Underperform
Founded in 1905 by a group of Fort Wayne, Indiana businessmen who named the company after Abraham Lincoln, Lincoln National Corporation (NYSE:LNC) provides insurance, retirement plans, and wealth management products through its subsidiaries, operating under four main segments: Annuities, Life Insurance, Group Protection, and Retirement Plan Services.
- Products and services are facing significant credit quality challenges during this cycle as book value per share has declined by 15.1% annually over the last five years
- Net premiums earned plateaued over the last five years, signaling weak incremental demand for its insurance policies
- On the plus side, its exciting book value per share outlook for the upcoming 12 months calls for 50.4% growth, an acceleration from its two-year trend


Lincoln Financial Group falls below our quality standards. We’re hunting for superior stocks elsewhere.
Why There Are Better Opportunities Than Lincoln Financial Group


Lincoln Financial Group’s stock price of $34.17 implies a valuation ratio of 0.6x forward P/B. Lincoln Financial Group’s valuation may seem like a great deal, but we think there are valid reasons why it’s so cheap.
It’s better to pay up for high-quality businesses with higher long-term earnings potential rather than to buy lower-quality stocks because they appear cheap. These challenged businesses often don’t re-rate, a phenomenon known as a “value trap”.
3. Lincoln Financial Group (LNC) Research Report: Q4 CY2025 Update
Insurance and retirement company Lincoln National (NYSE:LNC) beat Wall Street’s revenue expectations in Q4 CY2025, with sales up 6.4% year on year to $4.92 billion. Its non-GAAP profit of $2.21 per share was 16.5% above analysts’ consensus estimates.
Lincoln Financial Group (LNC) Q4 CY2025 Highlights:
- Revenue: $4.92 billion vs analyst estimates of $4.83 billion (6.4% year-on-year growth, 1.9% beat)
- Pre-tax Profit: $445 million (9% margin)
- Adjusted EPS: $2.21 vs analyst estimates of $1.90 (16.5% beat)
- Book Value per Share: $51.88 vs analyst estimates of $70.51 (21.4% year-on-year growth, 26.4% miss)
- Market Capitalization: $7.32 billion
Company Overview
Founded in 1905 by a group of Fort Wayne, Indiana businessmen who named the company after Abraham Lincoln, Lincoln National Corporation (NYSE:LNC) provides insurance, retirement plans, and wealth management products through its subsidiaries, operating under four main segments: Annuities, Life Insurance, Group Protection, and Retirement Plan Services.
Lincoln National operates through four primary business segments. The Annuities segment offers tax-deferred investment growth and lifetime income opportunities through variable, fixed, and indexed variable annuities (also called registered index-linked annuities or RILAs). These products feature various guarantee options and riders that provide income security while allowing customers to participate in market growth.
The Life Insurance segment focuses on wealth creation and protection through term life insurance, universal life insurance (UL), indexed universal life (IUL), and variable universal life (VUL) products. Many policies include secondary guarantees that keep coverage in force even if cash value drops to zero, provided certain requirements are met. The company also offers linked-benefit products combining life insurance with long-term care coverage.
The Group Protection segment serves employers with non-medical insurance products including disability insurance, absence management services, life insurance, dental and vision coverage, and supplemental health solutions like accident, critical illness, and hospital indemnity insurance. These products are marketed to companies of all sizes, from small businesses to large corporations.
The Retirement Plan Services segment provides employers with retirement plan solutions, primarily in the defined contribution marketplace. Products include the LINCOLN DIRECTOR group variable annuity for small businesses, the LINCOLN ALLIANCE program for mid-to-large employers, and Multi-Fund variable annuity for healthcare, education, and non-profit organizations. Services include plan recordkeeping, compliance testing, participant education, and trust services.
Lincoln Financial distributes its products through a network of financial intermediaries, including wirehouses, independent planners, financial institutions, and managing general agents. For group benefits, the company works through employee benefit brokers and consultants.
4. Life Insurance
Life insurance companies collect premiums from policyholders in exchange for providing a future death benefit or retirement income stream. Interest rates matter for the sector (and make it cyclical), with higher rates allowing insurers to reinvest their fixed-income portfolios at more attractive yields and vice versa. Additionally, favorable demographic shifts, such as an aging population, are driving strong demand for retirement products while AI and data analytics offer significant opportunities to improve underwriting accuracy and operational efficiency. Conversely, the industry faces headwinds from persistent competition from agile insurtechs that threaten traditional distribution models.
Lincoln National's competitors include major insurance and financial services companies such as Prudential Financial (NYSE:PRU), MetLife (NYSE:MET), Principal Financial Group (NASDAQ:PFG), and Equitable Holdings (NYSE:EQH). In the retirement plan services space, it also competes with Vanguard, Fidelity, and TIAA.
5. Revenue Growth
Insurance companies generate revenue three ways. The first is the core insurance business itself, represented in the income statement as premiums earned. The second source is investment income from investing the “float” (premiums collected but not yet paid out as claims) in assets such as fixed-income assets and equities. The third is fees from policy administration, annuities, and other value-added services. Over the last five years, Lincoln Financial Group grew its revenue at a weak 1% compounded annual growth rate. This was below our standards and is a tough starting point for our analysis.
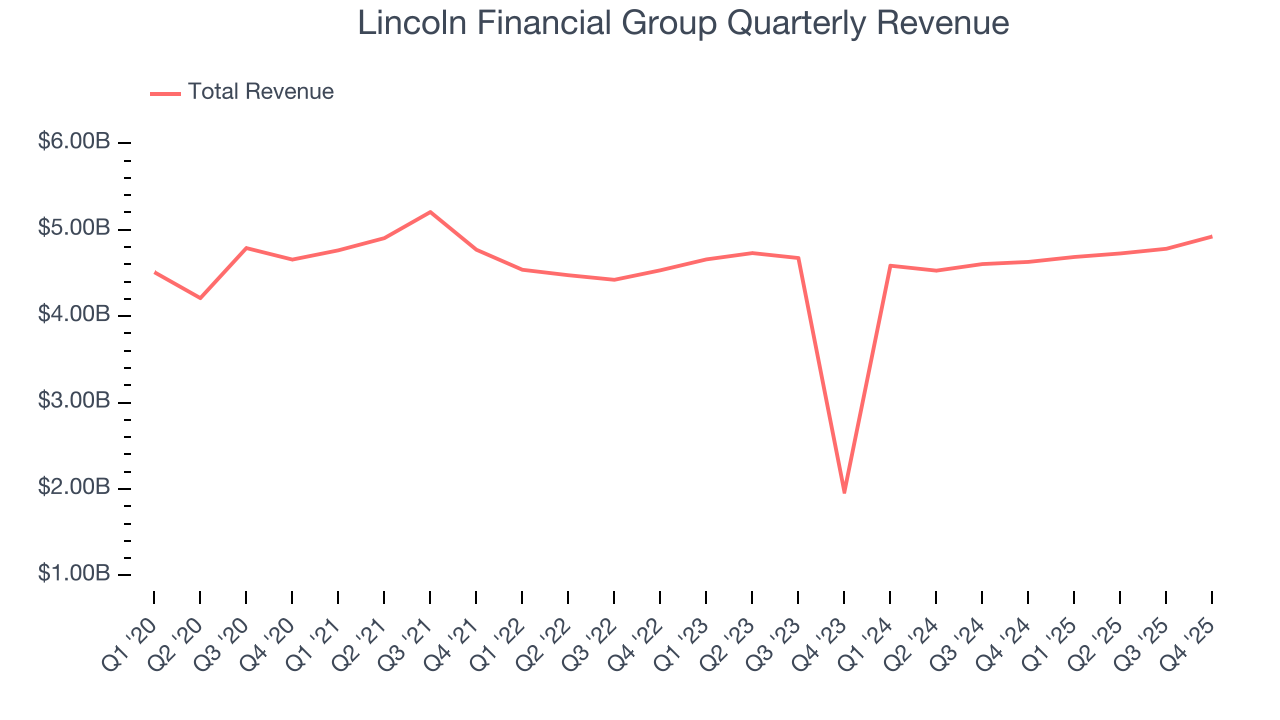
Long-term growth is the most important, but within financials, a half-decade historical view may miss recent interest rate changes and market returns. Lincoln Financial Group’s annualized revenue growth of 9.2% over the last two years is above its five-year trend, suggesting its demand recently accelerated. 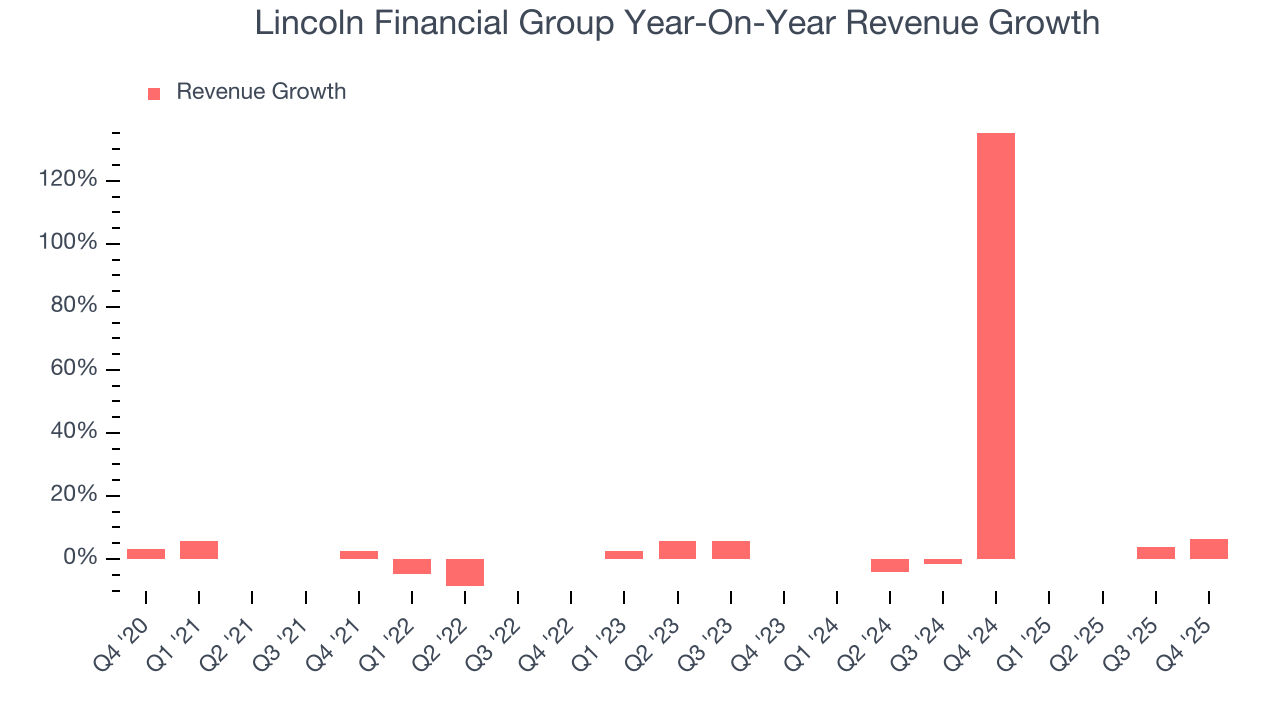 Note: Quarters not shown were determined to be outliers, impacted by outsized investment gains/losses that are not indicative of the recurring fundamentals of the business.
This quarter, Lincoln Financial Group reported year-on-year revenue growth of 6.4%, and its $4.92 billion of revenue exceeded Wall Street’s estimates by 1.9%.
Net premiums earned made up 63% of the company’s total revenue during the last five years, meaning insurance operations are Lincoln Financial Group’s largest source of revenue.
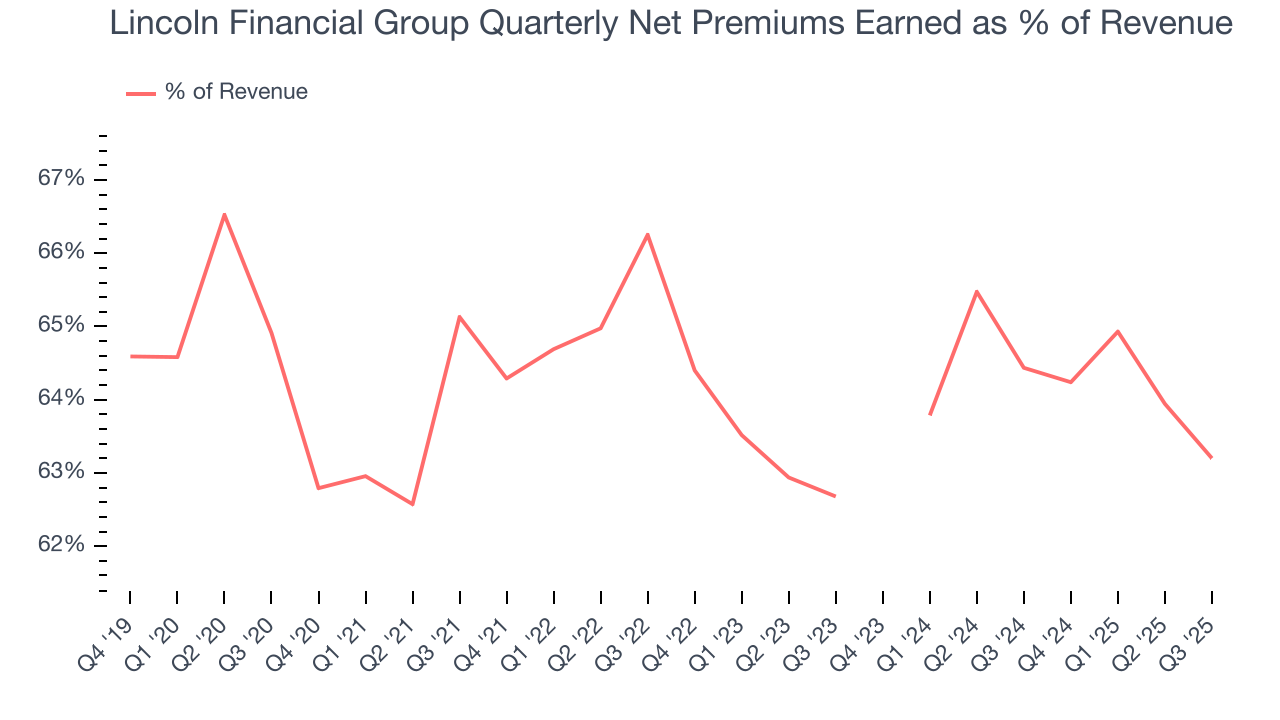 Note: Quarters not shown were determined to be outliers, impacted by outsized investment gains/losses that are not indicative of the recurring fundamentals of the business.
Our experience and research show the market cares primarily about an insurer’s net premiums earned growth as investment and fee income are considered more susceptible to market volatility and economic cycles.
6. Net Premiums Earned
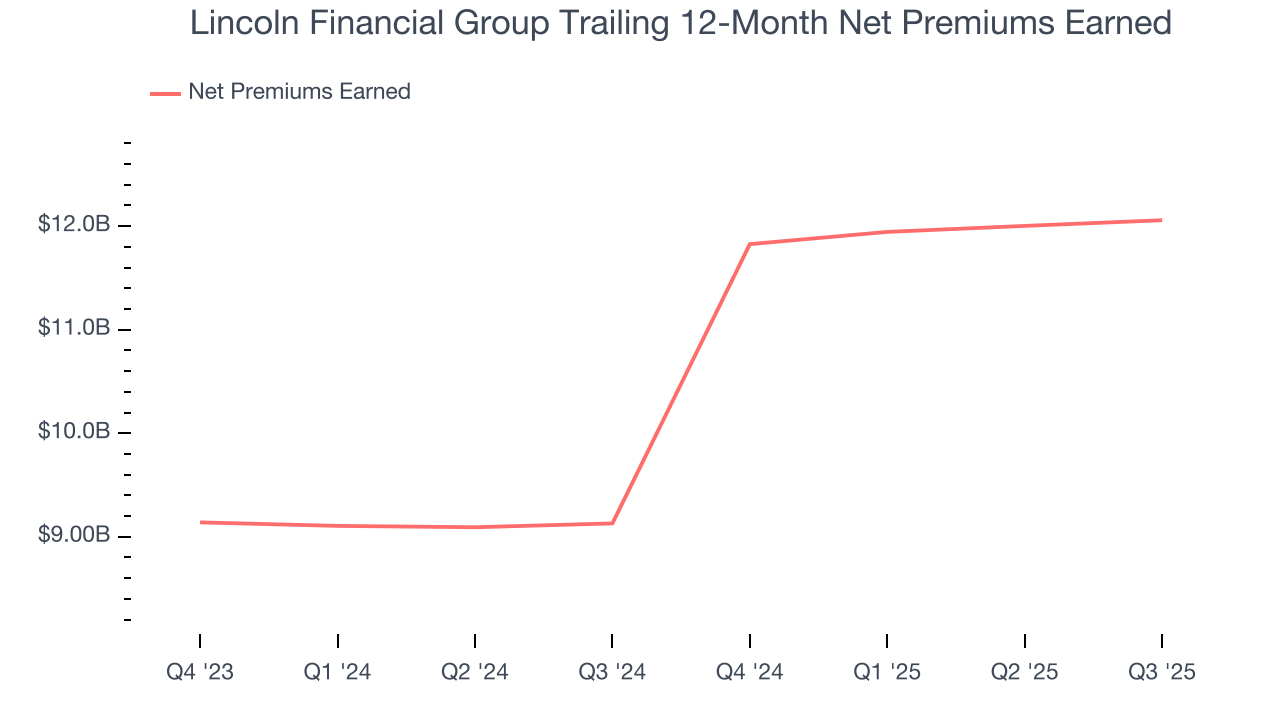
Net premiums earned are net of what’s paid to reinsurers (insurance for insurance companies), which are used by insurers to protect themselves from large losses.
Lincoln Financial Group’s net premiums earned was flat over the last five years, much worse than the broader insurance industry and in line with its total revenue.
When analyzing Lincoln Financial Group’s net premiums earned over the last two years, we can paint a similar picture as it recorded an annual growth rate of 1.2%. Since two-year net premiums earned grew slower than total revenue over this period, it’s implied that other line items such as investment income grew at a faster rate. These extra revenue streams are important to the bottom line, yet their performance can be inconsistent. Some firms have been more successful and consistent in managing their float, but sharp fluctuations in the fixed income and equity markets can dramatically affect short-term results.
7. Pre-Tax Profit Margin
Revenue growth is one major determinant of business quality, and the efficiency of operations is another. For insurance companies, we look at pre-tax profit rather than the operating margin that defines sectors such as consumer, tech, and industrials.
The economics of insurers are driven by their balance sheets, where assets (investing the float + premiums receivable) and liabilities (claims to pay) define the fundamentals. Interest income and expense should therefore be factored into the definition of profit but taxes - which are largely out of a company’s control - should not.
Over the last five years, Lincoln Financial Group’s pre-tax profit margin has fallen by 2.2 percentage points, going from 11.5% to 4.5%. It has also expanded by 11.7 percentage points on a two-year basis, showing its expenses have consistently grown at a slower rate than revenue. This typically signals prudent management.
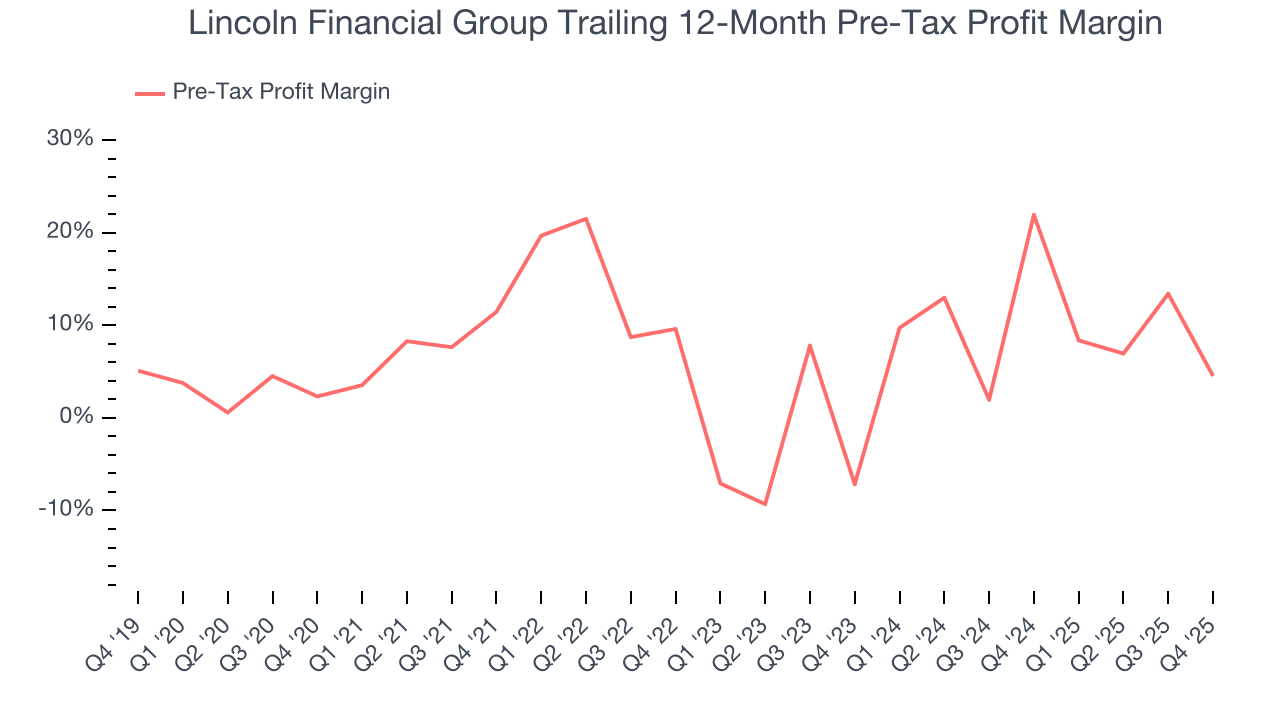
In Q4, Lincoln Financial Group’s pre-tax profit margin was 9%. This result was 36.3 percentage points worse than the same quarter last year.
8. Earnings Per Share
Revenue trends explain a company’s historical growth, but the long-term change in earnings per share (EPS) points to the profitability of that growth – for example, a company could inflate its sales through excessive spending on advertising and promotions.
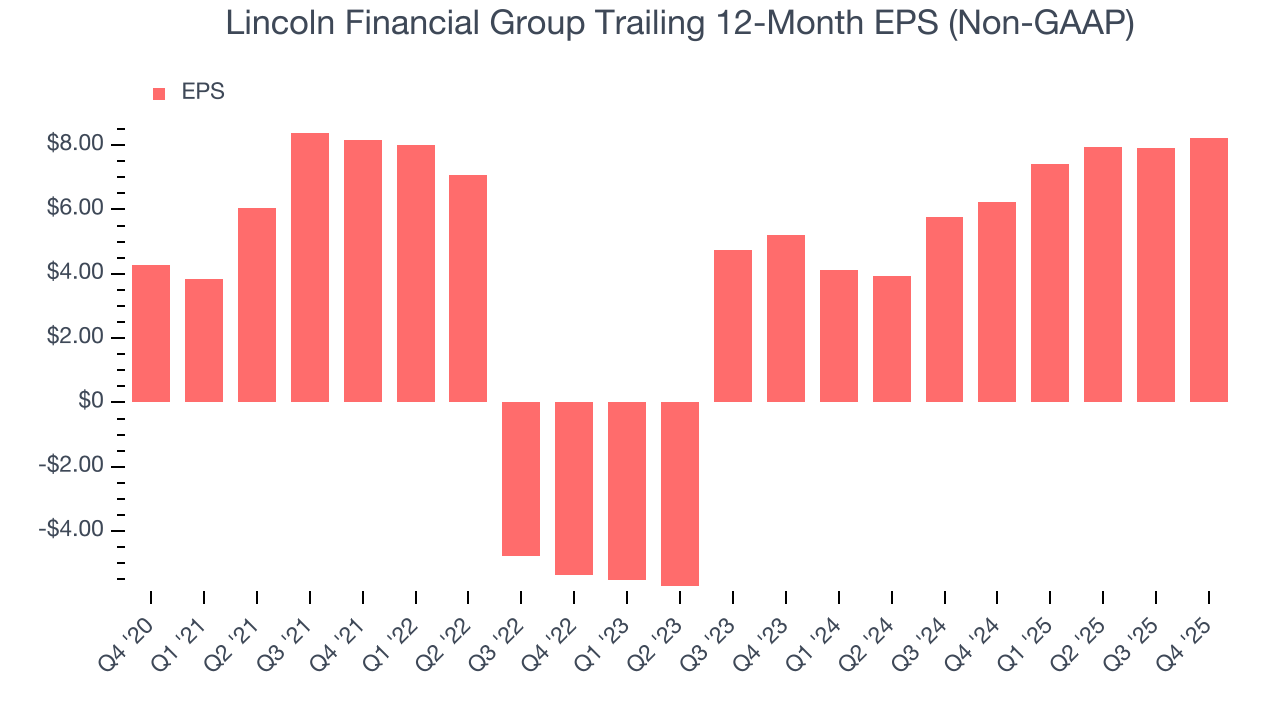
Lincoln Financial Group’s EPS grew at a solid 14% compounded annual growth rate over the last five years, higher than its 1% annualized revenue growth. This tells us the company became more profitable on a per-share basis as it expanded.
Like with revenue, we analyze EPS over a shorter period to see if we are missing a change in the business.
For Lincoln Financial Group, its two-year annual EPS growth of 25.4% was higher than its five-year trend. We love it when earnings growth accelerates, especially when it accelerates off an already high base.
In Q4, Lincoln Financial Group reported adjusted EPS of $2.21, up from $1.91 in the same quarter last year. This print easily cleared analysts’ estimates, and shareholders should be content with the results. Over the next 12 months, Wall Street expects Lincoln Financial Group’s full-year EPS of $8.21 to shrink by 1.6%.
9. Book Value Per Share (BVPS)
Insurance companies are balance sheet businesses, collecting premiums upfront and paying out claims over time. The float – premiums collected but not yet paid out – are invested, creating an asset base supported by a liability structure. Book value captures this dynamic by measuring:
- Assets (investment portfolio, cash, reinsurance recoverables) - liabilities (claim reserves, debt, future policy benefits)
BVPS is essentially the residual value for shareholders.
We therefore consider BVPS very important to track for insurers and a metric that sheds light on business quality because it reflects long-term capital growth and is harder to manipulate than more commonly-used metrics like EPS.
Lincoln Financial Group’s BVPS declined at a 15.2% annual clip over the last five years. However, BVPS growth has accelerated recently, growing by 22.1% annually over the last two years from $34.82 to $51.88 per share.
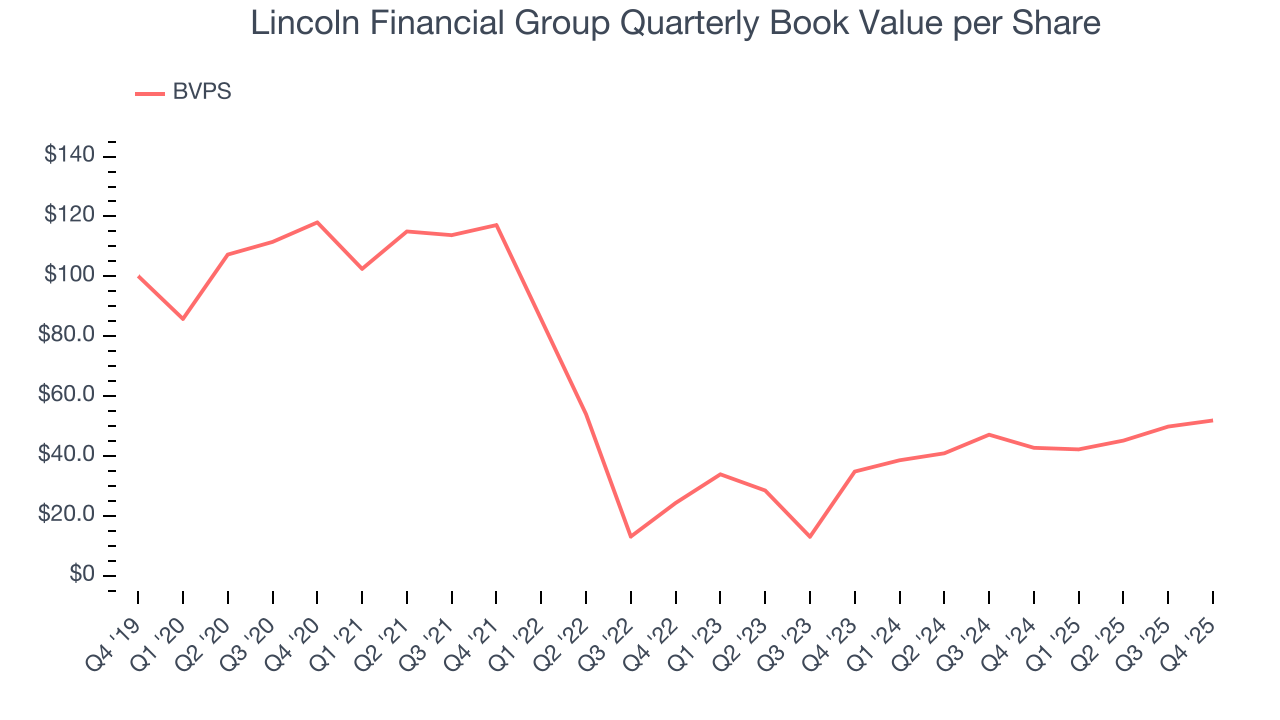
Over the next 12 months, Consensus estimates call for Lincoln Financial Group’s BVPS to grow by 47.1% to $70.51, elite growth rate.
10. Balance Sheet Assessment
The debt-to-equity ratio is a widely used measure to assess a company's balance sheet health. A higher ratio means that a business aggressively financed its growth with debt. This can result in higher earnings (if the borrowed funds are invested profitably) but also increases risk.
If debt levels are too high, there could be difficulties in meeting obligations, especially during economic downturns or periods of rising interest rates if the debt has variable-rate payments.
Lincoln Financial Group has no debt, so leverage is not an issue here.
11. Return on Equity
Return on Equity, or ROE, ties everything together and is a vital metric. It tells us how much profit the insurer generates for each dollar of shareholder equity entrusted to management. Over a long period, insurers with higher ROEs tend to compound shareholder wealth faster through retained earnings, buybacks, and dividends.
Over the last five years, Lincoln Financial Group has averaged an ROE of 10.2%, uninspiring for a company operating in a sector where the average shakes out around 12.5%.
12. Key Takeaways from Lincoln Financial Group’s Q4 Results
It was good to see Lincoln Financial Group beat analysts’ EPS expectations this quarter. We were also glad its revenue outperformed Wall Street’s estimates. On the other hand, its book value per share missed. Still, this print had some key positives. The stock traded up 6.3% to $40.94 immediately following the results.
13. Is Now The Time To Buy Lincoln Financial Group?
Updated: March 30, 2026 at 12:46 AM EDT
Before deciding whether to buy Lincoln Financial Group or pass, we urge investors to consider business quality, valuation, and the latest quarterly results.
Lincoln Financial Group isn’t a terrible business, but it isn’t one of our picks. To begin with, its revenue growth was weak over the last five years. While its estimated BVPS growth for the next 12 months is great, the downside is its BVPS has declined over the last five years. On top of that, its projected EPS for the next year is lacking.
Lincoln Financial Group’s P/B ratio based on the next 12 months is 0.6x. While this valuation is optically cheap, the potential downside is big given its shaky fundamentals. We're pretty confident there are superior stocks to buy right now.
Wall Street analysts have a consensus one-year price target of $45.46 on the company (compared to the current share price of $34.17).
Although the price target is bullish, readers should exercise caution because analysts tend to be overly optimistic. The firms they work for, often big banks, have relationships with companies that extend into fundraising, M&A advisory, and other rewarding business lines. As a result, they typically hesitate to say bad things for fear they will lose out. We at StockStory do not suffer from such conflicts of interest, so we’ll always tell it like it is.