
Mercury General (MCY)
Mercury General doesn’t excite us. Its underwhelming returns on capital show it struggled to generate meaningful profits for shareholders.― StockStory Analyst Team
1. News


2. Summary
Why Mercury General Is Not Exciting
Founded in 1961 and maintaining a network of over 6,300 independent agents across the country, Mercury General (NYSE:MCY) is an insurance company that primarily sells automobile insurance policies through independent agents in 11 states, with a strong focus on California.
- Low return on equity reflects management’s struggle to allocate funds effectively
- Annual book value per share growth of 3.5% over the last five years was below our standards for the insurance sector
- On the bright side, its annual revenue growth of 9.6% over the last five years beat the sector average and underscores the unique value of its offerings


Mercury General’s quality doesn’t meet our hurdle. We see more lucrative opportunities elsewhere.
Why There Are Better Opportunities Than Mercury General


At $86.06 per share, Mercury General trades at 1.7x forward P/B. Not only is Mercury General’s multiple richer than most insurance peers, but it’s also expensive for its fundamentals.
We’d rather invest in similarly-priced but higher-quality companies with more reliable earnings growth.
3. Mercury General (MCY) Research Report: Q4 CY2025 Update
Auto insurance provider Mercury General (NYSE:MCY) reported Q4 CY2025 results topping the market’s revenue expectations, with sales up 11.3% year on year to $1.54 billion. Its GAAP profit of $3.66 per share was 43% above analysts’ consensus estimates.
Mercury General (MCY) Q4 CY2025 Highlights:
- Net Premiums Earned: $1.45 billion vs analyst estimates of $1.42 billion (6.9% year-on-year growth, 2% beat)
- Revenue: $1.54 billion vs analyst estimates of $1.37 billion (11.3% year-on-year growth, 11.7% beat)
- Combined Ratio: 88.6% vs analyst estimates of 93.3% (470 basis point beat)
- EPS (GAAP): $3.66 vs analyst estimates of $2.56 (43% beat)
- Book Value per Share: $43.64 (24.2% year-on-year growth)
- Market Capitalization: $5.18 billion
Company Overview
Founded in 1961 and maintaining a network of over 6,300 independent agents across the country, Mercury General (NYSE:MCY) is an insurance company that primarily sells automobile insurance policies through independent agents in 11 states, with a strong focus on California.
Mercury General operates through a network of approximately 6,340 independent agents and its wholly-owned insurance agencies, AIS and PoliSeek, as well as through direct internet sales portals. While auto insurance forms the core of its business, the company has diversified its offerings to include homeowners insurance in 10 states, commercial automobile insurance in 4 states, commercial property coverage, mechanical protection plans, and umbrella policies.
The company maintains control over its underwriting process, setting its own premium rates subject to regulatory approval from each state's Department of Insurance. This underwriting autonomy allows Mercury to segment its auto insurance offerings into standard, non-standard, and preferred categories to serve different risk profiles. For example, a driver with a clean record might qualify for Mercury's preferred rates, while someone with previous accidents might be offered a non-standard policy at different pricing.
Claims processing is primarily handled in-house, with Mercury's claims staff managing all aspects from initial filing through resolution, including any legal proceedings. This vertical integration of the claims process gives the company direct control over one of the most critical aspects of insurance operations—paying claims while managing costs.
The insurance industry is heavily regulated, with each state's Department of Insurance conducting periodic financial and market conduct examinations of Mercury's operations. These regulatory bodies oversee everything from rate approvals to business practices, ensuring the company maintains sufficient financial reserves to meet policyholder obligations.
4. Property & Casualty Insurance
Property & Casualty (P&C) insurers protect individuals and businesses against financial loss from damage to property or from legal liability. This is a cyclical industry, and the sector benefits when there is 'hard market', characterized by strong premium rate increases that outpace loss and cost inflation, resulting in robust underwriting margins. The opposite is true in a 'soft market'. Interest rates also matter, as they determine the yields earned on fixed-income portfolios. On the other hand, P&C insurers face a major secular headwind from the increasing frequency and severity of catastrophe losses due to climate change. Furthermore, the liability side of the business is pressured by 'social inflation'—the trend of rising litigation costs and larger jury awards.
Mercury General competes with large national insurers like State Farm, Allstate (NYSE:ALL), Progressive (NYSE:PGR), and GEICO (owned by Berkshire Hathaway, NYSE:BRK.A, BRK.B), as well as regional insurance providers in its operating states.
5. Revenue Growth
Big picture, insurers generate revenue from three key sources. The first is the core business of underwriting policies. The second source is income from investing the “float” (premiums collected upfront not yet paid out as claims) in assets such as fixed-income assets and equities. The third is fees from various sources such as policy administration, annuities, or other value-added services. Luckily, Mercury General’s revenue grew at a solid 9.6% compounded annual growth rate over the last five years. Its growth beat the average insurance company and shows its offerings resonate with customers.
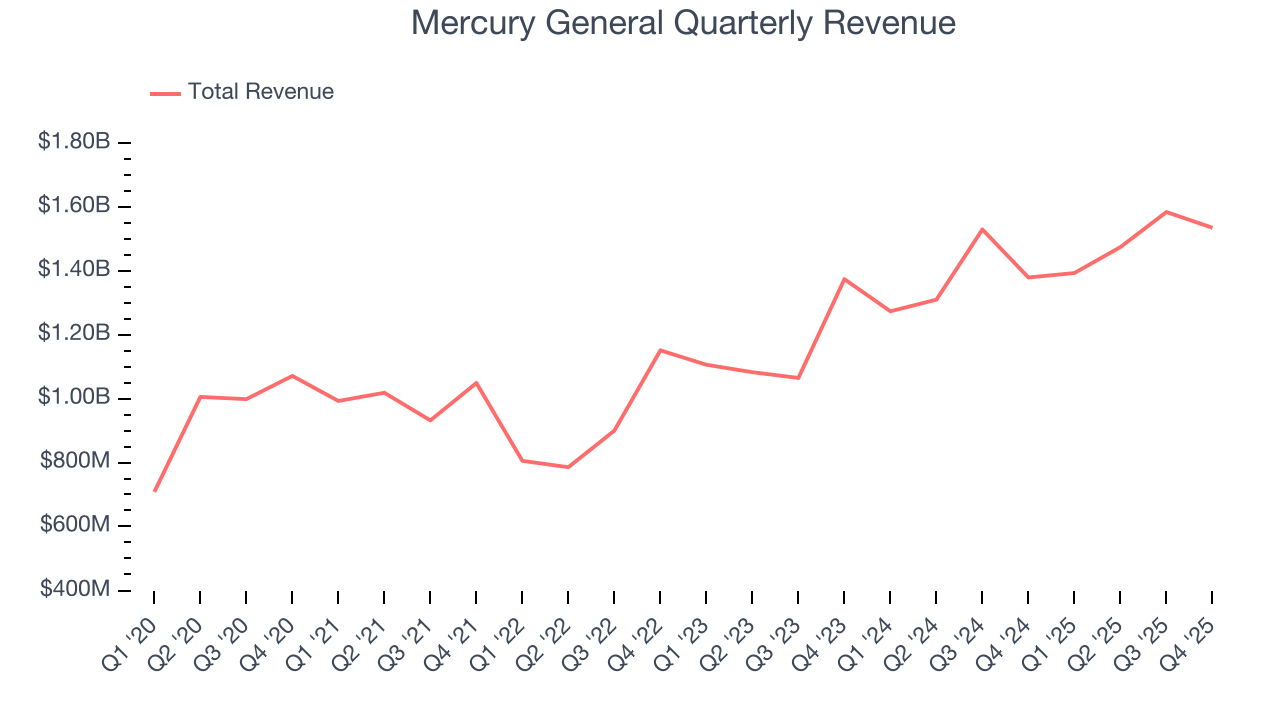
Long-term growth is the most important, but within financials, a half-decade historical view may miss recent interest rate changes and market returns. Mercury General’s annualized revenue growth of 13.7% over the last two years is above its five-year trend, suggesting its demand was strong and recently accelerated. 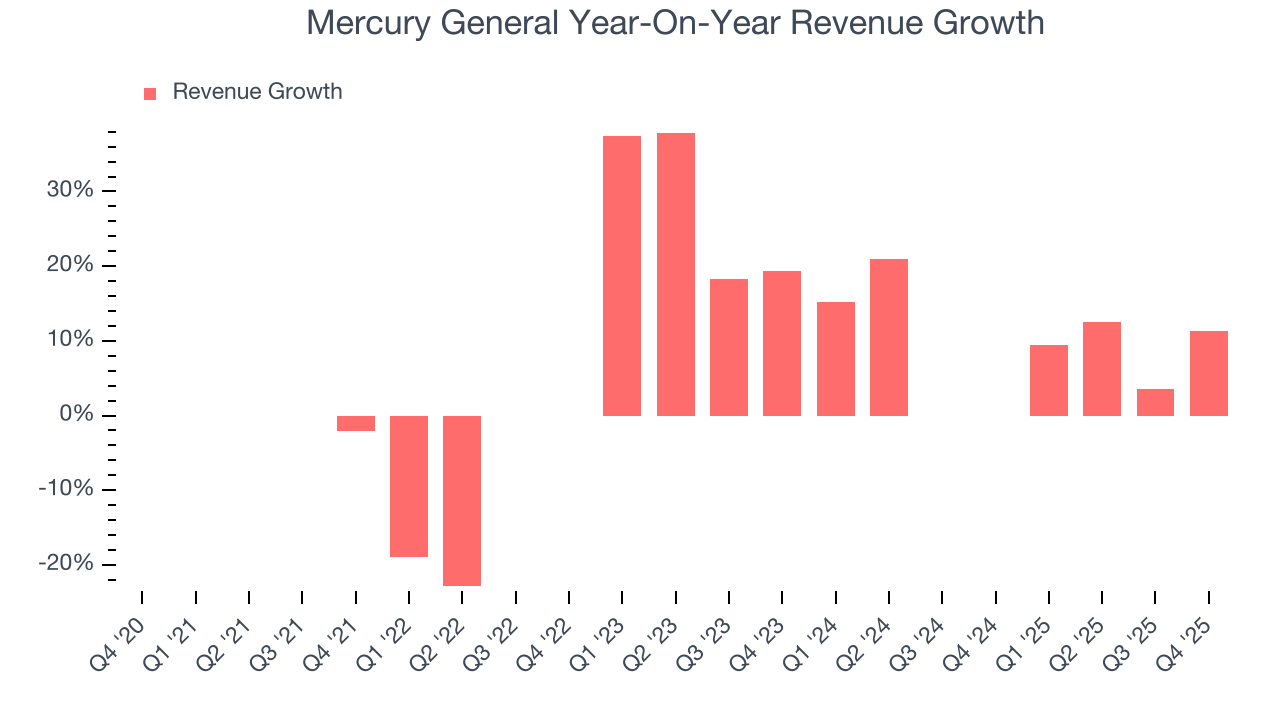 Note: Quarters not shown were determined to be outliers, impacted by outsized investment gains/losses that are not indicative of the recurring fundamentals of the business.
This quarter, Mercury General reported year-on-year revenue growth of 11.3%, and its $1.54 billion of revenue exceeded Wall Street’s estimates by 11.7%.
Net premiums earned made up 94.9% of the company’s total revenue during the last five years, meaning Mercury General lives and dies by its underwriting activities because non-insurance operations barely move the needle.
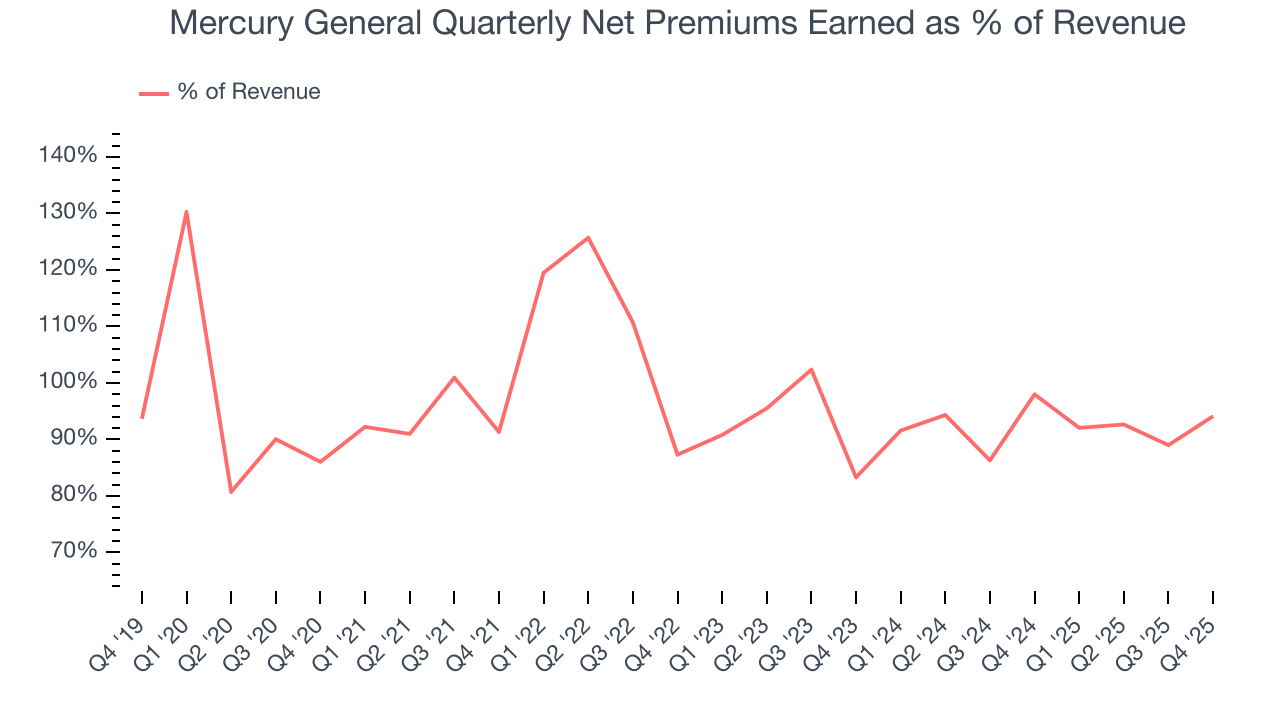
Markets consistently prioritize net premiums earned growth over investment and fee income, recognizing its superior quality as a core indicator of the company’s underwriting success and market penetration.
6. Net Premiums Earned
Insurers sell policies then use reinsurance (insurance for insurance companies) to protect themselves from large losses. Net premiums earned are therefore what's collected from selling policies less what’s paid to reinsurers as a risk mitigation tool.
Mercury General’s net premiums earned has grown at a 9.1% annualized rate over the last five years, slightly better than the broader insurance industry and in line with its total revenue.
When analyzing Mercury General’s net premiums earned over the last two years, we can see that growth accelerated to 13.5% annually. This performance was similar to its total revenue.
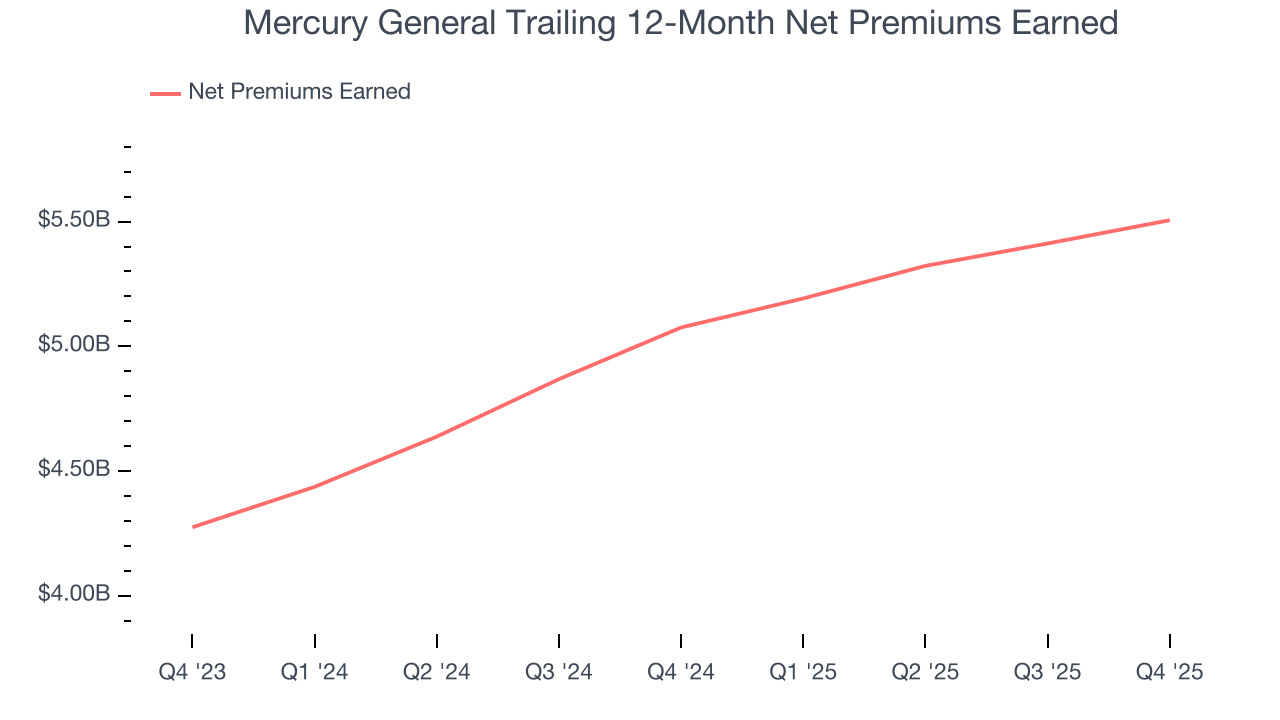
In Q4, Mercury General produced $1.45 billion of net premiums earned, up 6.9% year on year and topping Wall Street Consensus estimates by 2%.
7. Combined Ratio
Revenue growth is one major determinant of business quality, and the efficiency of operations is another. For insurance companies, we look at the combined ratio rather than the operating expenses and margins that define sectors such as consumer, tech, and industrials.
Combined ratio = (costs of underwriting + what an insurer pays out in claims) / net premiums earned. If a company boasts a combined ratio under 100%, it is underwriting profitably. If above 100%, it is losing money on its core operations.
Given the calculation, a lower expense ratio is better. Over the last five years, Mercury General’s combined ratio has increased by 4 percentage points, going from 95.8% to 96.8%. Luckily, it seems the company has recently taken steps to address its expense base as its combined ratio improved by 8.9 percentage points on a two-year basis.
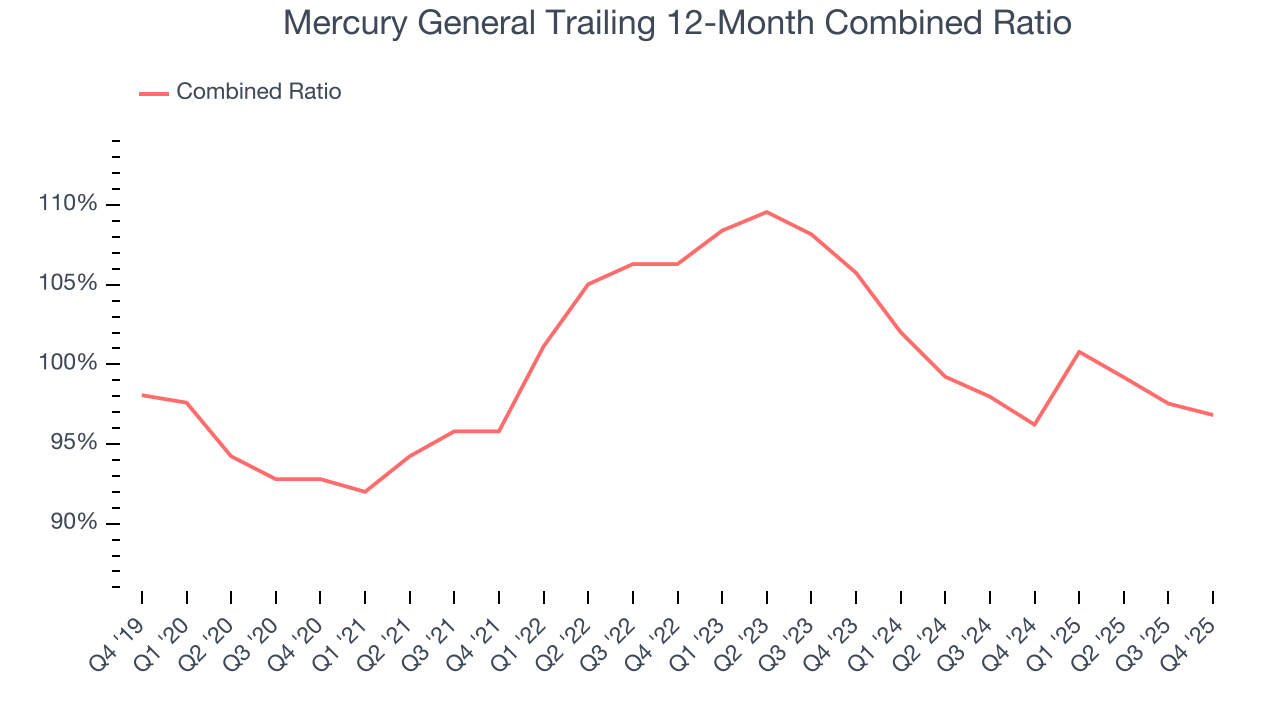
In Q4, Mercury General’s combined ratio was 88.6%, beating analysts’ expectations by 470 basis points (100 basis points = 1 percentage point). This result was 2.9 percentage points better than the same quarter last year.
8. Earnings Per Share
We track the long-term change in earnings per share (EPS) for the same reason as long-term revenue growth. Compared to revenue, however, EPS highlights whether a company’s growth is profitable.
Mercury General’s EPS grew at an unimpressive 7.6% compounded annual growth rate over the last five years, lower than its 9.6% annualized revenue growth. However, its combined ratio actually improved during this time, telling us that non-fundamental factors such as interest expenses and taxes affected its ultimate earnings.
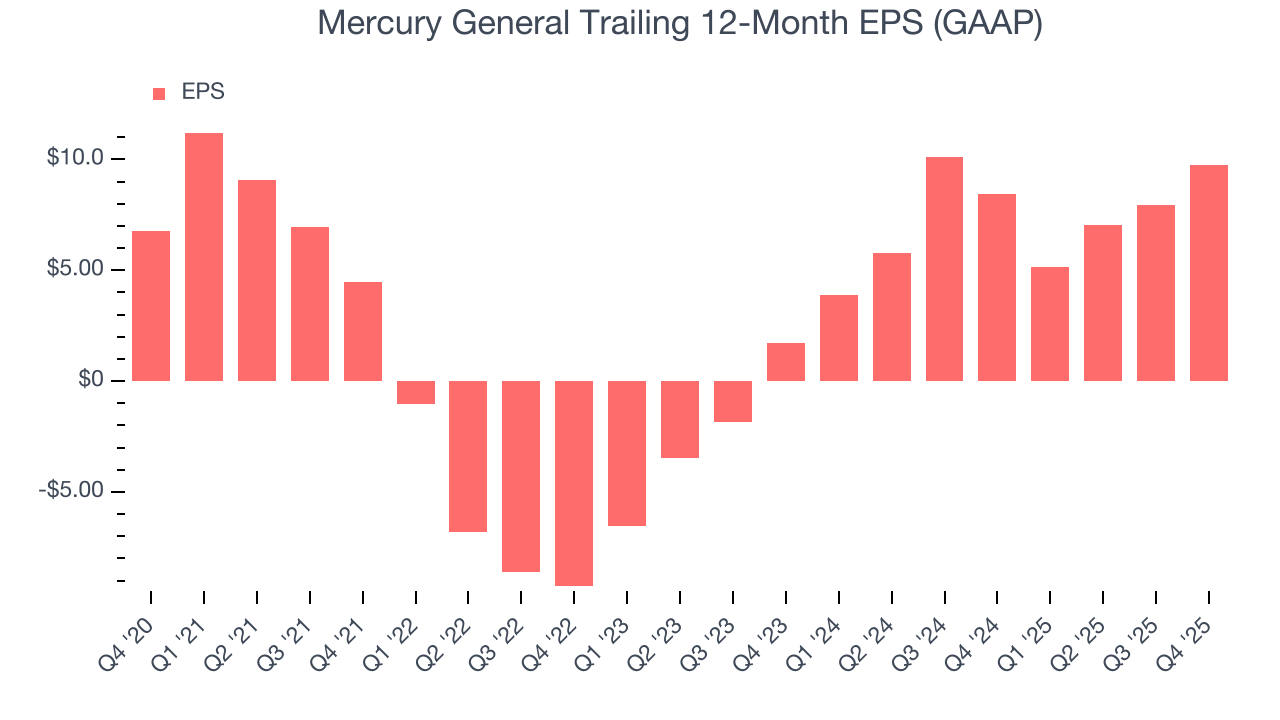
Like with revenue, we analyze EPS over a more recent period because it can provide insight into an emerging theme or development for the business.
For Mercury General, its two-year annual EPS growth of 137% was higher than its five-year trend. This acceleration made it one of the faster-growing insurance companies in recent history.
In Q4, Mercury General reported EPS of $3.66, up from $1.82 in the same quarter last year. This print easily cleared analysts’ estimates, and shareholders should be content with the results. Over the next 12 months, Wall Street expects Mercury General’s full-year EPS of $9.77 to shrink by 14%.
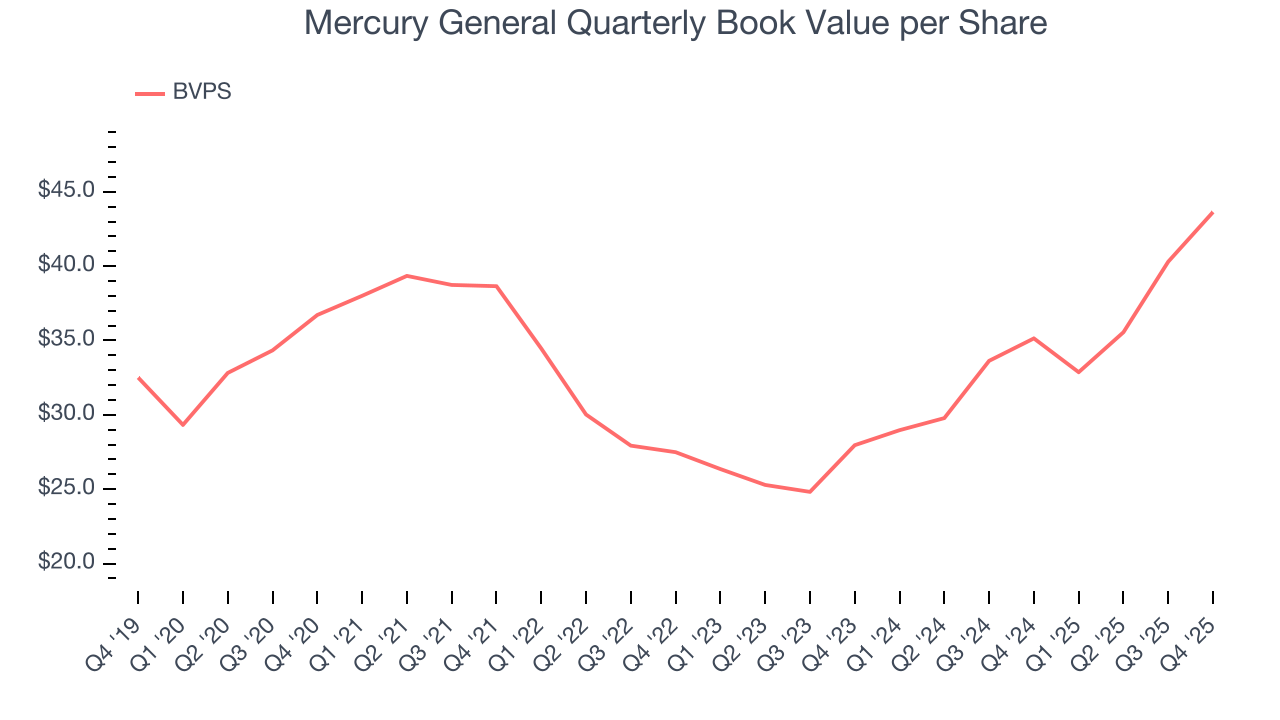
9. Book Value Per Share (BVPS)
Insurers are balance sheet businesses, collecting premiums upfront and paying out claims over time. Premiums collected but not yet paid out, often referred to as the float, are invested and create an asset base supported by a liability structure. Book value per share (BVPS) captures this dynamic by measuring these assets (investment portfolio, cash, reinsurance recoverables) less liabilities (claim reserves, debt, future policy benefits). BVPS is essentially the residual value for shareholders.
We therefore consider BVPS very important to track for insurers and a metric that sheds light on business quality because it reflects long-term capital growth and is harder to manipulate than more commonly-used metrics like EPS.
Mercury General’s BVPS grew at a sluggish 3.5% annual clip over the last five years. However, BVPS growth has accelerated recently, growing by 24.9% annually over the last two years from $27.96 to $43.64 per share.
10. Balance Sheet Assessment
The debt-to-equity ratio is a widely used measure to assess a company's balance sheet health. A higher ratio means that a business aggressively financed its growth with debt. This can result in higher earnings (if the borrowed funds are invested profitably) but also increases risk.
If debt levels are too high, there could be difficulties in meeting obligations, especially during economic downturns or periods of rising interest rates if the debt has variable-rate payments.
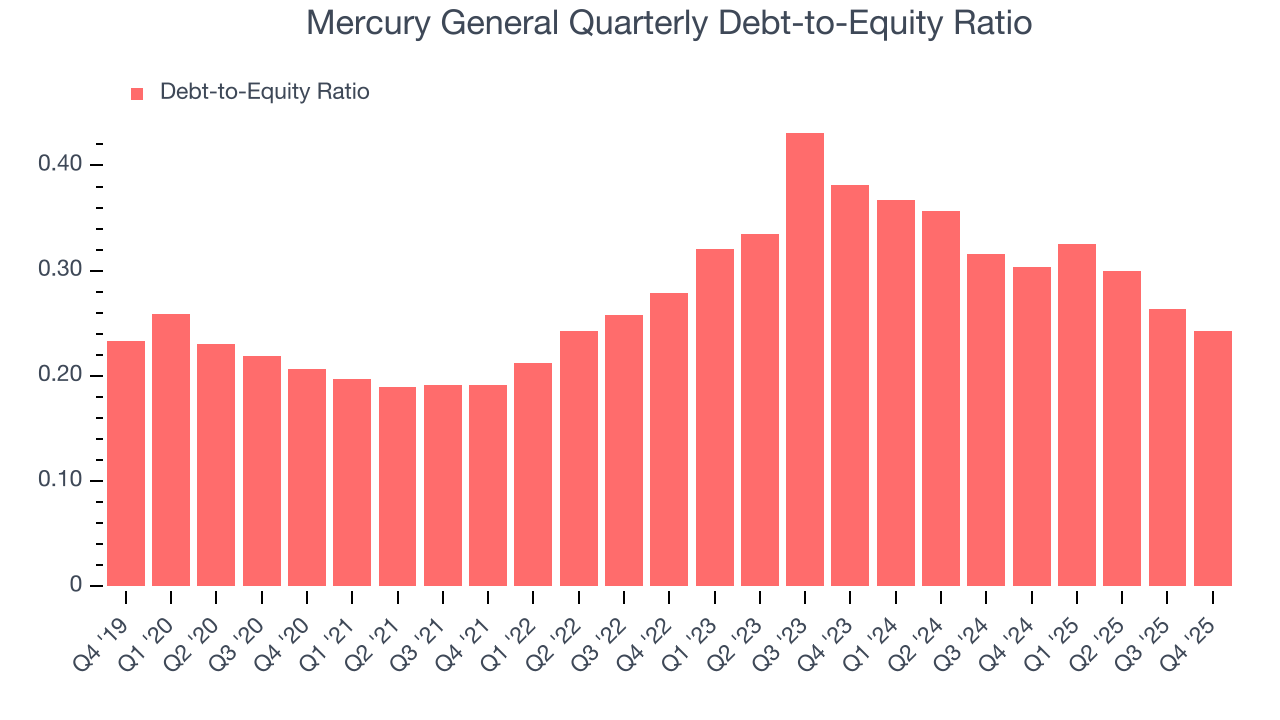
Mercury General currently has $586.9 million of debt and $2.42 billion of shareholder's equity on its balance sheet, and over the past four quarters, has averaged a debt-to-equity ratio of 0.3×. We think this is safe and raises no red flags. In general, we’re comfortable with any ratio below 1.0× for an insurance business. Anything below 0.5× is a bonus.
11. Return on Equity
Return on equity (ROE) serves as a comprehensive measure of an insurer's performance, showing how efficiently it converts shareholder capital into profits. Strong ROE performance typically translates to better returns for investors through a combination of earnings retention, share repurchases, and dividend distributions.
Over the last five years, Mercury General has averaged an ROE of 7.1%, uninspiring for a company operating in a sector where the average shakes out around 12.5%.
12. Key Takeaways from Mercury General’s Q4 Results
It was good to see Mercury General beat analysts’ EPS expectations this quarter. We were also excited its revenue outperformed Wall Street’s estimates by a wide margin. Zooming out, we think this was a solid print. The stock remained flat at $96.62 immediately after reporting.
13. Is Now The Time To Buy Mercury General?
Updated: March 14, 2026 at 12:42 AM EDT
We think that the latest earnings result is only one piece of the bigger puzzle. If you’re deciding whether to own Mercury General, you should also grasp the company’s longer-term business quality and valuation.
There are some bright spots in Mercury General’s fundamentals, but its business quality ultimately falls short. First off, its revenue growth was solid over the last five years. And while Mercury General’s relatively low ROE suggests management has struggled to find compelling investment opportunities, its net premiums earned growth was good over the last five years.
Mercury General’s P/B ratio based on the next 12 months is 1.7x. While this valuation is reasonable, we don’t really see a big opportunity at the moment. We're pretty confident there are superior stocks to buy right now.
Wall Street analysts have a consensus one-year price target of $110 on the company (compared to the current share price of $86.06).