
MGM Resorts (MGM)
MGM Resorts faces an uphill battle. Its sales have underperformed and its low returns on capital show it has few growth opportunities.― StockStory Analyst Team
1. News
2. Summary
Why We Think MGM Resorts Will Underperform
Operating several properties on the Las Vegas Strip, MGM Resorts (NYSE:MGM) is a global hospitality and entertainment company known for its resorts and casinos.
- Large revenue base makes it harder to increase sales quickly, and its annual revenue growth of 4.2% over the last two years was below our standards for the consumer discretionary sector
- Subpar operating margin constrains its ability to invest in process improvements or effectively respond to new competitive threats
- High net-debt-to-EBITDA ratio of 12× increases the risk of forced asset sales or dilutive financing if operational performance weakens


MGM Resorts’s quality is insufficient. We’d rather invest in businesses with stronger moats.
Why There Are Better Opportunities Than MGM Resorts


At $35.71 per share, MGM Resorts trades at 12.1x forward P/E. This multiple is lower than most consumer discretionary companies, but for good reason.
It’s better to pay up for high-quality businesses with higher long-term earnings potential rather than to buy lower-quality stocks because they appear cheap. These challenged businesses often don’t re-rate, a phenomenon known as a “value trap”.
3. MGM Resorts (MGM) Research Report: Q4 CY2025 Update
Hospitality and casino entertainment company MGM Resorts (NYSE:MGM) announced better-than-expected revenue in Q4 CY2025, with sales up 6% year on year to $4.61 billion. Its non-GAAP profit of $1.60 per share was significantly above analysts’ consensus estimates.
MGM Resorts (MGM) Q4 CY2025 Highlights:
- Revenue: $4.61 billion vs analyst estimates of $4.44 billion (6% year-on-year growth, 3.6% beat)
- Adjusted EPS: $1.60 vs analyst estimates of $0.55 (significant beat)
- Adjusted EBITDA: $635.3 million vs analyst estimates of $1.16 billion (13.8% margin, 45.2% miss)
- Operating Margin: 7.1%, in line with the same quarter last year
- Free Cash Flow Margin: 8.2%, up from 6.2% in the same quarter last year
- Market Capitalization: $9.68 billion
Company Overview
Operating several properties on the Las Vegas Strip, MGM Resorts (NYSE:MGM) is a global hospitality and entertainment company known for its resorts and casinos.
MGM Resorts was established to be more than a casino operator, aiming to offer comprehensive entertainment and hospitality experiences. This ambition led the company to create destination resorts that blend casino gaming with a full spectrum of resort amenities, including massive pools and all-you-can-eat buffets.
MGM Resorts operates a diverse property portfolio with destinations around the world. The company serves a broad audience, including leisure travelers, gaming enthusiasts, business professionals, and event organizers.
MGM Resorts has also adapted to the online age by introducing digital casino games that can be played from your phone along with a digital sportsbook, BetMGM. It generates its revenue from casino games, sports betting, hotel stays, dining, entertainment, and convention services.
4. Casino Operator
Casino operators enjoy limited competition because gambling is a highly regulated industry. These companies can also enjoy healthy margins and profits. Have you ever heard the phrase ‘the house always wins’? Regulation cuts both ways, however, and casinos may face stroke-of-the-pen risk that suddenly limits what they can or can't do and where they can do it. Furthermore, digitization is changing the game, pun intended. Whether it’s online poker or sports betting on your smartphone, innovation is forcing these players to adapt to changing consumer preferences, such as being able to wager anywhere on demand.
Competitors in the casino and hospitality industry include Caesars Entertainment (NASDAQ:CZR), Las Vegas Sands (NYSE:LVS), and Wynn Resorts (NASDAQ:WYNN).
5. Revenue Growth
A company’s long-term performance is an indicator of its overall quality. Any business can put up a good quarter or two, but many enduring ones grow for years. Over the last five years, MGM Resorts grew its sales at a 27.7% annual rate. Although this growth is acceptable on an absolute basis, it fell slightly short of our standards for the consumer discretionary sector, which enjoys a number of secular tailwinds.
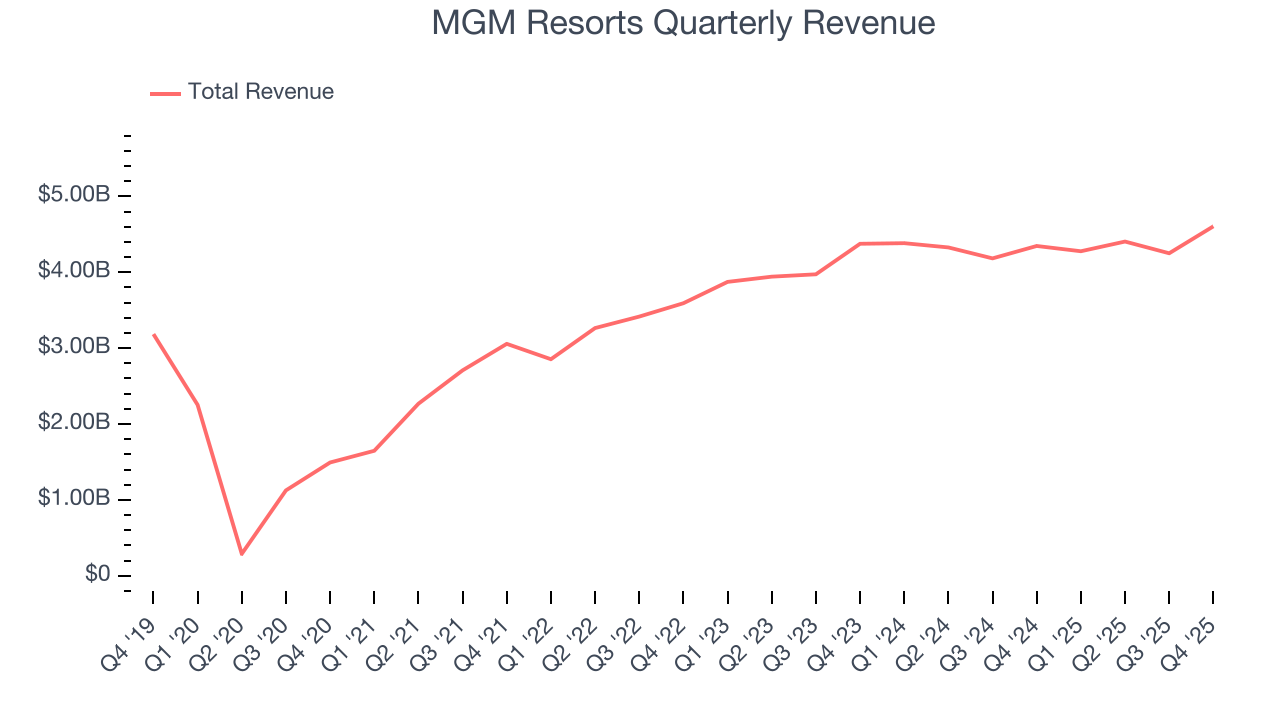
Long-term growth is the most important, but within consumer discretionary, product cycles are short and revenue can be hit-driven due to rapidly changing trends and consumer preferences. MGM Resorts’s recent performance shows its demand has slowed as its annualized revenue growth of 4.2% over the last two years was below its five-year trend. Note that COVID hurt MGM Resorts’s business in 2020 and part of 2021, and it bounced back in a big way thereafter. 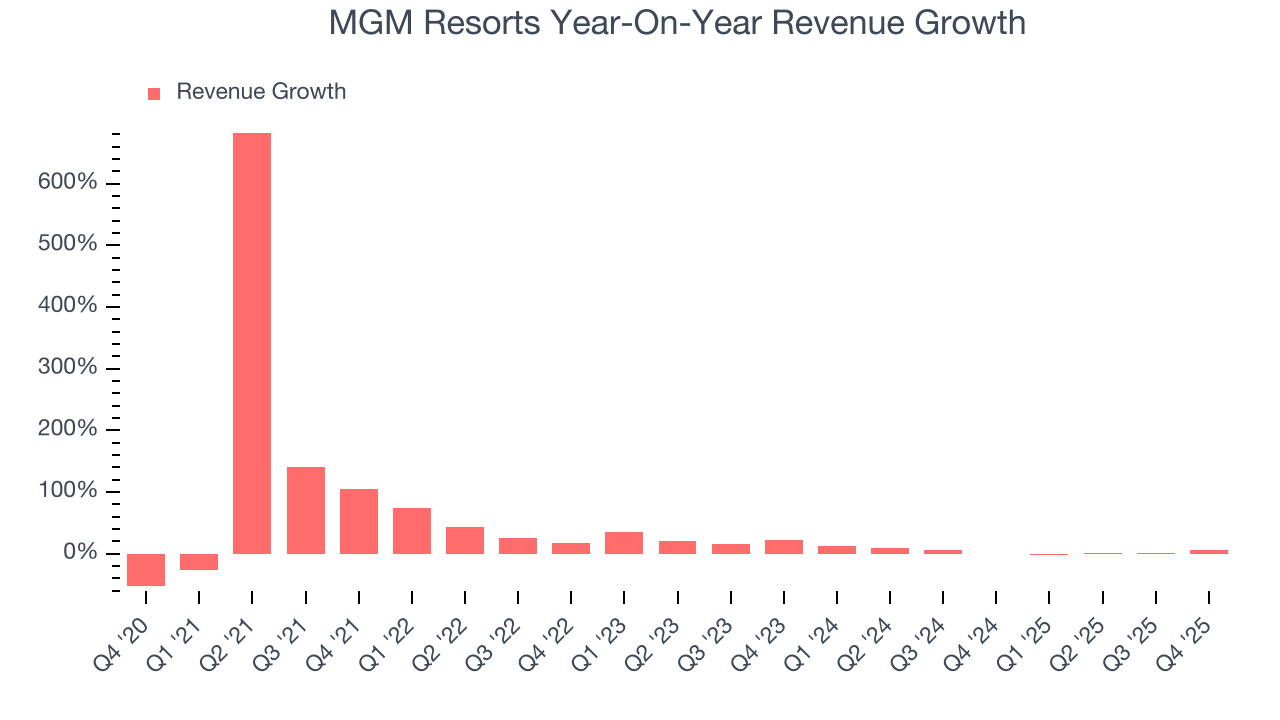
This quarter, MGM Resorts reported year-on-year revenue growth of 6%, and its $4.61 billion of revenue exceeded Wall Street’s estimates by 3.6%.
Looking ahead, sell-side analysts expect revenue to grow 1.2% over the next 12 months, a slight deceleration versus the last two years. This projection is underwhelming and suggests its products and services will see some demand headwinds.
6. Operating Margin
Operating margin is an important measure of profitability as it shows the portion of revenue left after accounting for all core expenses – everything from the cost of goods sold to advertising and wages. It’s also useful for comparing profitability across companies with different levels of debt and tax rates because it excludes interest and taxes.
MGM Resorts’s operating margin has been trending down over the last 12 months and averaged 7.2% over the last two years. The company’s profitability was mediocre for a consumer discretionary business and shows it couldn’t pass its higher operating expenses onto its customers.
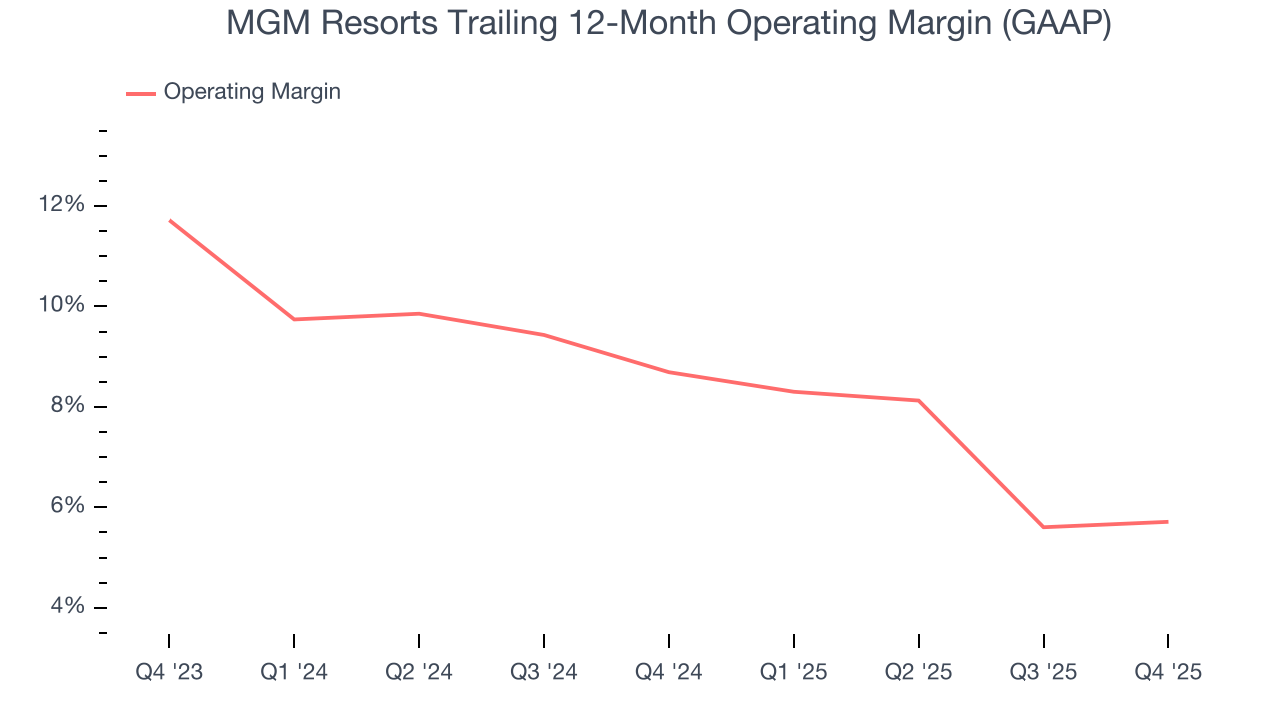
This quarter, MGM Resorts generated an operating margin profit margin of 7.1%, in line with the same quarter last year. This indicates the company’s overall cost structure has been relatively stable.
7. Earnings Per Share
We track the long-term change in earnings per share (EPS) for the same reason as long-term revenue growth. Compared to revenue, however, EPS highlights whether a company’s growth is profitable.
MGM Resorts’s full-year EPS flipped from negative to positive over the last five years. This is encouraging and shows it’s at a critical moment in its life.
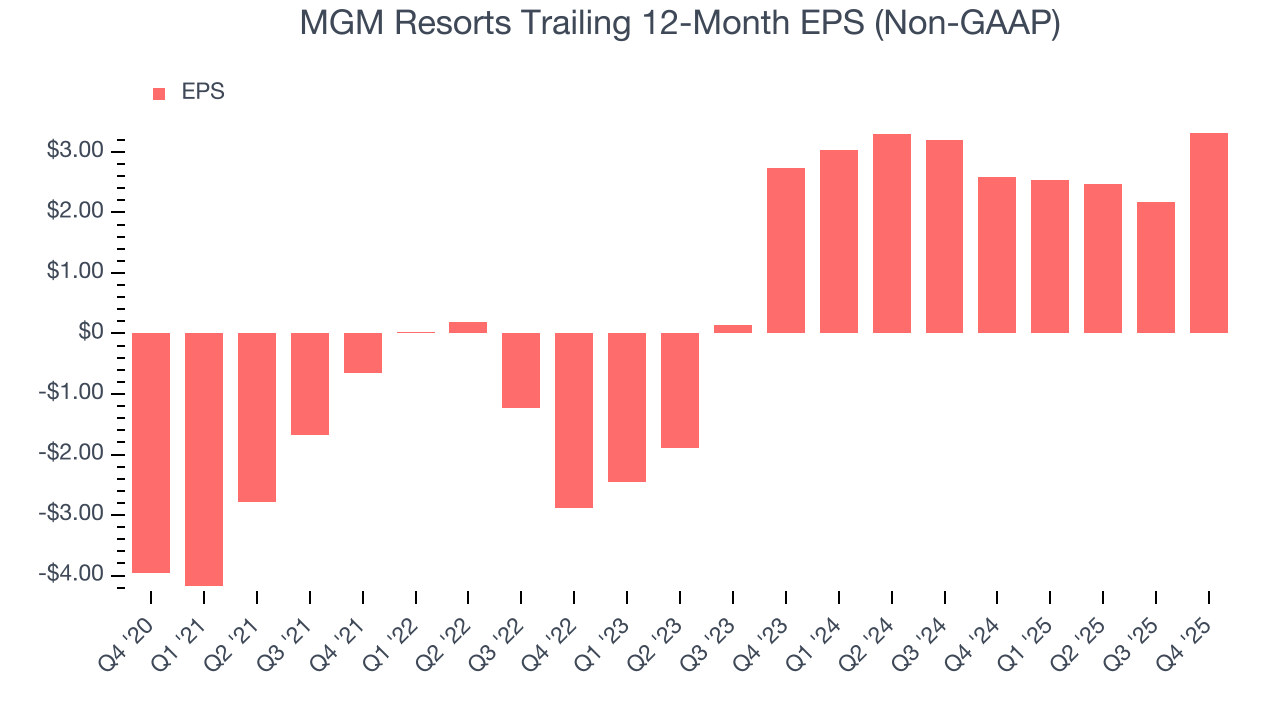
In Q4, MGM Resorts reported adjusted EPS of $1.60, up from $0.45 in the same quarter last year. This print easily cleared analysts’ estimates, and shareholders should be content with the results. Over the next 12 months, Wall Street expects MGM Resorts’s full-year EPS of $3.32 to shrink by 42.8%.
8. Cash Is King
Although earnings are undoubtedly valuable for assessing company performance, we believe cash is king because you can’t use accounting profits to pay the bills.
MGM Resorts has shown poor cash profitability over the last two years, giving the company limited opportunities to return capital to shareholders. Its free cash flow margin averaged 7.7%, lousy for a consumer discretionary business.
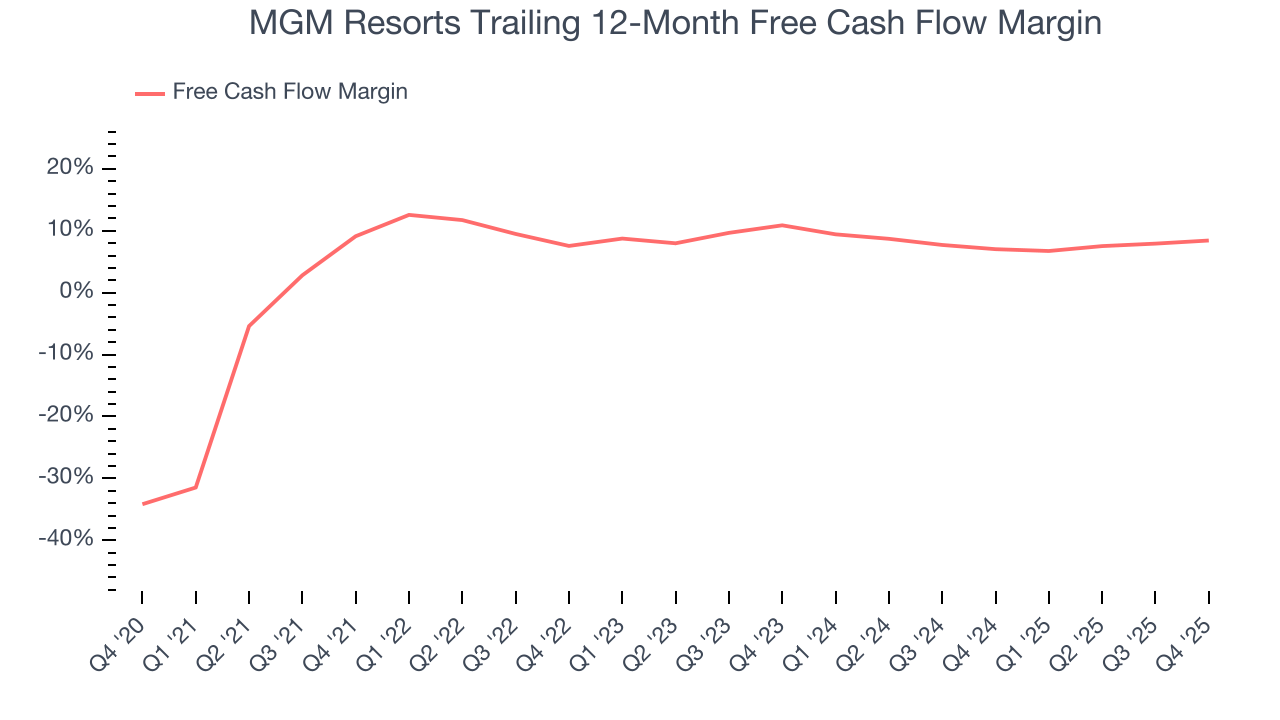
MGM Resorts’s free cash flow clocked in at $376.5 million in Q4, equivalent to a 8.2% margin. This result was good as its margin was 2 percentage points higher than in the same quarter last year, but we wouldn’t read too much into the short term because investment needs can be seasonal, causing temporary swings. Long-term trends carry greater meaning.
Over the next year, analysts’ consensus estimates show they’re expecting MGM Resorts’s free cash flow margin of 8.4% for the last 12 months to remain the same.
9. Return on Invested Capital (ROIC)
EPS and free cash flow tell us whether a company was profitable while growing its revenue. But was it capital-efficient? A company’s ROIC explains this by showing how much operating profit it makes compared to the money it has raised (debt and equity).
MGM Resorts historically did a mediocre job investing in profitable growth initiatives. Its five-year average ROIC was 8.5%, somewhat low compared to the best consumer discretionary companies that consistently pump out 25%+.
We like to invest in businesses with high returns, but the trend in a company’s ROIC is what often surprises the market and moves the stock price. Over the last few years, MGM Resorts’s ROIC has unfortunately decreased. Paired with its already low returns, these declines suggest its profitable growth opportunities are few and far between.
10. Balance Sheet Risk
Debt is a tool that can boost company returns but presents risks if used irresponsibly. As long-term investors, we aim to avoid companies taking excessive advantage of this instrument because it could lead to insolvency.
MGM Resorts’s $31.19 billion of debt exceeds the $2.06 billion of cash on its balance sheet. Furthermore, its 12× net-debt-to-EBITDA ratio (based on its EBITDA of $2.43 billion over the last 12 months) shows the company is overleveraged.
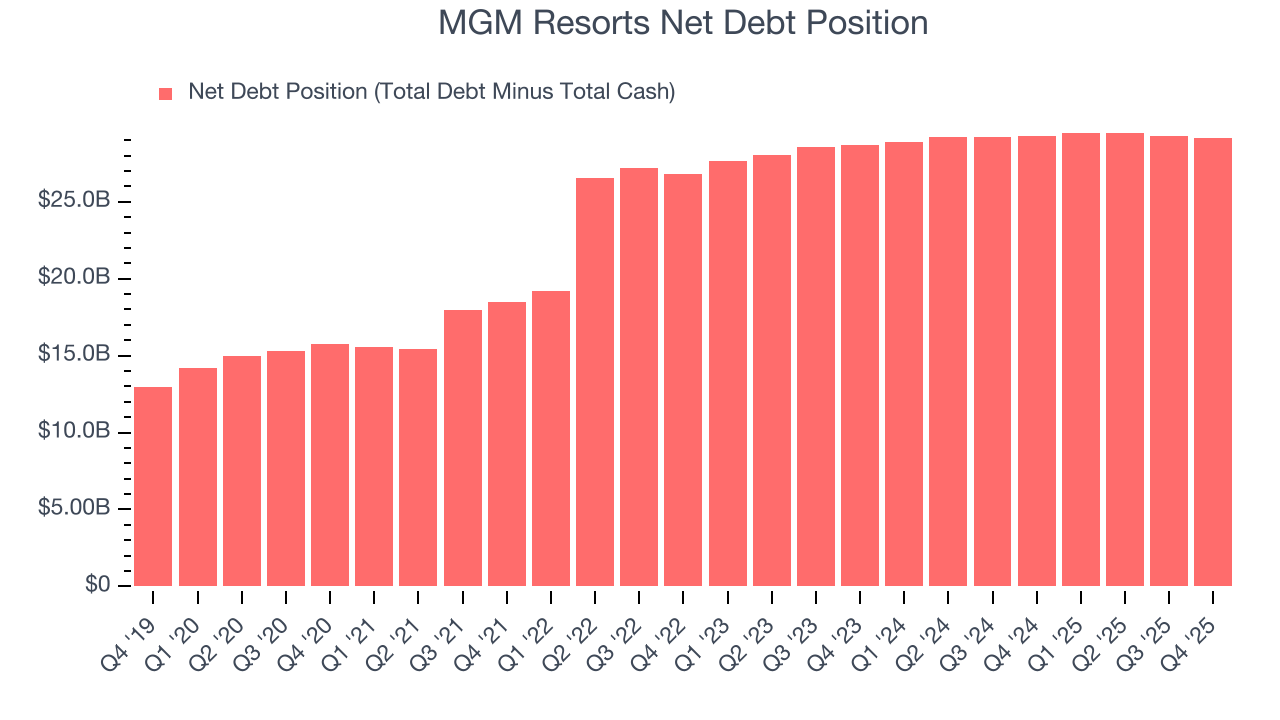
At this level of debt, incremental borrowing becomes increasingly expensive and credit agencies could downgrade the company’s rating if profitability falls. MGM Resorts could also be backed into a corner if the market turns unexpectedly – a situation we seek to avoid as investors in high-quality companies.
We hope MGM Resorts can improve its balance sheet and remain cautious until it increases its profitability or pays down its debt.
11. Key Takeaways from MGM Resorts’s Q4 Results
It was good to see MGM Resorts beat analysts’ EPS expectations this quarter. We were also happy its revenue outperformed Wall Street’s estimates. On the other hand, its EBITDA missed and its adjusted operating income fell short of Wall Street’s estimates. Overall, this quarter could have been better. The stock remained flat at $37.34 immediately after reporting.
12. Is Now The Time To Buy MGM Resorts?
Updated: February 6, 2026 at 10:02 PM EST
We think that the latest earnings result is only one piece of the bigger puzzle. If you’re deciding whether to own MGM Resorts, you should also grasp the company’s longer-term business quality and valuation.
MGM Resorts falls short of our quality standards. To kick things off, its revenue growth was weak over the last five years, and analysts expect its demand to deteriorate over the next 12 months. On top of that, MGM Resorts’s Forecasted free cash flow margin for next year suggests the company will fail to improve its cash conversion, and its projected EPS for the next year is lacking.
MGM Resorts’s P/E ratio based on the next 12 months is 19.1x. This valuation multiple is fair, but we don’t have much confidence in the company. There are better stocks to buy right now.
Wall Street analysts have a consensus one-year price target of $42.33 on the company (compared to the current share price of $37.34).