
Marsh & McLennan (MMC)
1. News
2. Marsh & McLennan (MMC) Research Report: Q3 CY2025 Update
Professional services firm Marsh & McLennan (NYSE:MMC) met Wall Streets revenue expectations in Q3 CY2025, with sales up 11.5% year on year to $6.35 billion. Its non-GAAP profit of $1.85 per share was 4.1% above analysts’ consensus estimates.
Marsh & McLennan (MMC) Q3 CY2025 Highlights:
- Revenue: $6.35 billion vs analyst estimates of $6.32 billion (11.5% year-on-year growth, in line)
- Adjusted EPS: $1.85 vs analyst estimates of $1.78 (4.1% beat)
- Adjusted EBITDA: $1.53 billion vs analyst estimates of $1.55 billion (24.1% margin, 1.2% miss)
- Operating Margin: 18.4%, down from 19.4% in the same quarter last year
- Free Cash Flow Margin: 31.6%, similar to the same quarter last year
- Organic Revenue rose 4% year on year vs analyst estimates of 4% growth (in line)
- Market Capitalization: $90.88 billion
Company Overview
With roots dating back to 1871 and a presence in over 130 countries, Marsh & McLennan (NYSE:MMC) is a global professional services firm that helps organizations manage risk, strategy, and workforce challenges through its four specialized businesses.
Marsh & McLennan operates through four distinct but complementary businesses that collectively serve as the backbone of its service offerings. Marsh, the company's insurance brokerage arm, advises clients on risk management and designs customized insurance solutions for businesses of all sizes—from multinational corporations to middle-market companies and small enterprises. Guy Carpenter, the reinsurance intermediary, helps insurance companies manage their own risk exposures by arranging reinsurance coverage and providing analytical services.
On the consulting side, Mercer delivers solutions related to employee health benefits, retirement plans, and workforce management. A typical client might engage Mercer to redesign their employee benefits program to better attract talent while controlling costs, or to develop investment strategies for their pension funds. Oliver Wyman rounds out the portfolio by providing management consulting services across industries like financial services, healthcare, and transportation, helping executives tackle strategic challenges and organizational transformations.
The company generates revenue primarily through fees and commissions. For insurance brokerage services, Marsh typically earns commissions based on the insurance premiums placed, while consulting services from Mercer and Oliver Wyman generally operate on fee-based arrangements. This diversified business model allows Marsh & McLennan to serve clients across the risk management spectrum—from identifying and quantifying risks to implementing solutions that transfer or mitigate those risks.
3. Insurance Brokers
The insurance brokerage industry, while influenced by insurance pricing cycles, benefits from durable secular tailwinds as rising risk complexity (climate, data privacy), regulatory scrutiny, and insurance pricing inflation. These increase demand for professional risk-management advice. Brokers operate models that rely on commissions and fees tied to premium volumes and growing contributions from recurring advisory, benefits, and compliance services. Scale is a key advantage, enabling better carrier access, stronger data and benchmarking, and efficient deployment of technology and compliance investments, which in turn supports ongoing industry consolidation. The headwinds are labor intensity and wage inflation for producers, regulatory complexity (this cuts both ways, as you can see), and execution risk when integrating new digital tools into legacy workflows.
Marsh & McLennan competes with other major professional services firms including Aon (NYSE:AON) and Willis Towers Watson (NASDAQ:WTW) in risk and insurance services, while its consulting businesses face competition from firms like Accenture (NYSE:ACN), McKinsey & Company, and Boston Consulting Group.
4. Revenue Growth
A company’s long-term sales performance is one signal of its overall quality. Even a bad business can shine for one or two quarters, but a top-tier one grows for years.
With $26.45 billion in revenue over the past 12 months, Marsh & McLennan is a behemoth in the business services sector and benefits from economies of scale, giving it an edge in distribution. This also enables it to gain more leverage on its fixed costs than smaller competitors and the flexibility to offer lower prices.
As you can see below, Marsh & McLennan’s 9.2% annualized revenue growth over the last five years was impressive. This is an encouraging starting point for our analysis because it shows Marsh & McLennan’s demand was higher than many business services companies.
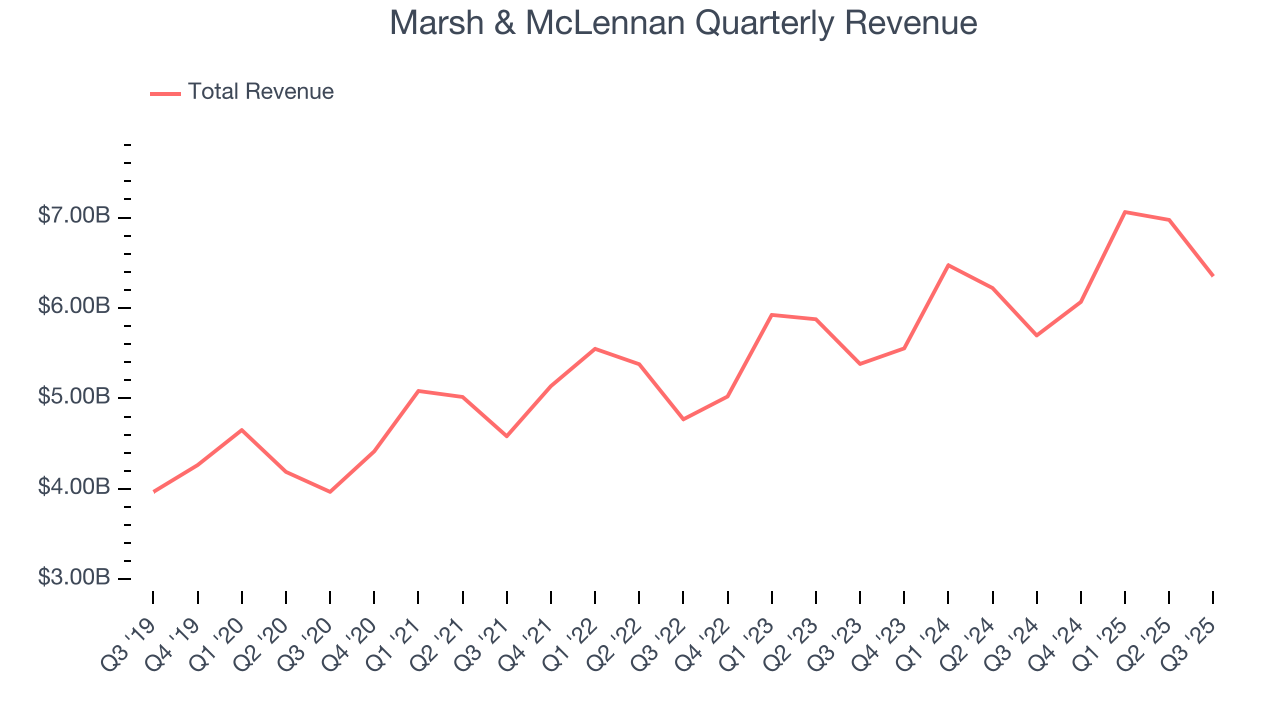
We at StockStory place the most emphasis on long-term growth, but within business services, a half-decade historical view may miss recent innovations or disruptive industry trends. Marsh & McLennan’s annualized revenue growth of 9.1% over the last two years aligns with its five-year trend, suggesting its demand was predictably strong. 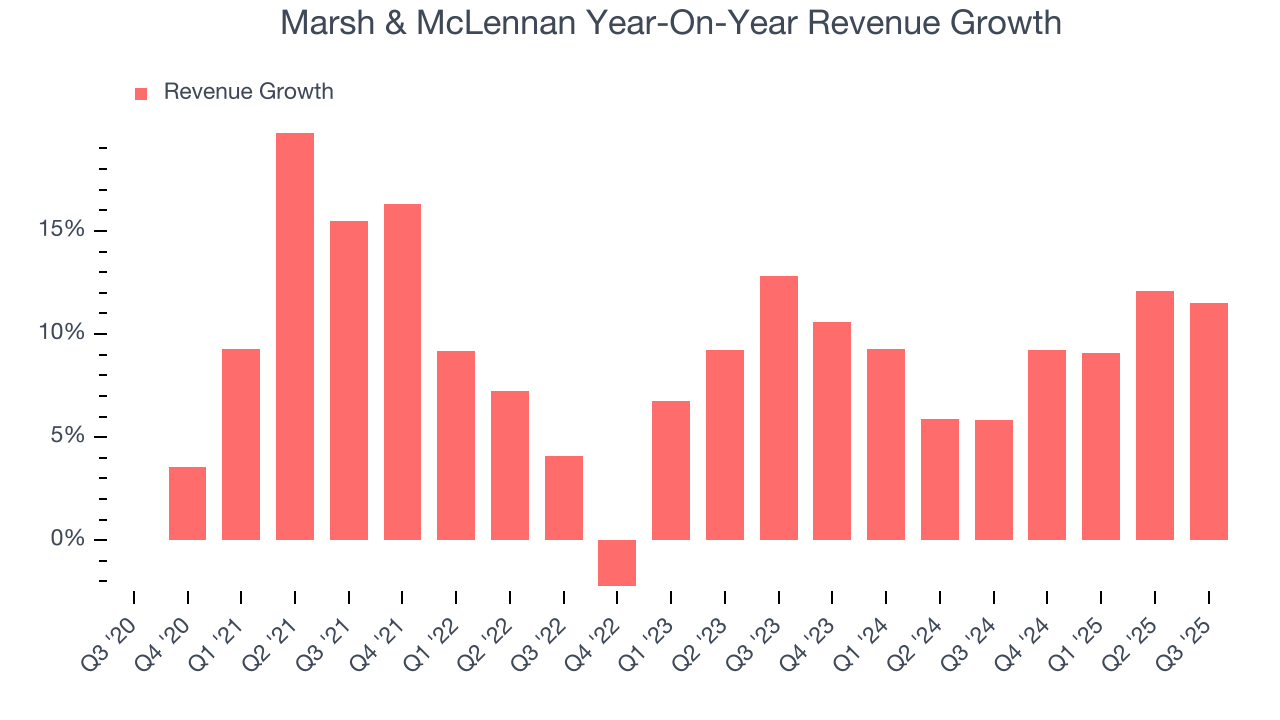
We can dig further into the company’s sales dynamics by analyzing its organic revenue, which strips out one-time events like acquisitions and currency fluctuations that don’t accurately reflect its fundamentals. Over the last two years, Marsh & McLennan’s organic revenue averaged 5.8% year-on-year growth. Because this number is lower than its two-year revenue growth, we can see that some mixture of acquisitions and foreign exchange rates boosted its headline results. 
This quarter, Marsh & McLennan’s year-on-year revenue growth was 11.5%, and its $6.35 billion of revenue was in line with Wall Street’s estimates.
Looking ahead, sell-side analysts expect revenue to grow 5.6% over the next 12 months, a deceleration versus the last two years. We still think its growth trajectory is satisfactory given its scale and suggests the market is forecasting success for its products and services.
5. Adjusted Operating Margin
Adjusted operating margin is one of the best measures of profitability because it tells us how much money a company takes home after subtracting all core expenses, like marketing and R&D. It also removes various one-time costs to paint a better picture of normalized profits.
Marsh & McLennan has been a well-oiled machine over the last five years. It demonstrated elite profitability for a business services business, boasting an average adjusted operating margin of 25.7%.
Looking at the trend in its profitability, Marsh & McLennan’s adjusted operating margin rose by 2.9 percentage points over the last five years, as its sales growth gave it operating leverage.
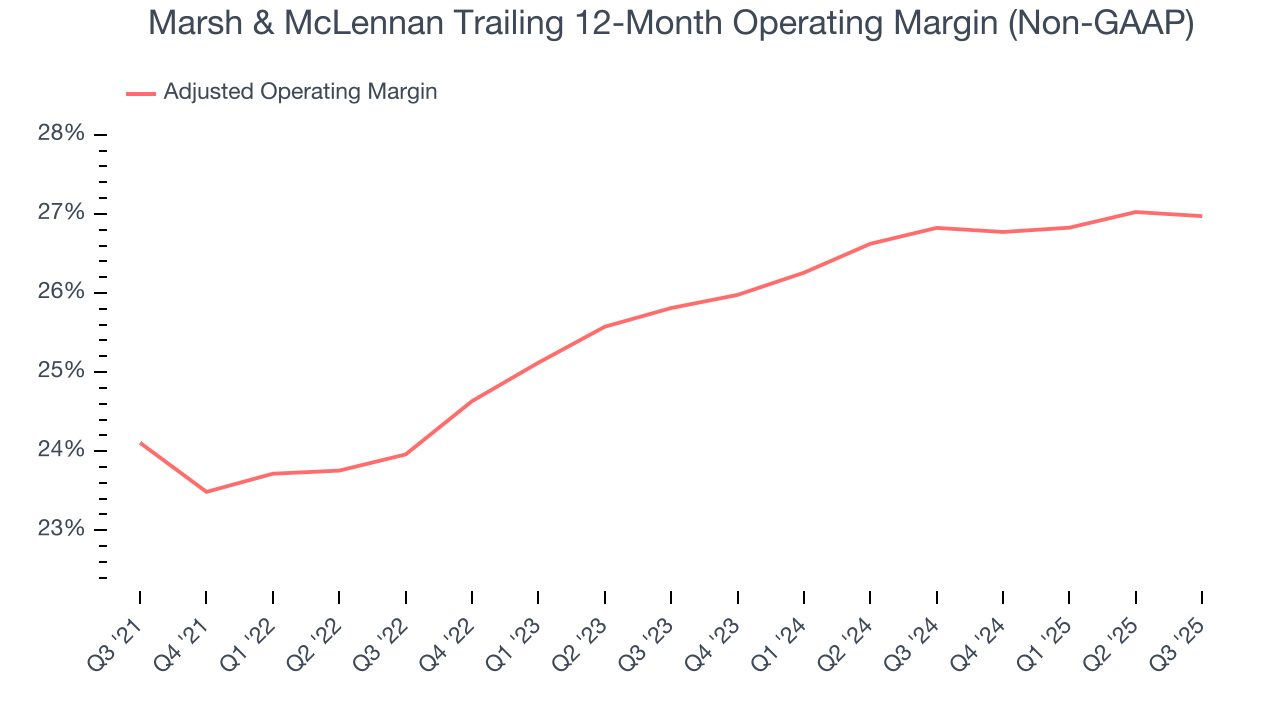
In Q3, Marsh & McLennan generated an adjusted operating margin profit margin of 22.7%, in line with the same quarter last year. This indicates the company’s overall cost structure has been relatively stable.
6. Earnings Per Share
We track the long-term change in earnings per share (EPS) for the same reason as long-term revenue growth. Compared to revenue, however, EPS highlights whether a company’s growth is profitable.
Marsh & McLennan’s EPS grew at a spectacular 13.8% compounded annual growth rate over the last five years, higher than its 9.2% annualized revenue growth. This tells us the company became more profitable on a per-share basis as it expanded.
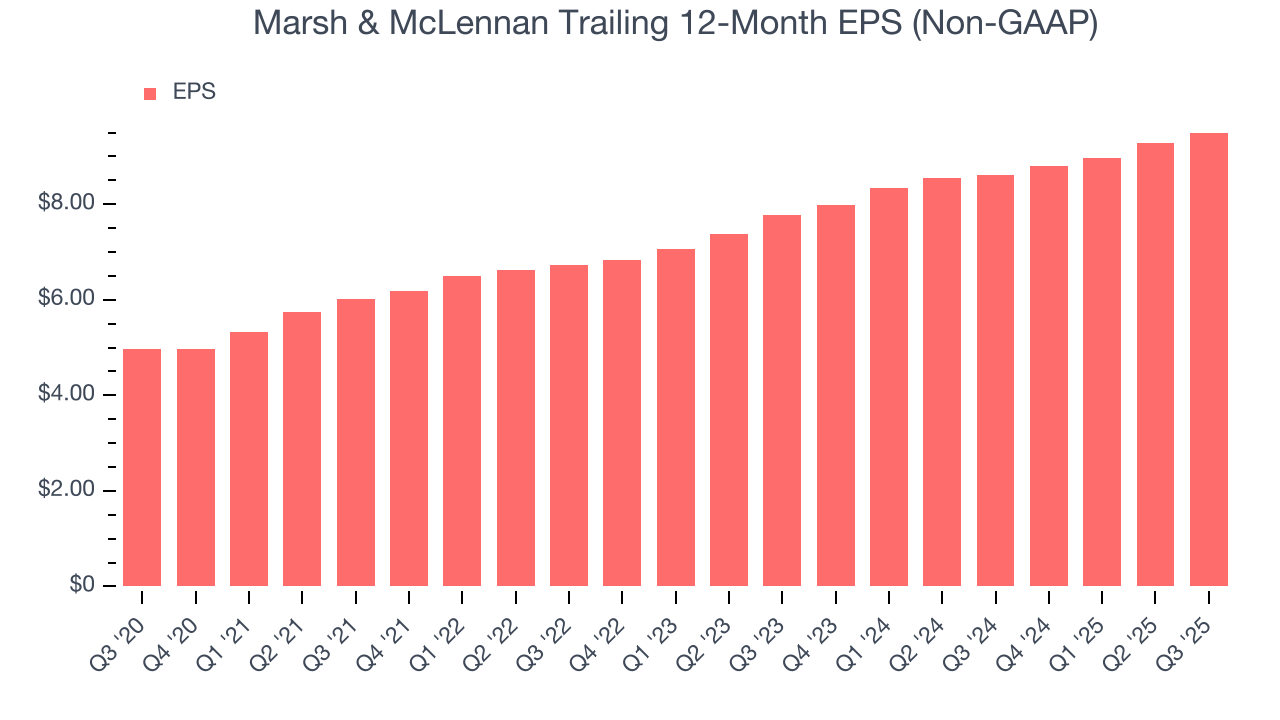
Diving into the nuances of Marsh & McLennan’s earnings can give us a better understanding of its performance. As we mentioned earlier, Marsh & McLennan’s adjusted operating margin was flat this quarter but expanded by 2.9 percentage points over the last five years. On top of that, its share count shrank by 3.3%. These are positive signs for shareholders because improving profitability and share buybacks turbocharge EPS growth relative to revenue growth. 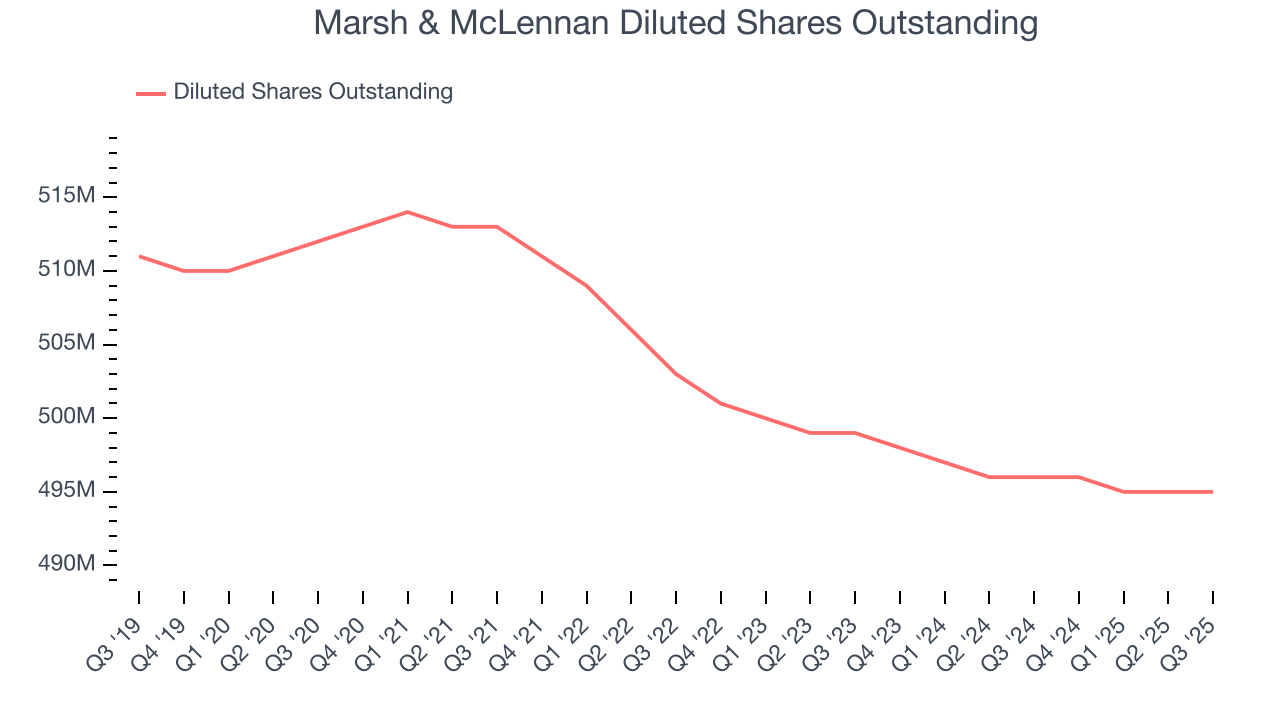
Like with revenue, we analyze EPS over a shorter period to see if we are missing a change in the business.
For Marsh & McLennan, its two-year annual EPS growth of 10.6% was lower than its five-year trend. This wasn’t great, but at least the company was successful in other measures of financial health.
In Q3, Marsh & McLennan reported adjusted EPS of $1.85, up from $1.63 in the same quarter last year. This print beat analysts’ estimates by 4.1%. Over the next 12 months, Wall Street expects Marsh & McLennan’s full-year EPS of $9.50 to grow 6.4%.
7. Cash Is King
If you’ve followed StockStory for a while, you know we emphasize free cash flow. Why, you ask? We believe that in the end, cash is king, and you can’t use accounting profits to pay the bills.
Marsh & McLennan has shown terrific cash profitability, enabling it to reinvest, return capital to investors, and stay ahead of the competition while maintaining an ample cushion. The company’s free cash flow margin was among the best in the business services sector, averaging 16.2% over the last five years.
Taking a step back, we can see that Marsh & McLennan’s margin expanded by 1.9 percentage points during that time. This is encouraging because it gives the company more optionality.
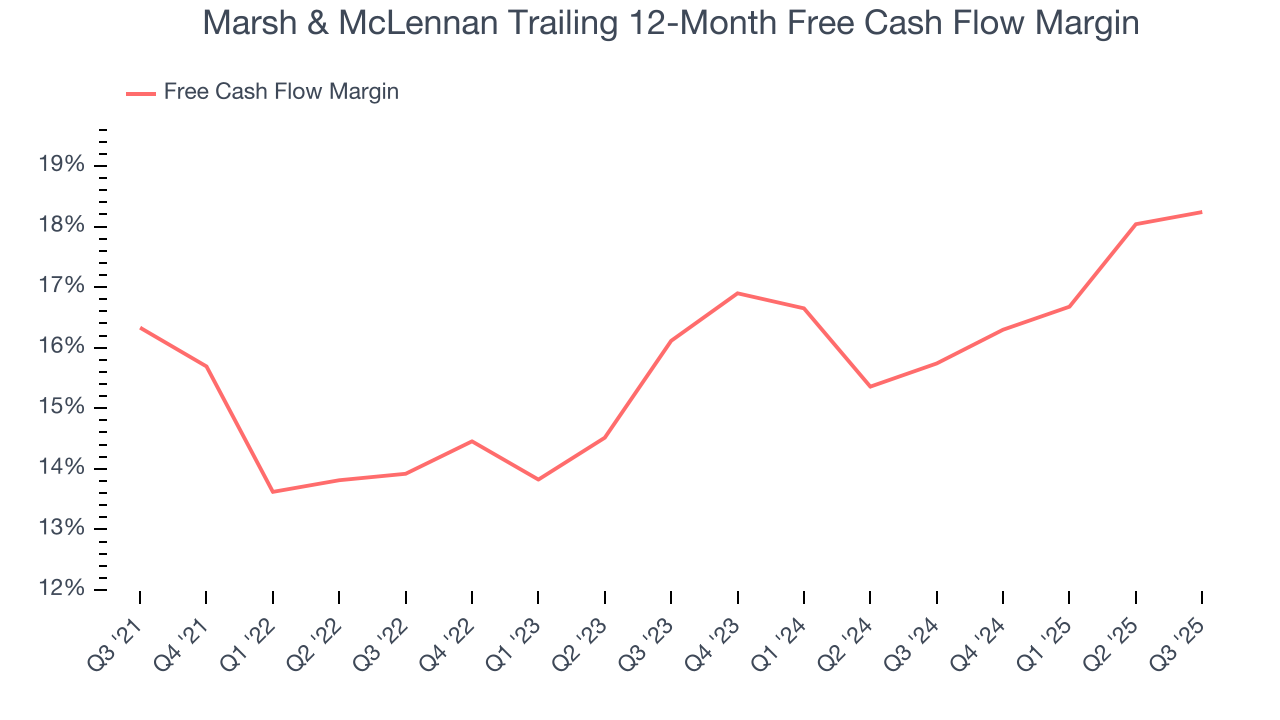
Marsh & McLennan’s free cash flow clocked in at $2.01 billion in Q3, equivalent to a 31.6% margin. This cash profitability was in line with the comparable period last year and above its five-year average.
8. Return on Invested Capital (ROIC)
EPS and free cash flow tell us whether a company was profitable while growing its revenue. But was it capital-efficient? A company’s ROIC explains this by showing how much operating profit it makes compared to the money it has raised (debt and equity).
Marsh & McLennan’s five-year average ROIC was 16.4%, beating other business services companies by a wide margin. This illustrates its management team’s ability to invest in attractive growth opportunities and produce tangible results for shareholders.
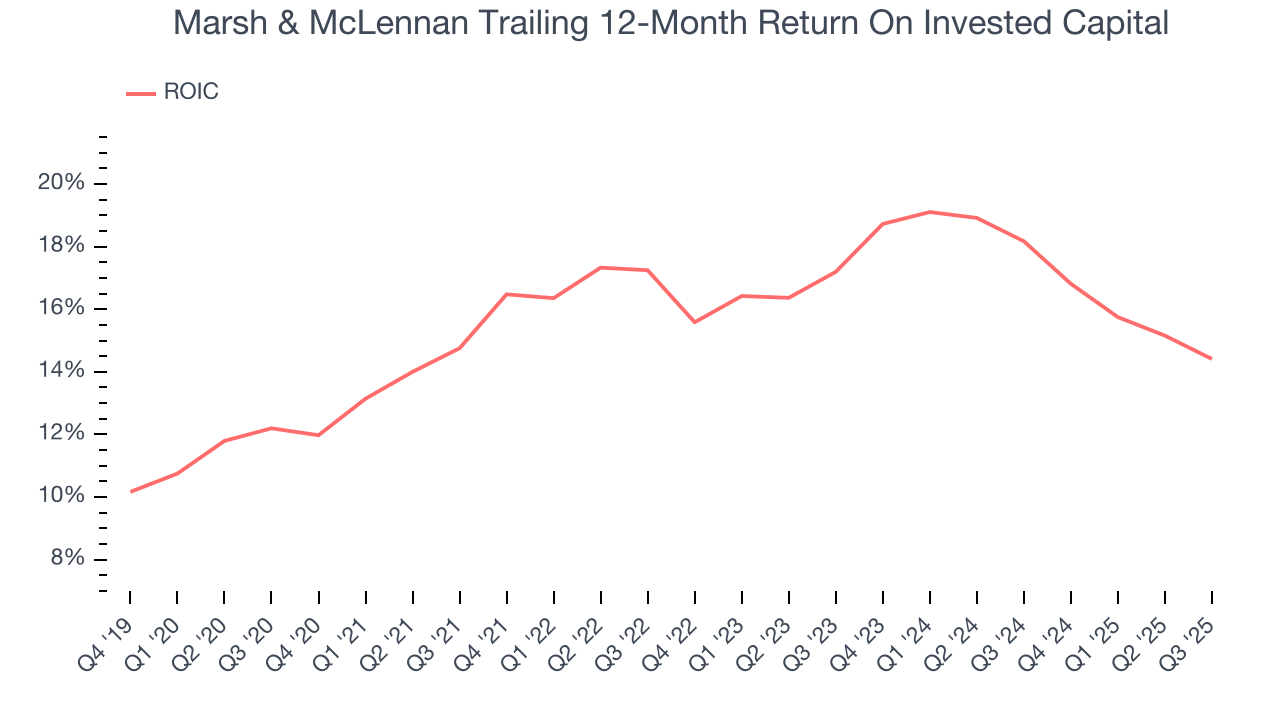
We like to invest in businesses with high returns, but the trend in a company’s ROIC is what often surprises the market and moves the stock price. Uneventfully, Marsh & McLennan’s ROIC has stayed the same over the last few years. Rising returns would be ideal, but this is still a noteworthy feat since they're already high.
9. Balance Sheet Assessment
Marsh & McLennan reported $2.51 billion of cash and $22.69 billion of debt on its balance sheet in the most recent quarter. As investors in high-quality companies, we primarily focus on two things: 1) that a company’s debt level isn’t too high and 2) that its interest payments are not excessively burdening the business.
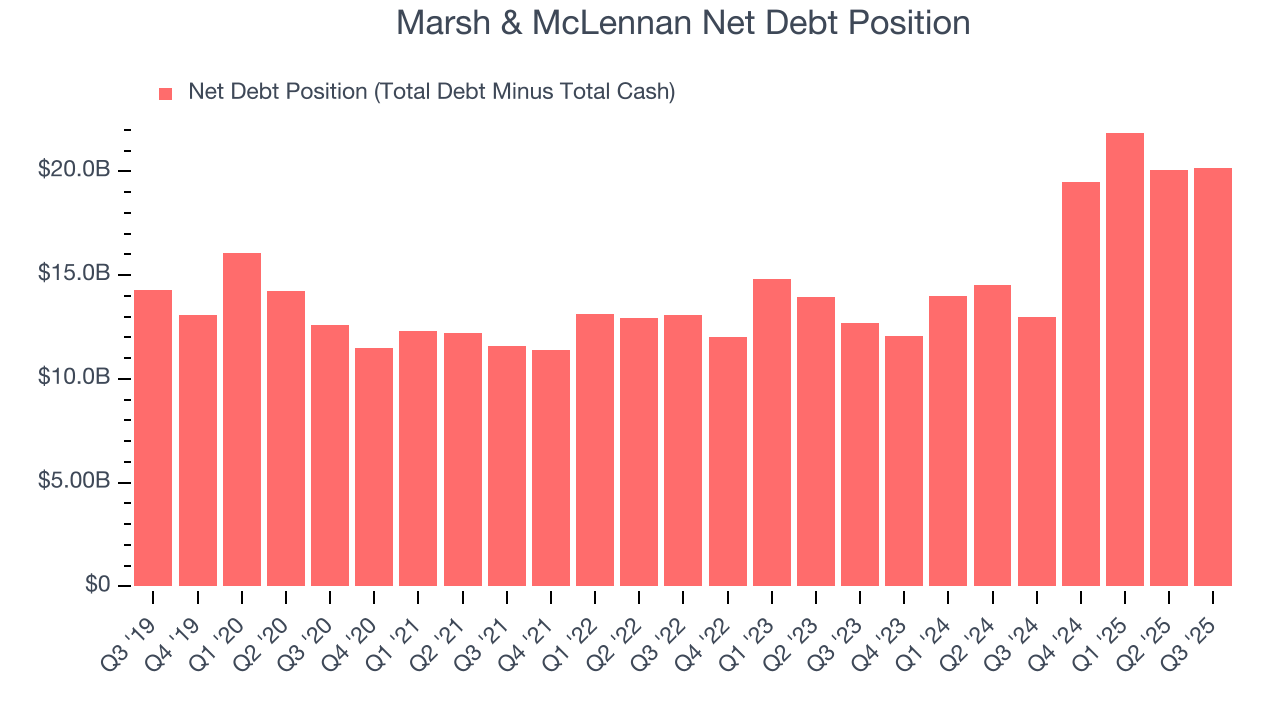
With $7.5 billion of EBITDA over the last 12 months, we view Marsh & McLennan’s 2.7× net-debt-to-EBITDA ratio as safe. We also see its $864 million of annual interest expenses as appropriate. The company’s profits give it plenty of breathing room, allowing it to continue investing in growth initiatives.
10. Key Takeaways from Marsh & McLennan’s Q3 Results
It was good to see Marsh & McLennan beat analysts’ EPS expectations this quarter. Overall, this print had some key positives. The stock remained flat at $185.80 immediately after reporting.
11. Is Now The Time To Buy Marsh & McLennan?
When considering an investment in Marsh & McLennan, investors should account for its valuation and business qualities as well as what’s happened in the latest quarter.
There’s plenty to admire about Marsh & McLennan. To kick things off, its revenue growth was impressive over the last five years. On top of that, Marsh & McLennan’s scale makes it a trusted partner with negotiating leverage, and its powerful free cash flow generation enables it to stay ahead of the competition through consistent reinvestment of profits.
Marsh & McLennan’s P/E ratio based on the next 12 months is 18.4x. When scanning the business services space, Marsh & McLennan trades at a fair valuation. If you’re a fan of the business and management team, now is a good time to scoop up some shares.
Wall Street analysts have a consensus one-year price target of $211.33 on the company (compared to the current share price of $185.80), implying they see 13.7% upside in buying Marsh & McLennan in the short term.