
MSCI (MSCI)
We aren’t fans of MSCI. Its negative returns on capital suggest it eroded shareholder value by squandering business opportunities.― StockStory Analyst Team
1. News


2. Summary
Why We Think MSCI Will Underperform
Originally known as Morgan Stanley Capital International before becoming independent in 2007, MSCI (NYSE:MSCI) provides critical decision support tools, indexes, and analytics that help global investors understand risk and return factors and build more effective investment portfolios.
- Negative return on equity shows that some of its growth strategies have backfired
- A consolation is that its performance over the past five years shows its incremental sales were more profitable, as its annual earnings per share growth of 17.2% outpaced its revenue gains


MSCI is in the doghouse. You should search for better opportunities.
Why There Are Better Opportunities Than MSCI


At $535.26 per share, MSCI trades at 27.4x forward P/E. This multiple is higher than most financials companies, and we think it’s quite expensive for the quality you get.
There are stocks out there similarly priced with better business quality. We prefer owning these.
3. MSCI (MSCI) Research Report: Q4 CY2025 Update
Investment analytics provider MSCI (NYSE:MSCI) met Wall Streets revenue expectations in Q4 CY2025, with sales up 10.6% year on year to $822.5 million. Its non-GAAP profit of $4.66 per share was 1.6% above analysts’ consensus estimates.
MSCI (MSCI) Q4 CY2025 Highlights:
- Revenue: $822.5 million vs analyst estimates of $824.9 million (10.6% year-on-year growth, in line)
- Pre-tax Profit: $388.8 million (47.3% margin)
- Adjusted EPS: $4.66 vs analyst estimates of $4.59 (1.6% beat)
- Market Capitalization: $43.71 billion
Company Overview
Originally known as Morgan Stanley Capital International before becoming independent in 2007, MSCI (NYSE:MSCI) provides critical decision support tools, indexes, and analytics that help global investors understand risk and return factors and build more effective investment portfolios.
MSCI's offerings span four main areas: indexes, analytics, ESG and climate solutions, and private assets data. The company's indexes, including the widely-followed MSCI World and Emerging Markets indexes, are used by asset managers to create investment products like ETFs, benchmark performance, and guide asset allocation decisions. When an investor buys an ETF tracking an MSCI index, the fund provider pays MSCI a fee based on assets under management.
Beyond indexes, MSCI provides sophisticated risk management and portfolio analysis tools that help investors measure and manage exposure across markets, asset classes, and risk factors. For example, a pension fund might use MSCI's RiskManager to stress-test how their portfolio would perform under various market scenarios, or BarraOne to understand their exposure to specific investment factors like value or momentum.
As sustainability has become a critical investment consideration, MSCI's ESG and climate solutions help investors evaluate companies' environmental, social, and governance practices. The company's ESG ratings assess over 10,000 companies worldwide on industry-specific sustainability risks, while its climate tools help investors measure portfolio carbon exposure and alignment with temperature targets.
For private markets, MSCI offers data and analytics on real estate and private equity investments, enabling comparison across both public and private assets. These tools help institutional investors track transaction data, analyze performance drivers, and assess climate risks in private portfolios.
MSCI operates on a subscription-based model for most offerings, with additional asset-based fees from investment products that track its indexes. This creates a stable revenue stream that grows as the investment industry increasingly relies on data-driven decision making.
4. Financial Exchanges & Data
Financial exchanges and data providers operate trading platforms and sell market information. They enjoy relatively stable revenue from trading fees and subscriptions, increasing demand for data analytics, and expansion opportunities in emerging markets. Challenges include regulatory oversight of market structure, competition from alternative trading venues, and substantial technology investments needed to maintain low-latency trading infrastructure and data security.
MSCI's primary competitors include S&P Dow Jones Indices (a joint venture of S&P Global and CME Group), FTSE Russell (owned by London Stock Exchange Group), and Bloomberg in the index space. In analytics, the company competes with BlackRock Solutions, FactSet, and Axioma (part of SimCorp), while its ESG offerings face competition from Sustainalytics (owned by Morningstar), ISS (majority owned by Deutsche Börse), and Moody's.
5. Revenue Growth
A company’s long-term sales performance can indicate its overall quality. Even a bad business can shine for one or two quarters, but a top-tier one grows for years. Luckily, MSCI’s revenue grew at a solid 13.1% compounded annual growth rate over the last five years. Its growth beat the average financials company and shows its offerings resonate with customers.
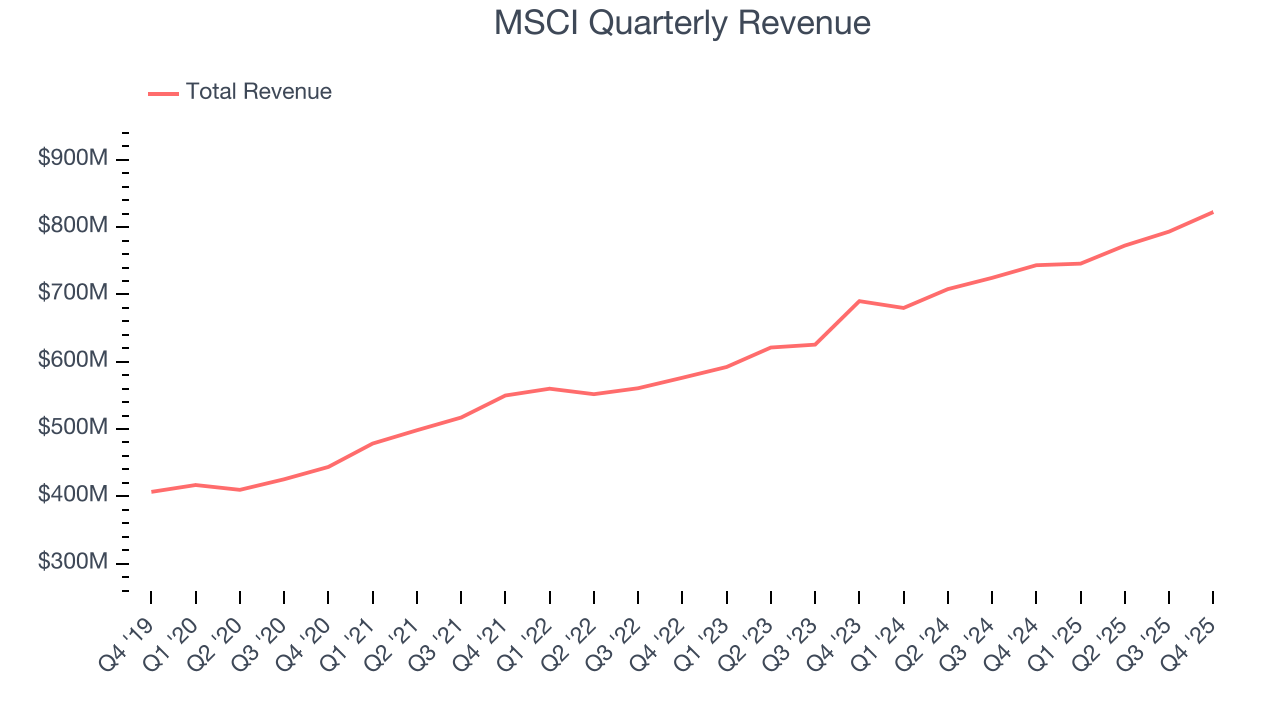
We at StockStory place the most emphasis on long-term growth, but within financials, a half-decade historical view may miss recent interest rate changes, market returns, and industry trends. MSCI’s annualized revenue growth of 11.3% over the last two years is below its five-year trend, but we still think the results suggest healthy demand. 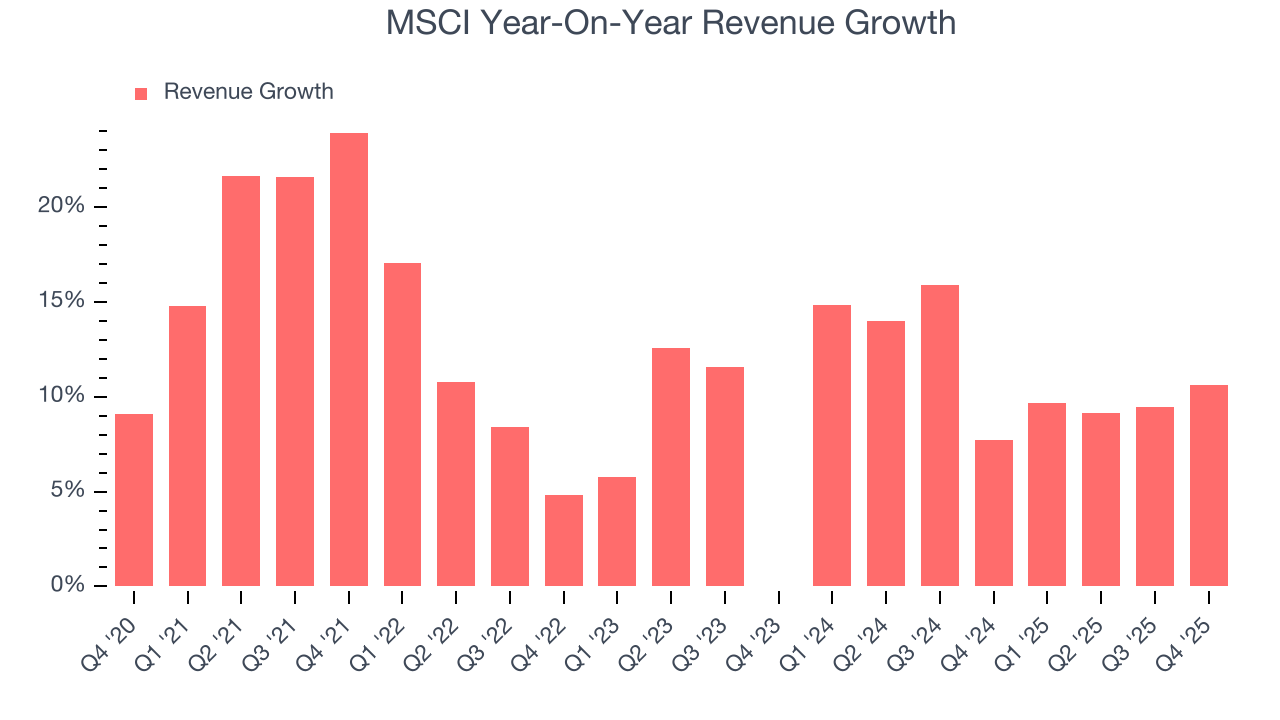 Note: Quarters not shown were determined to be outliers, impacted by outsized investment gains/losses that are not indicative of the recurring fundamentals of the business.
This quarter, MSCI’s year-on-year revenue growth was 10.6%, and its $822.5 million of revenue was in line with Wall Street’s estimates.
6. Pre-Tax Profit Margin
Revenue growth is one major determinant of business quality, and the efficiency of operations is another. For Financial Exchanges & Data companies, we look at pre-tax profit rather than the operating margin that defines sectors such as consumer, tech, and industrials.
Interest income and expenses play a big role in financial institutions' profitability, so they should be factored into the definition of profit. Taxes, however, should not as they are largely out of a company's control. This is pre-tax profit by definition.
Over the last five years, MSCI’s pre-tax profit margin has fallen by 7.2 percentage points, going from 42% to 47.7%. However, the company gave back some of its expense savings as its pre-tax profit margin declined by 6.5 percentage points on a two-year basis.
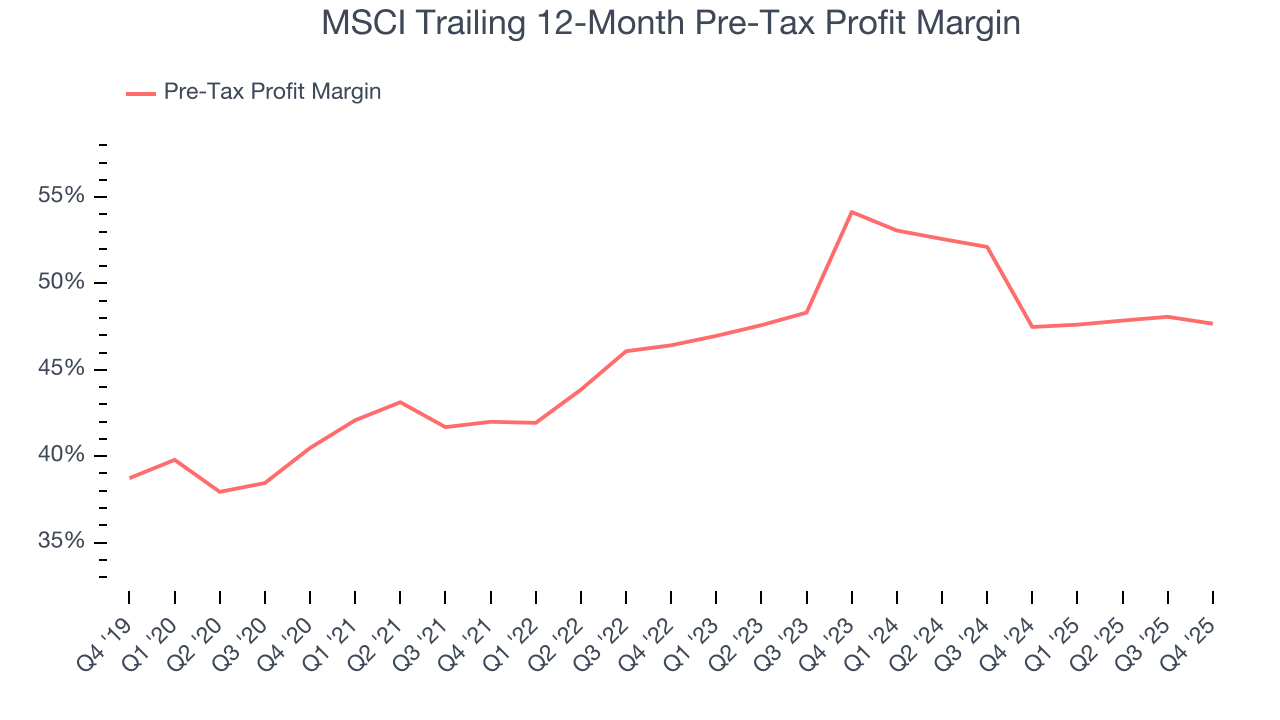
MSCI’s pre-tax profit margin came in at 47.3% this quarter. This result was 1.6 percentage points worse than the same quarter last year.
7. Earnings Per Share
Revenue trends explain a company’s historical growth, but the long-term change in earnings per share (EPS) points to the profitability of that growth – for example, a company could inflate its sales through excessive spending on advertising and promotions.
MSCI’s EPS grew at a remarkable 17.2% compounded annual growth rate over the last five years, higher than its 13.1% annualized revenue growth. This tells us the company became more profitable on a per-share basis as it expanded.
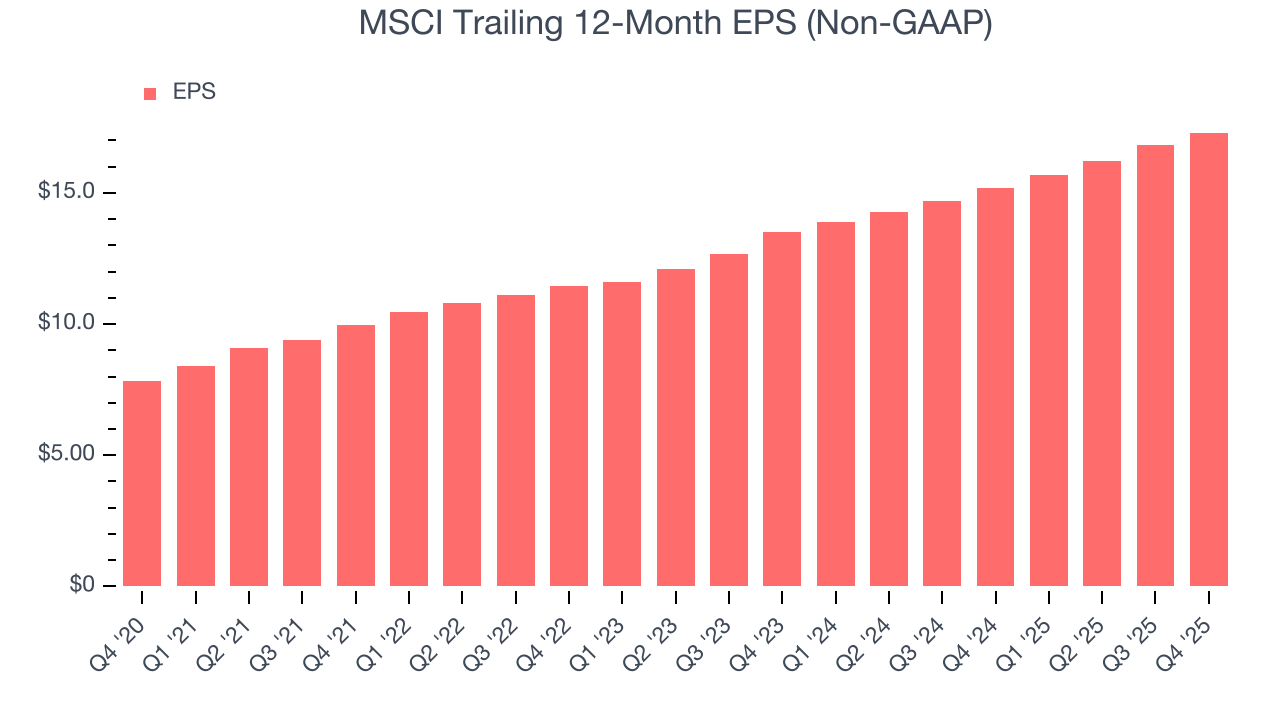
Like with revenue, we analyze EPS over a more recent period because it can provide insight into an emerging theme or development for the business.
For MSCI, its two-year annual EPS growth of 13.1% was lower than its five-year trend. We still think its growth was good and hope it can accelerate in the future.
In Q4, MSCI reported adjusted EPS of $4.66, up from $4.18 in the same quarter last year. This print beat analysts’ estimates by 1.7%. Over the next 12 months, Wall Street expects MSCI’s full-year EPS of $17.30 to grow 12%.
8. Return on Equity
Return on equity, or ROE, quantifies bank profitability relative to shareholder equity - an essential capital source for these institutions. Over extended periods, superior ROE performance drives faster shareholder wealth compounding through reinvestment, share repurchases, and dividend growth.
Over the last five years, MSCI has averaged an ROE of negative 143%, a bad result not only in absolute terms but also relative to the majority of firms putting up 25%+. It also shows that MSCI has little to no competitive moat.
9. Balance Sheet Assessment
The debt-to-equity ratio is a widely used measure to assess a company's balance sheet health. A higher ratio means that a business aggressively financed its growth with debt. This can result in higher earnings (if the borrowed funds are invested profitably) but also increases risk.
If debt levels are too high, there could be difficulties in meeting obligations, especially during economic downturns or periods of rising interest rates if the debt has variable-rate payments.
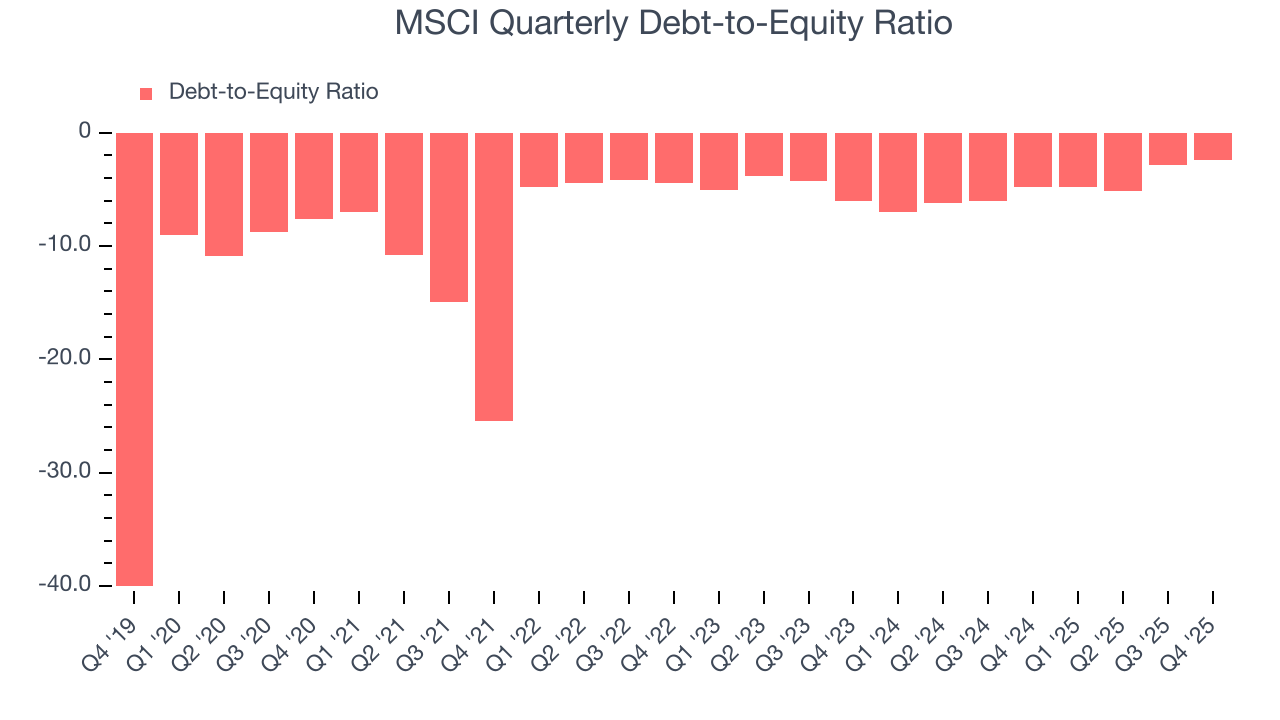
MSCI currently has $6.31 billion of debt and $2.65 billion of shareholder's equity on its balance sheet, and over the past four quarters, has averaged a debt-to-equity ratio of negative 3.8×. We think this is safe and raises no red flags. In general, we’re comfortable with any ratio below 3.5× for a financials business.
10. Key Takeaways from MSCI’s Q4 Results
Revenue was just in line, and EPS managed to beat by a bit. Overall, there wasn't too much to get excited about this quarter. Investors seem to be hoping for more, and shares traded down 3.5% to $561.66 immediately following the results.
11. Is Now The Time To Buy MSCI?
Updated: March 27, 2026 at 12:37 AM EDT
Before investing in or passing on MSCI, we urge you to understand the company’s business quality (or lack thereof), valuation, and the latest quarterly results - in that order.
MSCI isn’t a terrible business, but it isn’t one of our picks. Although its revenue growth was solid over the last five years, it’s expected to deteriorate over the next 12 months and its relatively low ROE suggests management has struggled to find compelling investment opportunities.
MSCI’s P/E ratio based on the next 12 months is 27.4x. This multiple tells us a lot of good news is priced in - we think other companies feature superior fundamentals at the moment.
Wall Street analysts have a consensus one-year price target of $678.31 on the company (compared to the current share price of $535.26).
Although the price target is bullish, readers should exercise caution because analysts tend to be overly optimistic. The firms they work for, often big banks, have relationships with companies that extend into fundraising, M&A advisory, and other rewarding business lines. As a result, they typically hesitate to say bad things for fear they will lose out. We at StockStory do not suffer from such conflicts of interest, so we’ll always tell it like it is.