
Butterfield Bank (NTB)
Butterfield Bank doesn’t excite us. Its sluggish sales growth shows demand is soft, a worrisome sign for investors in high-quality stocks.― StockStory Analyst Team
1. News


2. Summary
Why Butterfield Bank Is Not Exciting
Founded in 1784 as one of the oldest banks in the Western Hemisphere, Butterfield Bank (NYSE:NTB) provides banking, wealth management, and trust services to individuals and businesses in select offshore financial centers including Bermuda, Cayman Islands, and the Channel Islands.
- Forecasted net interest income decline of 43.1% for the upcoming 12 months implies demand will fall off a cliff
- Weak unit economics are reflected in its net interest margin of 2.7%, one of the worst among bank companies
- On the bright side, its stellar return on equity showcases management’s ability to surface highly profitable business ventures


Butterfield Bank’s quality is not up to our standards. We believe there are better opportunities elsewhere.
Why There Are Better Opportunities Than Butterfield Bank


Butterfield Bank is trading at $50.50 per share, or 1.8x forward P/B. Not only does Butterfield Bank trade at a premium to companies in the banking space, but this multiple is also high for its top-line growth.
We’d rather invest in similarly-priced but higher-quality companies with more reliable earnings growth.
3. Butterfield Bank (NTB) Research Report: Q3 CY2025 Update
Offshore banking group Butterfield Bank (NYSE:NTB) reported Q3 CY2025 results topping the market’s revenue expectations, with sales up 6.3% year on year to $153.3 million. Its non-GAAP profit of $1.51 per share was 15% above analysts’ consensus estimates.
Butterfield Bank (NTB) Q3 CY2025 Highlights:
- Net Interest Income: $92.7 million vs analyst estimates of $92.05 million (5.3% year-on-year growth, 0.7% beat)
- Net Interest Margin: 2.7% vs analyst estimates of 2.7% (5.5 basis point beat)
- Revenue: $153.3 million vs analyst estimates of $148.8 million (6.3% year-on-year growth, 3% beat)
- Efficiency Ratio: 56.2% vs analyst estimates of 60.7% (450 basis point beat)
- Adjusted EPS: $1.51 vs analyst estimates of $1.31 (15% beat)
- Tangible Book Value per Share: $25.06 vs analyst estimates of $24.52 (14.4% year-on-year growth, 2.2% beat)
- Market Capitalization: $1.72 billion
Company Overview
Founded in 1784 as one of the oldest banks in the Western Hemisphere, Butterfield Bank (NYSE:NTB) provides banking, wealth management, and trust services to individuals and businesses in select offshore financial centers including Bermuda, Cayman Islands, and the Channel Islands.
Butterfield operates through three main geographic segments: Bermuda, the Cayman Islands, and the Channel Islands & UK, with additional operations in The Bahamas, Canada, Mauritius, Singapore, and Switzerland. The bank maintains a deposit-led business model with a strong liquidity profile, typically maintaining significant excess deposits over loans throughout market cycles.
The company's services span retail, commercial, and private banking, offering products such as deposit accounts, residential and commercial mortgages, consumer loans, credit cards, and foreign exchange services. For high-net-worth individuals and institutional clients, Butterfield provides comprehensive wealth management through three specialized business lines: trust services, private banking, and asset management.
Trust services help clients with estate planning, succession planning, and administration of complex asset holdings. A corporate client might use Butterfield's trust services to establish and administer an employee benefits plan across multiple jurisdictions. The private banking division offers tailored financial solutions to wealthy individuals and families, while asset management provides portfolio management primarily for clients with investable assets exceeding $1 million for individuals and $10 million for institutions.
Butterfield generates revenue through interest income on loans and investments, fees from wealth management services, foreign exchange transactions, and custody administration. The bank's investment portfolio consists primarily of securities issued or guaranteed by the U.S. government or federal agencies, maintaining investment-grade quality to balance its large deposit base with relatively lower lending demand in its markets.
4. Regional Banks
Regional banks, financial institutions operating within specific geographic areas, serve as intermediaries between local depositors and borrowers. They benefit from rising interest rates that improve net interest margins (the difference between loan yields and deposit costs), digital transformation reducing operational expenses, and local economic growth driving loan demand. However, these banks face headwinds from fintech competition, deposit outflows to higher-yielding alternatives, credit deterioration (increasing loan defaults) during economic slowdowns, and regulatory compliance costs. Recent concerns about regional bank stability following high-profile failures and significant commercial real estate exposure present additional challenges.
Butterfield Bank's primary competitors include HSBC Bank Bermuda in the Bermuda market, while in the Cayman Islands it competes mainly with Scotiabank and CIBC FirstCaribbean. In its wealth management and trust businesses, it faces competition from international financial institutions operating in offshore financial centers.
5. Sales Growth
Two primary revenue streams drive bank earnings. While net interest income, which is earned by charging higher rates on loans than paid on deposits, forms the foundation, fee-based services across banking, credit, wealth management, and trading operations provide additional income. Regrettably, Butterfield Bank’s revenue grew at a mediocre 3% compounded annual growth rate over the last five years. This was below our standard for the banking sector and is a rough starting point for our analysis.
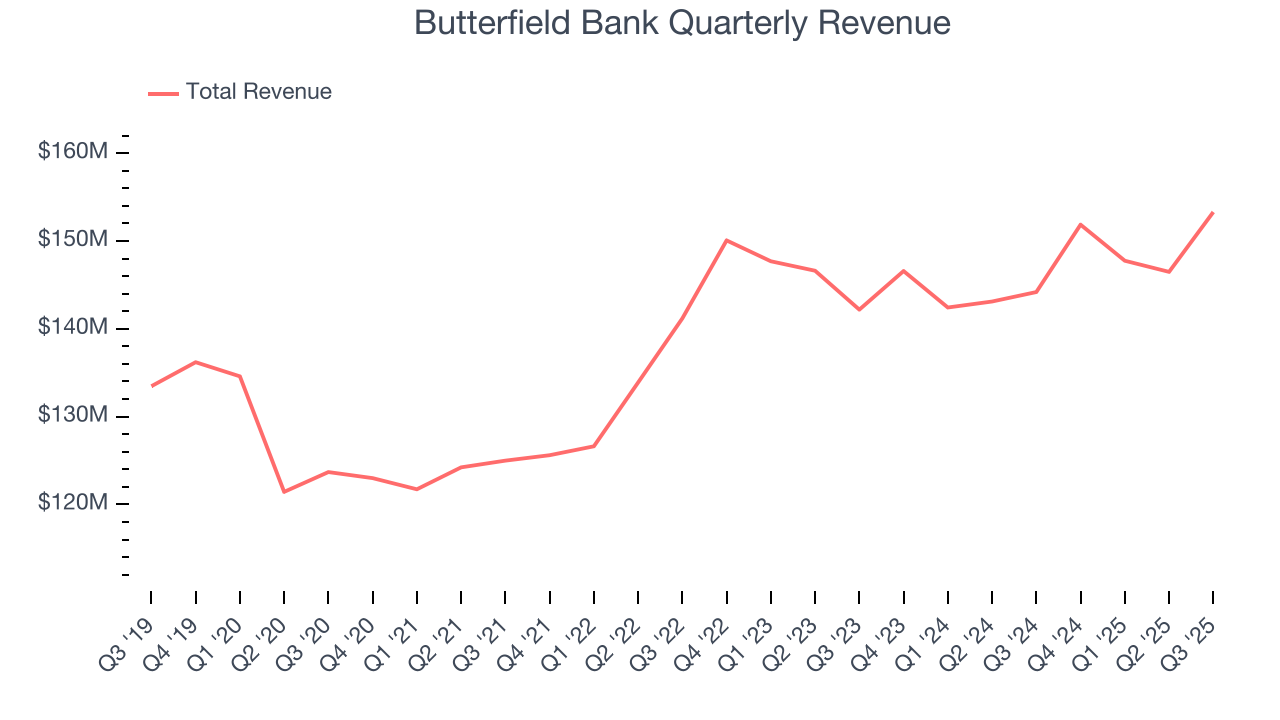
We at StockStory place the most emphasis on long-term growth, but within financials, a half-decade historical view may miss recent interest rate changes, market returns, and industry trends. Butterfield Bank’s recent performance shows its demand has slowed as its annualized revenue growth of 1.1% over the last two years was below its five-year trend. 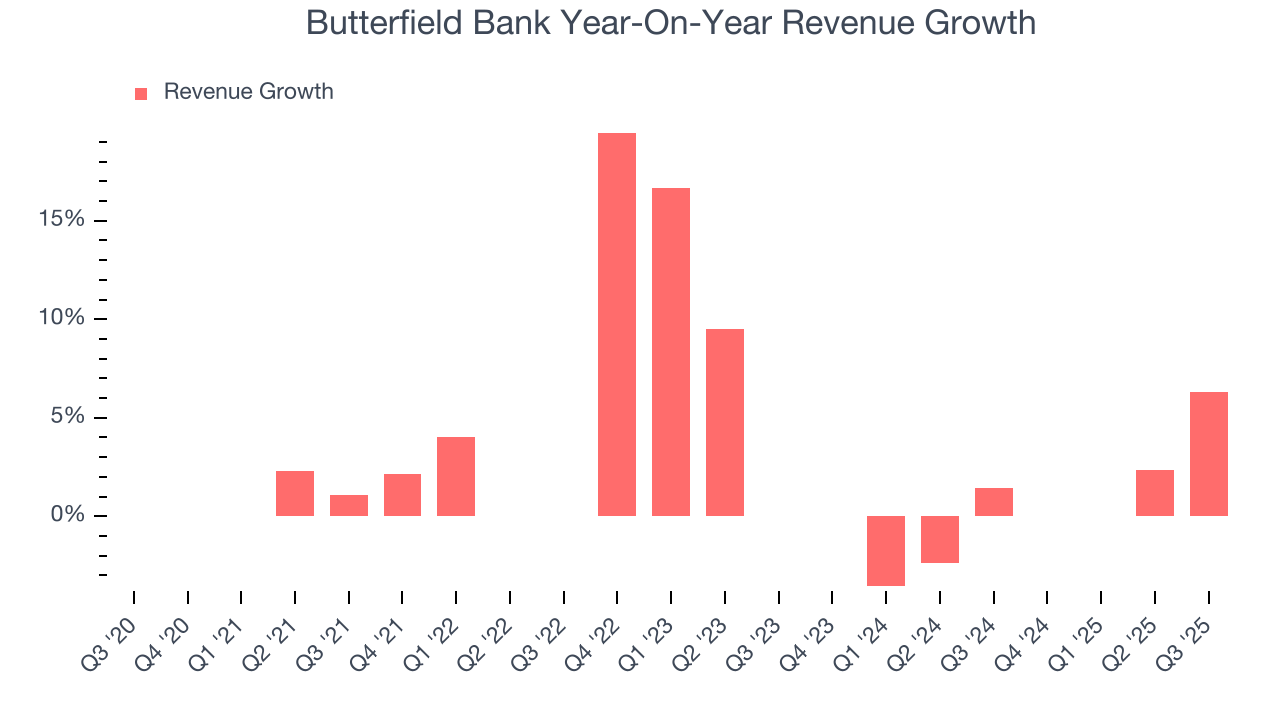 Note: Quarters not shown were determined to be outliers, impacted by outsized investment gains/losses that are not indicative of the recurring fundamentals of the business.
This quarter, Butterfield Bank reported year-on-year revenue growth of 6.3%, and its $153.3 million of revenue exceeded Wall Street’s estimates by 3%.
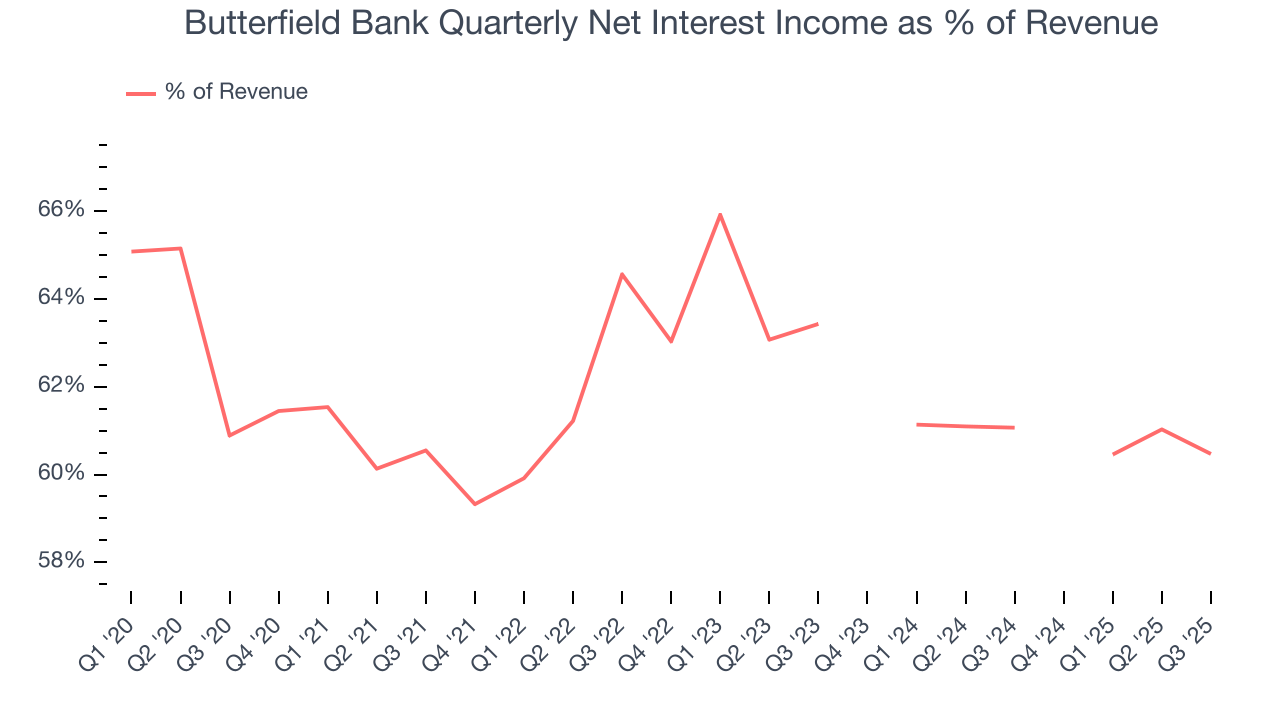
Net interest income made up 79.6% of the company’s total revenue during the last five years, meaning lending operations are Butterfield Bank’s largest source of revenue.
 Note: Quarters not shown were determined to be outliers, impacted by outsized investment gains/losses that are not indicative of the recurring fundamentals of the business.
Markets consistently prioritize net interest income growth over fee-based revenue, recognizing its superior quality and recurring nature compared to the more unpredictable non-interest income streams.
6. Efficiency Ratio
Topline growth is certainly important, but the overall profitability of this growth matters for the bottom line. For banks, we look at efficiency ratio, which is non-interest expense (salaries, rent, IT, marketing, excluding interest paid out to depositors) as a percentage of total revenue.
Investors place greater emphasis on efficiency ratio movements than absolute values, understanding that expense structures reflect revenue mix variations. Lower ratios represent better operational performance since they show banks generating more revenue per dollar of expense.
Over the last five years, Butterfield Bank’s efficiency ratio has swelled by 7.1 percentage points, going from 65.8% to 59%. Said differently, the company’s expenses have grown at a slower rate than revenue, which typically signals prudent management.
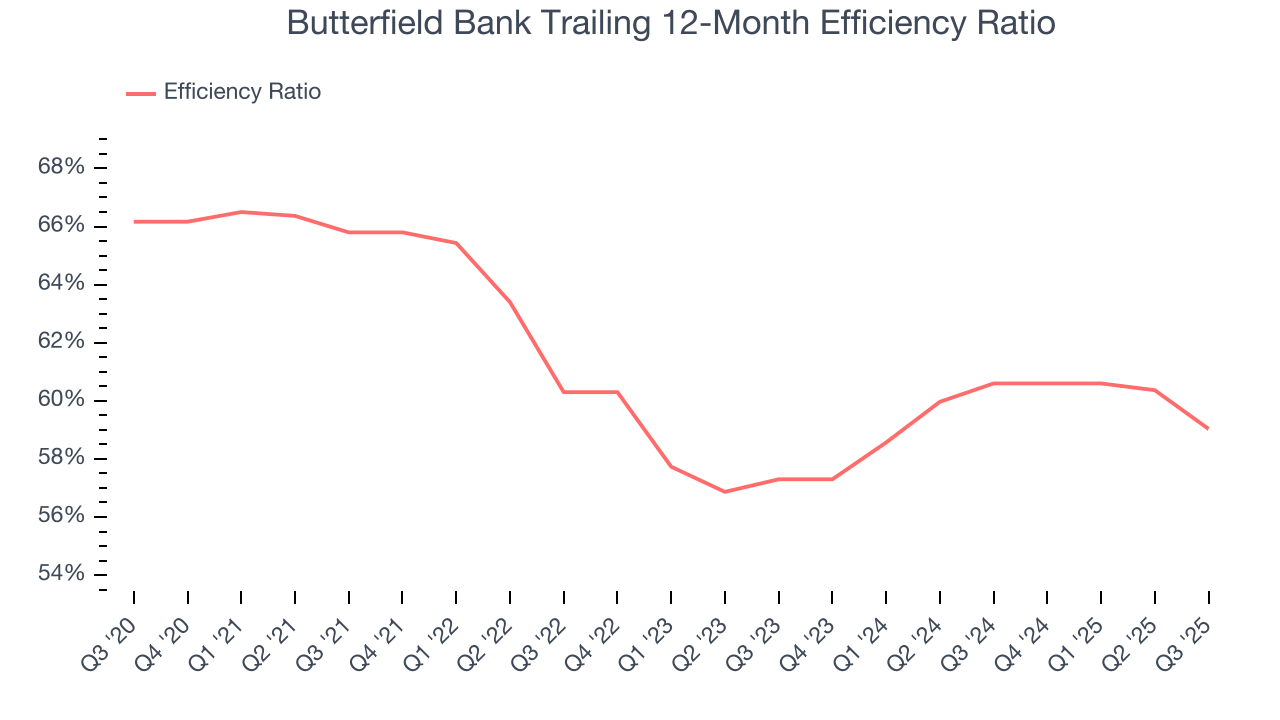
In Q3, Butterfield Bank’s efficiency ratio was 56.2%, beating analysts’ expectations by 450 basis points (100 basis points = 1 percentage point). This result was 4 percentage points better than the same quarter last year.
For the next 12 months, Wall Street expects Butterfield Bank to become less profitable as it anticipates an efficiency ratio of 63.1%.
7. Earnings Per Share
We track the long-term change in earnings per share (EPS) for the same reason as long-term revenue growth. Compared to revenue, however, EPS highlights whether a company’s growth is profitable.
Butterfield Bank’s EPS grew at an astounding 12.1% compounded annual growth rate over the last five years, higher than its 3% annualized revenue growth. However, this alone doesn’t tell us much about its business quality because its efficiency ratio didn’t improve.
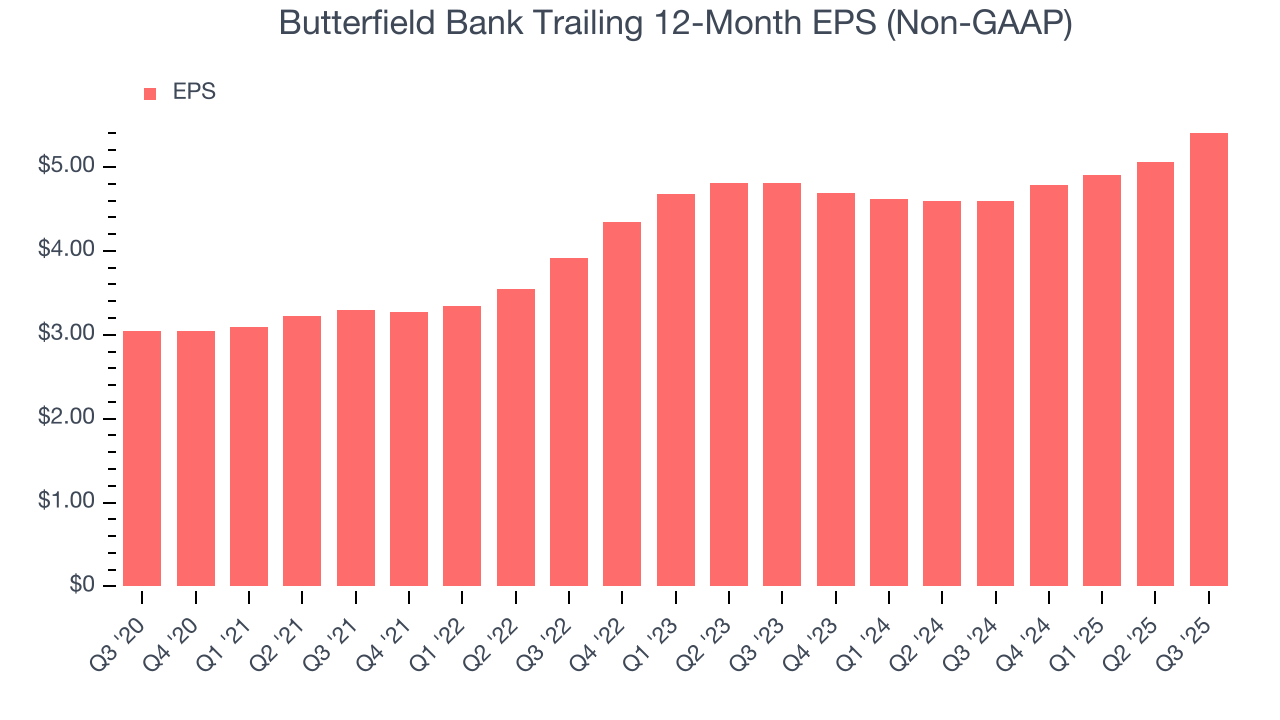
Like with revenue, we analyze EPS over a more recent period because it can provide insight into an emerging theme or development for the business.
For Butterfield Bank, its two-year annual EPS growth of 6.1% was lower than its five-year trend. We still think its growth was good and hope it can accelerate in the future.
In Q3, Butterfield Bank reported adjusted EPS of $1.51, up from $1.16 in the same quarter last year. This print easily cleared analysts’ estimates, and shareholders should be content with the results. Over the next 12 months, Wall Street expects Butterfield Bank’s full-year EPS of $5.41 to shrink by 6.6%.
8. Tangible Book Value Per Share (TBVPS)
Banks operate as balance sheet businesses, with profits generated through borrowing and lending activities. Valuations reflect this reality, emphasizing balance sheet strength and long-term book value compounding ability.
This explains why tangible book value per share (TBVPS) stands as the premier banking metric. TBVPS strips away questionable intangible assets, revealing concrete per-share net worth that investors can trust. On the other hand, EPS is often distorted by mergers and flexible loan loss accounting. TBVPS provides clearer performance insights.
Butterfield Bank’s TBVPS grew at a solid 6.7% annual clip over the last five years. TBVPS growth has also accelerated recently, growing by 18.9% annually over the last two years from $17.73 to $25.06 per share.
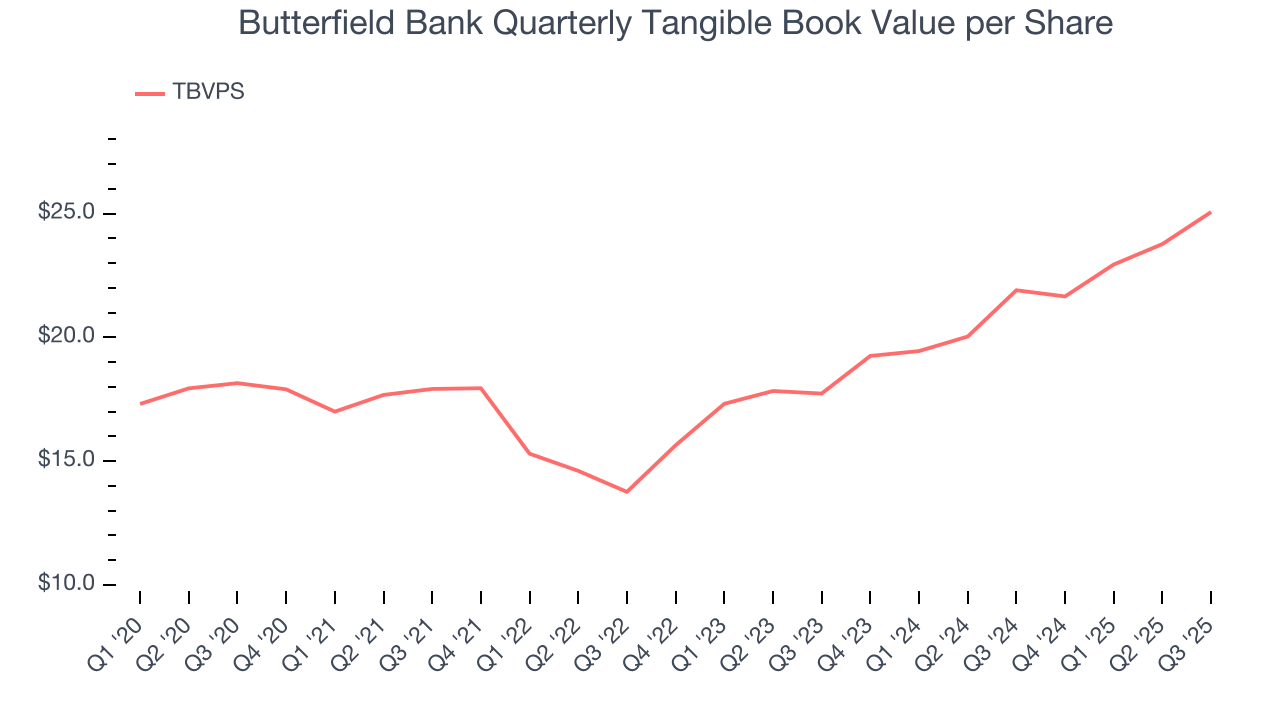
Over the next 12 months, Consensus estimates call for Butterfield Bank’s TBVPS to grow by 9.9% to $27.55, solid growth rate.
9. Balance Sheet Assessment
Leverage is core to a financial firm’s business model (loans funded by deposits). To ensure economic stability and avoid a repeat of the 2008 GFC, regulators require certain levels of capital and liquidity, focusing on the Tier 1 capital ratio.
Tier 1 capital is the highest-quality capital that a firm holds, consisting primarily of common stock and retained earnings, but also physical gold. It serves as the primary cushion against losses and is the first line of defense in times of financial distress.
This capital is divided by risk-weighted assets to derive the Tier 1 capital ratio. Risk-weighted means that cash and US treasury securities are assigned little risk while unsecured consumer loans and equity investments get much higher risk weights, for example.
New regulation after the 2008 financial crisis requires that all firms must maintain a Tier 1 capital ratio greater than 4.5%. On top of this, there are additional buffers based on scale, risk profile, and other regulatory classifications, so that at the end of the day, firms generally must maintain a 7-10% ratio at minimum.
Over the last two years, Butterfield Bank has averaged a Tier 1 capital ratio of 24%, which is considered safe and well capitalized in the event that macro or market conditions suddenly deteriorate.
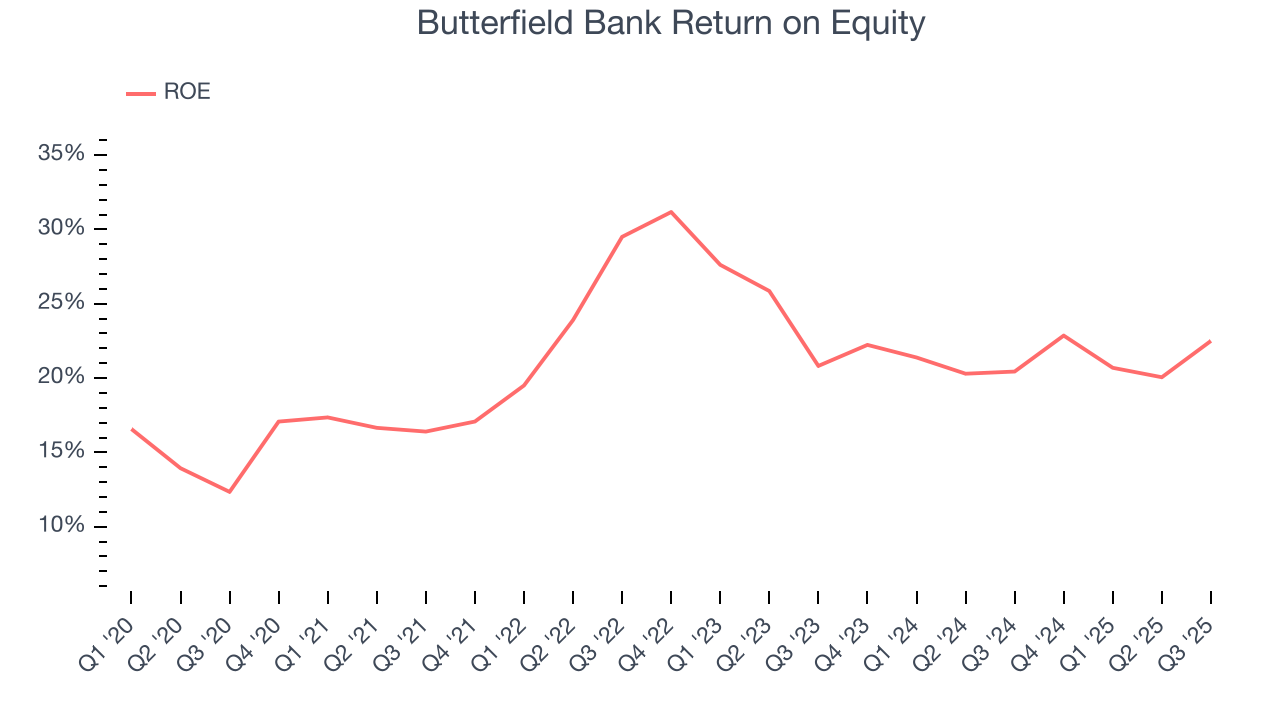
10. Return on Equity
Return on equity (ROE) reveals the profit generated per dollar of shareholder equity, which represents a key source of bank funding. Banks maintaining elevated ROE levels tend to accelerate wealth creation for shareholders via earnings retention, buybacks, and distributions.
Over the last five years, Butterfield Bank has averaged an ROE of 21.7%, exceptional for a company operating in a sector where the average shakes out around 7.5% and those putting up 15%+ are greatly admired. This is a bright spot for Butterfield Bank.
11. Key Takeaways from Butterfield Bank’s Q3 Results
It was good to see Butterfield Bank beat analysts’ EPS expectations this quarter. We were also glad its revenue outperformed Wall Street’s estimates. Overall, we think this was a solid quarter with some key areas of upside. The stock traded up 4.2% to $43.75 immediately following the results.
12. Is Now The Time To Buy Butterfield Bank?
Updated: January 24, 2026 at 11:29 PM EST
When considering an investment in Butterfield Bank, investors should account for its valuation and business qualities as well as what’s happened in the latest quarter.
Butterfield Bank isn’t a terrible business, but it isn’t one of our picks. To begin with, its revenue growth was weak over the last five years, and analysts expect its demand to deteriorate over the next 12 months. And while its stellar ROE suggests it has been a well-run company historically, the downside is its estimated net interest income for the next 12 months are weak. On top of that, its net interest margin limits its operating profit potential compared to other banks that can earn more, all else equal..
Butterfield Bank’s P/B ratio based on the next 12 months is 1.8x. While this valuation is reasonable, we don’t really see a big opportunity at the moment. We're pretty confident there are more exciting stocks to buy at the moment.
Wall Street analysts have a consensus one-year price target of $50.67 on the company (compared to the current share price of $50.50).