
Orion (ORN)
We’re cautious of Orion. Its poor sales growth shows demand is soft and its negative returns on capital suggest it destroyed value.― StockStory Analyst Team
1. News


2. Summary
Why Orion Is Not Exciting
Established in 1994, Orion (NYSE:ORN) provides construction services for marine infrastructure and industrial projects.
- Gross margin of 9.4% is below its competitors, leaving less money to invest in areas like marketing and R&D
- Operating margin falls short of the industry average, and the smaller profit dollars make it harder to react to unexpected market developments
- Lacking free cash flow limits its freedom to invest in growth initiatives, execute share buybacks, or pay dividends


Orion doesn’t measure up to our expectations. We see more lucrative opportunities elsewhere.
Why There Are Better Opportunities Than Orion


Orion is trading at $11.17 per share, or 27.7x forward P/E. Not only does Orion trade at a premium to companies in the industrials space, but this multiple is also high for its top-line growth.
There are stocks out there featuring similar valuation multiples with better fundamentals. We prefer to invest in those.
3. Orion (ORN) Research Report: Q4 CY2025 Update
Marine infrastructure company Orion (NYSE:ORN) announced better-than-expected revenue in Q4 CY2025, with sales up 7.5% year on year to $233.2 million. The company’s full-year revenue guidance of $925 million at the midpoint came in 1.5% above analysts’ estimates. Its non-GAAP profit of $0.08 per share was 57.9% above analysts’ consensus estimates.
Orion (ORN) Q4 CY2025 Highlights:
- Revenue: $233.2 million vs analyst estimates of $222.4 million (7.5% year-on-year growth, 4.9% beat)
- Adjusted EPS: $0.08 vs analyst estimates of $0.05 (57.9% beat)
- Adjusted EBITDA: $12.96 million vs analyst estimates of $12.93 million (5.6% margin, in line)
- Adjusted EPS guidance for the upcoming financial year 2026 is $0.39 at the midpoint, beating analyst estimates by 14.7%
- EBITDA guidance for the upcoming financial year 2026 is $56 million at the midpoint, above analyst estimates of $55.45 million
- Operating Margin: 2.2%, down from 4% in the same quarter last year
- Free Cash Flow Margin: 0.2%, down from 4.6% in the same quarter last year
- Backlog: $640 million at quarter end, down 12.2% year on year
- Market Capitalization: $547.4 million
Company Overview
Established in 1994, Orion (NYSE:ORN) provides construction services for marine infrastructure and industrial projects.
Over the years, Orion has expanded its scope from marine construction project management through strategic acquisitions and the buildout of its equipment fleet. Today, Orion offers specialty construction and engineering services across various sectors including infrastructure, industrial, and building.
Orion provides a broad range of construction services, especially in marine environments. These include the building and rehabilitation of marine transportation facilities like ports and marinas, installation and maintenance of marine pipelines, and construction of bridges and causeways. Its projects are crucial for enhancing marine and transportation infrastructure, ensuring the longevity and functionality of these essential facilities.
The company’s revenue streams are diversified across several construction and engineering services, with a business model that emphasizes long-term customer relationships and recurring revenue through maintenance dredging and other ongoing service contracts. Orion markets its services through a blend of direct sales efforts by its seasoned professionals and competitive bidding processes.
4. Construction and Maintenance Services
Construction and maintenance services companies not only boast technical know-how in specialized areas but also may hold special licenses and permits. Those who work in more regulated areas can enjoy more predictable revenue streams - for example, fire escapes need to be inspected every five years. More recently, services to address energy efficiency and labor availability are also creating incremental demand. But like the broader industrials sector, construction and maintenance services companies are at the whim of economic cycles as external factors like interest rates can greatly impact the new construction that drives incremental demand for these companies’ offerings.
Competitors in the marine construction and engineering sector include Great Lakes Dredge & Dock (NASDAQ:GLDD), Sterling Construction (NASDAQ:STRL), while a prominent private competitor is Weeks Marine
5. Revenue Growth
A company’s long-term performance is an indicator of its overall quality. Any business can have short-term success, but a top-tier one grows for years. Unfortunately, Orion’s 3.7% annualized revenue growth over the last five years was sluggish. This was below our standard for the industrials sector and is a poor baseline for our analysis.
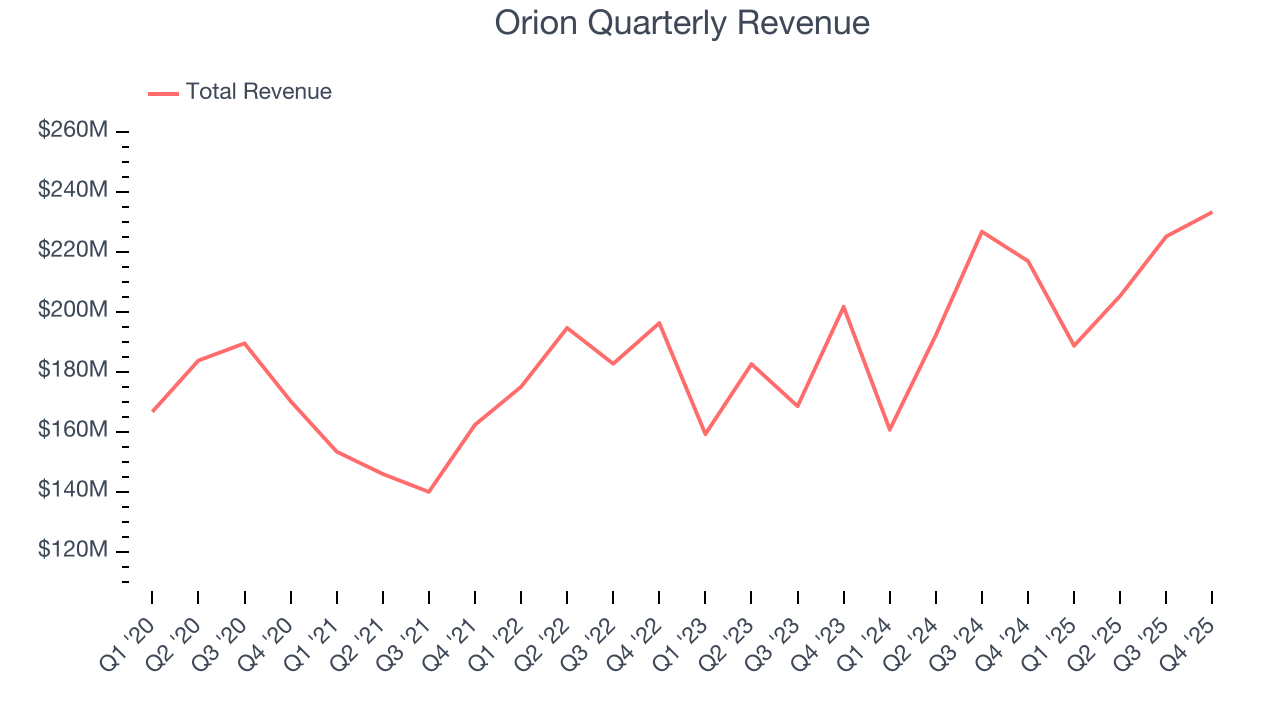
We at StockStory place the most emphasis on long-term growth, but within industrials, a half-decade historical view may miss cycles, industry trends, or a company capitalizing on catalysts such as a new contract win or a successful product line. Orion’s annualized revenue growth of 9.4% over the last two years is above its five-year trend, suggesting its demand recently accelerated. 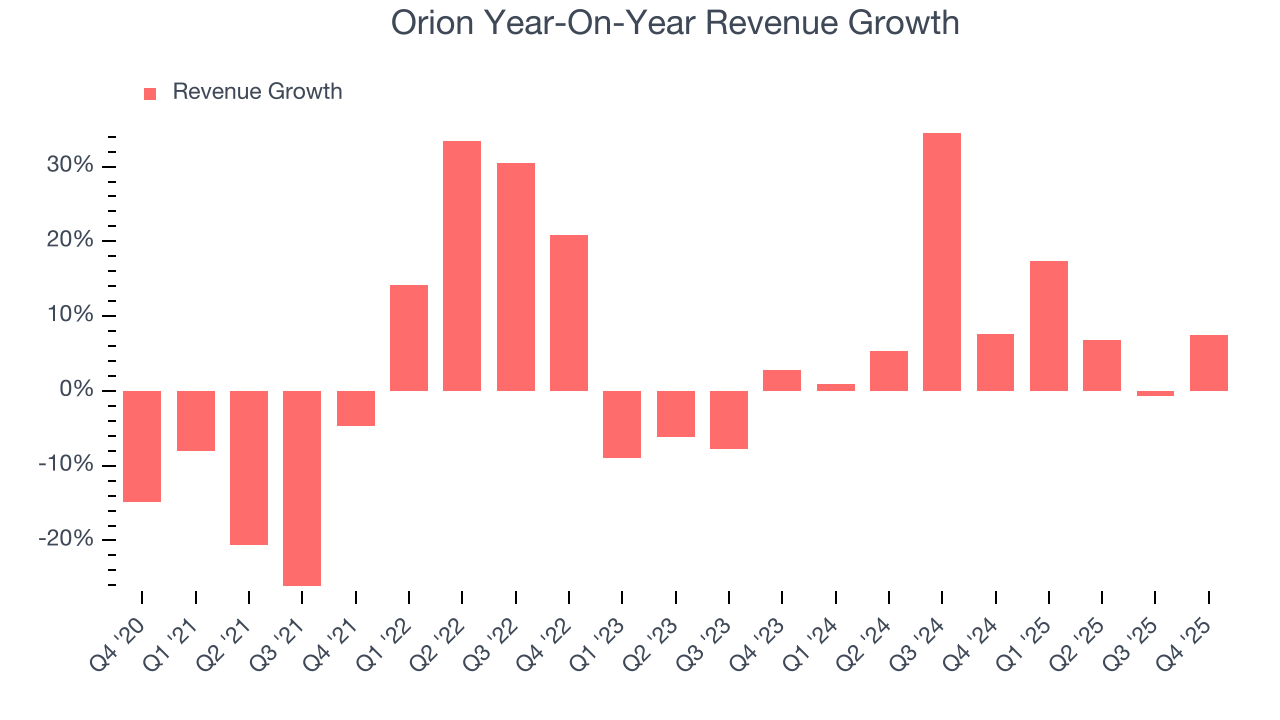
We can better understand the company’s revenue dynamics by analyzing its backlog, or the value of its outstanding orders that have not yet been executed or delivered. Orion’s backlog reached $640 million in the latest quarter and averaged 5.2% year-on-year declines over the last two years. Because this number is lower than its revenue growth, we can see the company fulfilled orders at a faster rate than it added new orders to the backlog. This implies Orion was operating efficiently but raises questions about the health of its sales pipeline. 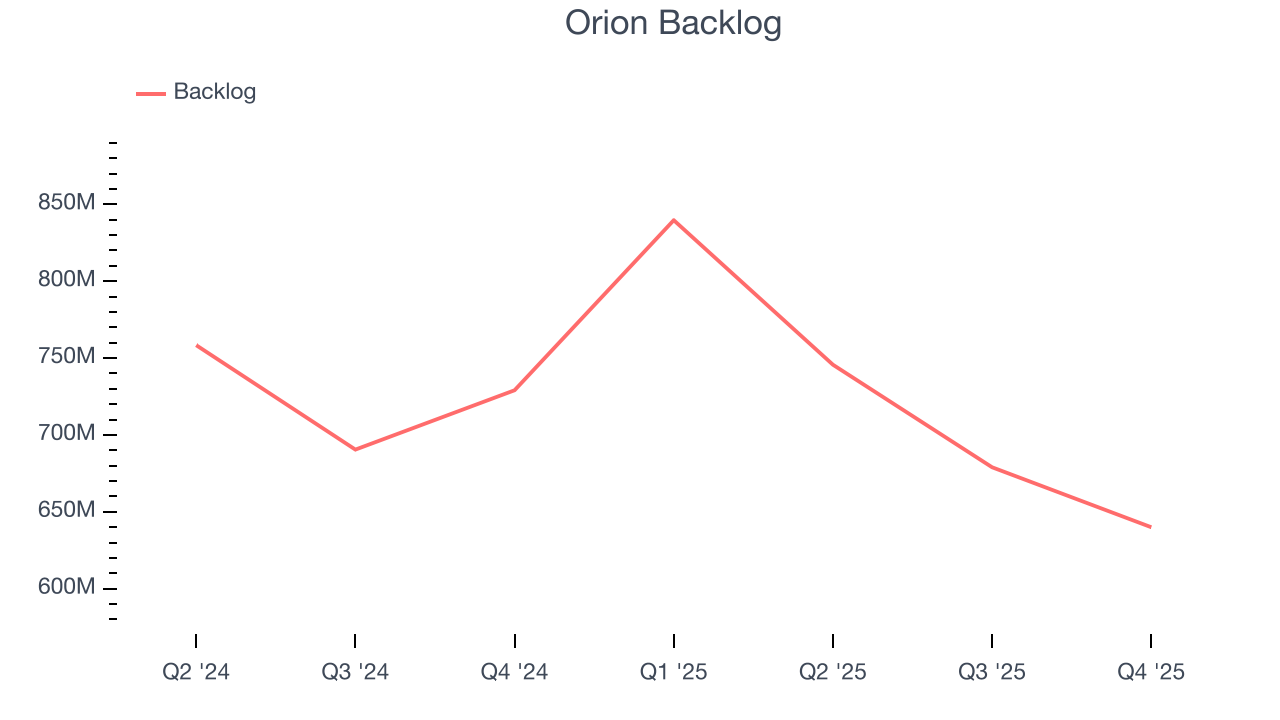
This quarter, Orion reported year-on-year revenue growth of 7.5%, and its $233.2 million of revenue exceeded Wall Street’s estimates by 4.9%.
Looking ahead, sell-side analysts expect revenue to grow 7.2% over the next 12 months, a slight deceleration versus the last two years. This projection doesn't excite us and implies its products and services will see some demand headwinds.
6. Gross Margin & Pricing Power
Gross profit margin is a critical metric to track because it sheds light on its pricing power, complexity of products, and ability to procure raw materials, equipment, and labor.
Orion has bad unit economics for an industrials business, signaling it operates in a competitive market. As you can see below, it averaged a 9.4% gross margin over the last five years. Said differently, Orion had to pay a chunky $90.56 to its suppliers for every $100 in revenue. 
Orion produced a 11.6% gross profit margin in Q4, down 2.4 percentage points year on year. On a wider time horizon, the company’s full-year margin has remained steady over the past four quarters, suggesting its input costs (such as raw materials and manufacturing expenses) have been stable and it isn’t under pressure to lower prices.
7. Operating Margin
Orion was roughly breakeven when averaging the last five years of quarterly operating profits, one of the worst outcomes in the industrials sector. This result isn’t too surprising given its low gross margin as a starting point.
On the plus side, Orion’s operating margin rose by 5 percentage points over the last five years, as its sales growth gave it operating leverage.
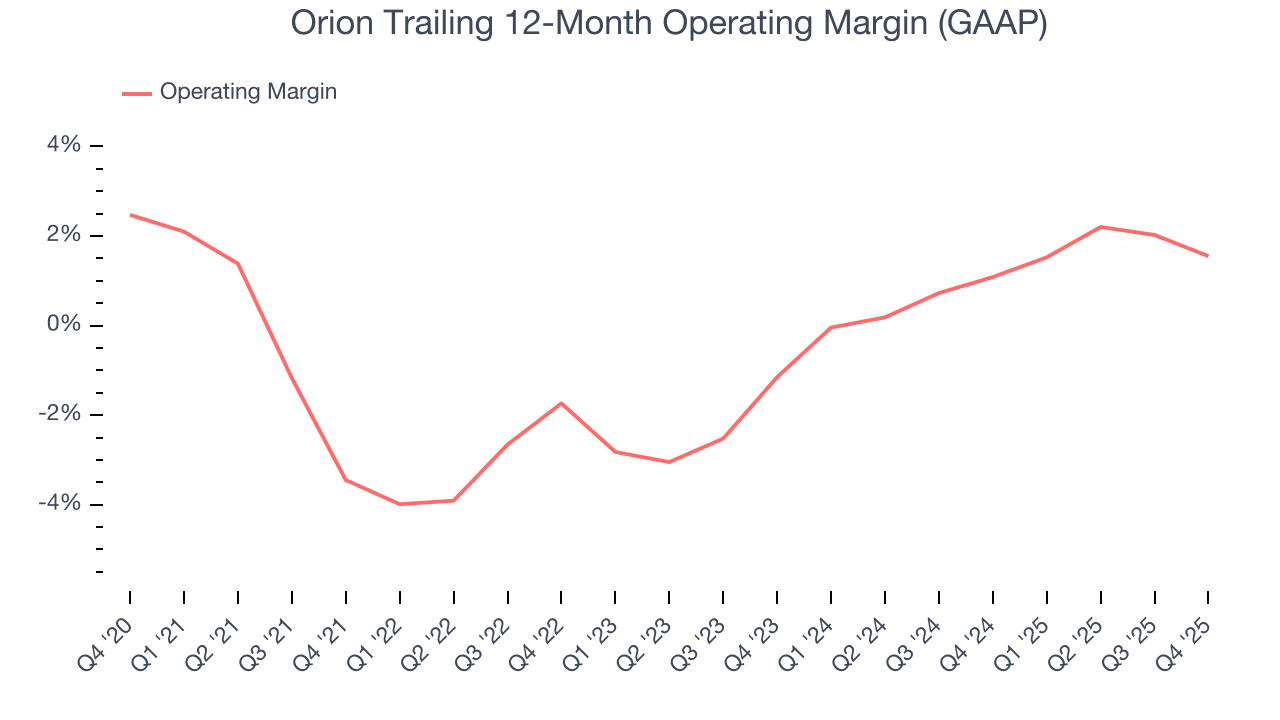
This quarter, Orion generated an operating margin profit margin of 2.2%, down 1.9 percentage points year on year. Since Orion’s gross margin decreased more than its operating margin, we can assume its recent inefficiencies were driven more by weaker leverage on its cost of sales rather than increased marketing, R&D, and administrative overhead expenses.
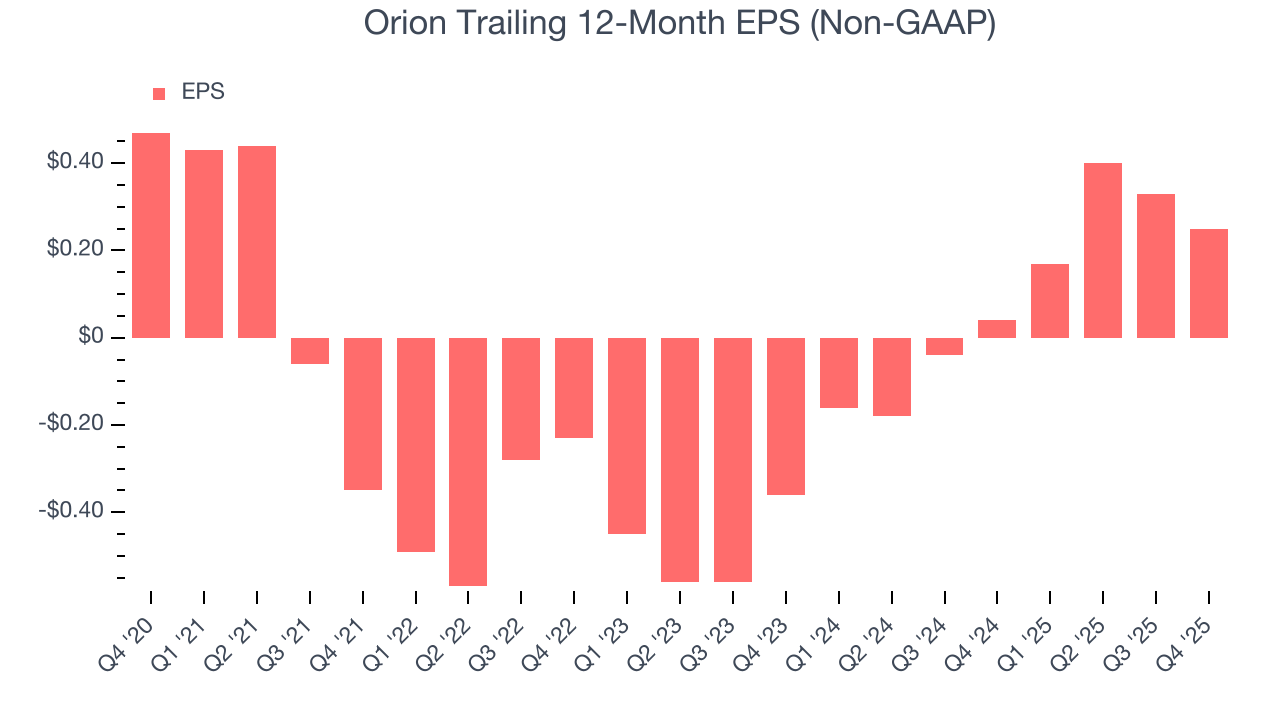
8. Earnings Per Share
We track the long-term change in earnings per share (EPS) for the same reason as long-term revenue growth. Compared to revenue, however, EPS highlights whether a company’s growth is profitable.
Sadly for Orion, its EPS declined by 11.9% annually over the last five years while its revenue grew by 3.7%. However, its operating margin actually improved during this time, telling us that non-fundamental factors such as interest expenses and taxes affected its ultimate earnings.
Diving into the nuances of Orion’s earnings can give us a better understanding of its performance. A five-year view shows Orion has diluted its shareholders, growing its share count by 31.1%. This dilution overshadowed its increased operational efficiency and has led to lower per share earnings. Taxes and interest expenses can also affect EPS but don’t tell us as much about a company’s fundamentals. 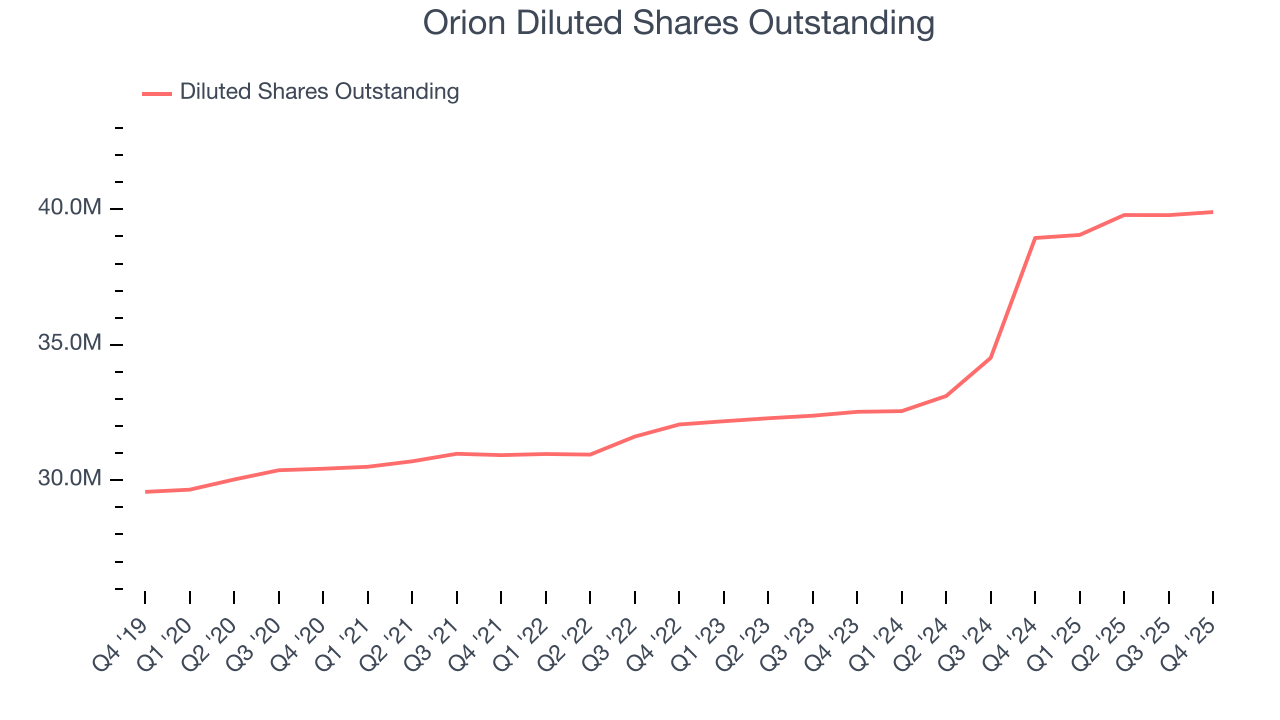
Like with revenue, we analyze EPS over a shorter period to see if we are missing a change in the business.
For Orion, its two-year annual EPS growth of 64.1% was higher than its five-year trend. This acceleration made it one of the faster-growing industrials companies in recent history.
In Q4, Orion reported adjusted EPS of $0.08, down from $0.16 in the same quarter last year. Despite falling year on year, this print easily cleared analysts’ estimates. We also like to analyze expected EPS growth based on Wall Street analysts’ consensus projections, but there is insufficient data.
9. Cash Is King
If you’ve followed StockStory for a while, you know we emphasize free cash flow. Why, you ask? We believe that in the end, cash is king, and you can’t use accounting profits to pay the bills.
Orion broke even from a free cash flow perspective over the last five years, giving the company limited opportunities to return capital to shareholders.
Taking a step back, an encouraging sign is that Orion’s margin expanded by 1.5 percentage points during that time. We have no doubt shareholders would like to continue seeing its cash conversion rise as it gives the company more optionality.
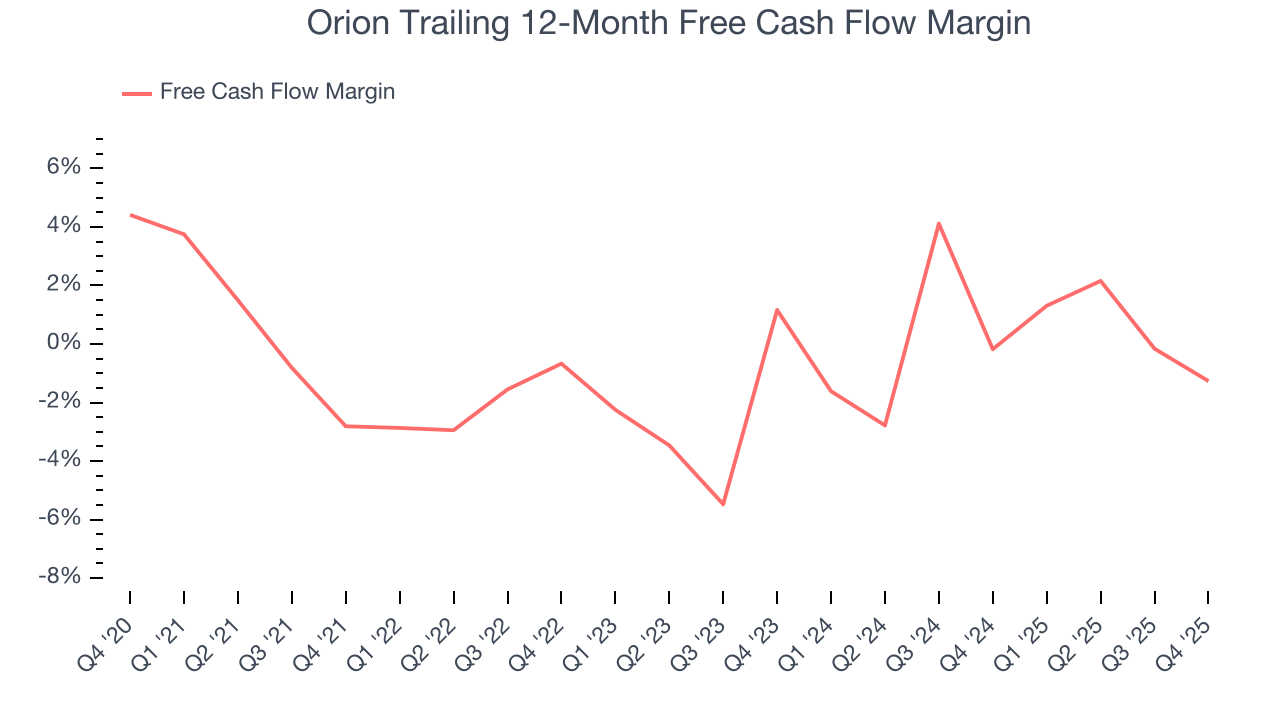
Orion broke even from a free cash flow perspective in Q4. The company’s cash profitability regressed as it was 4.4 percentage points lower than in the same quarter last year, prompting us to pay closer attention. Short-term fluctuations typically aren’t a big deal because investment needs can be seasonal, but we’ll be watching to see if the trend extrapolates into future quarters.
10. Return on Invested Capital (ROIC)
EPS and free cash flow tell us whether a company was profitable while growing its revenue. But was it capital-efficient? A company’s ROIC explains this by showing how much operating profit it makes compared to the money it has raised (debt and equity).
Orion’s five-year average ROIC was negative 3%, meaning management lost money while trying to expand the business. Its returns were among the worst in the industrials sector.
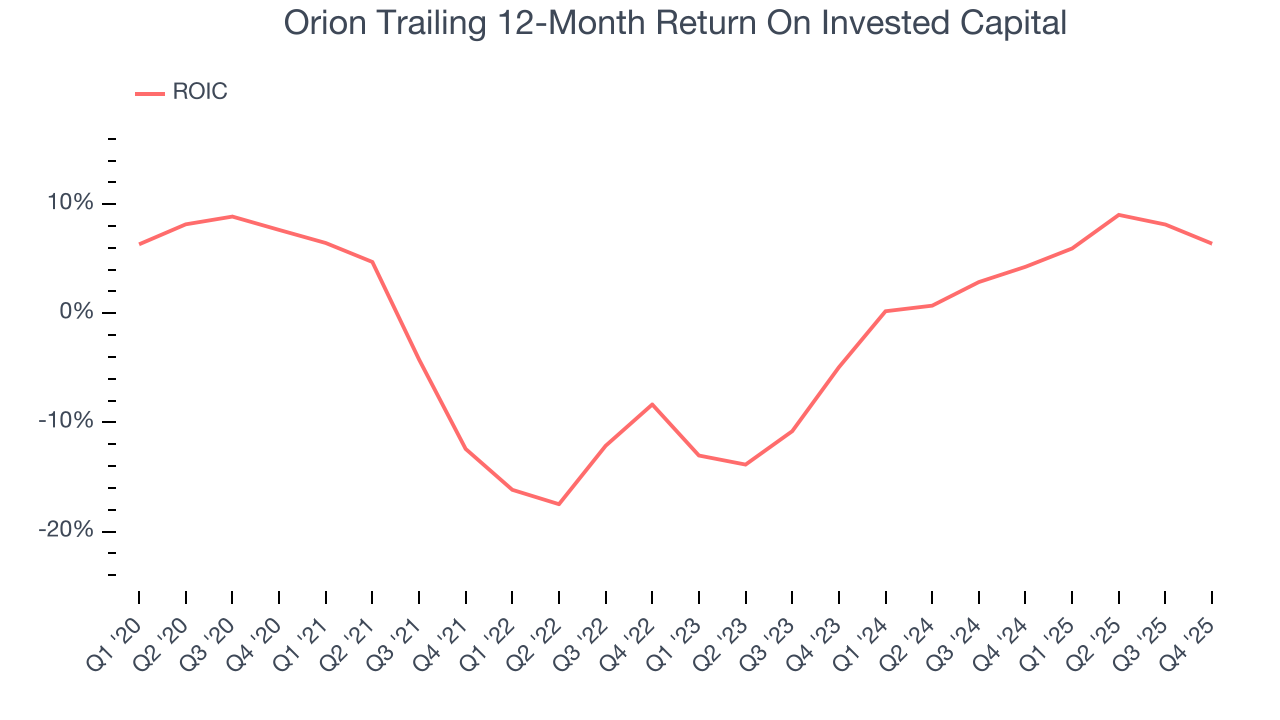
We like to invest in businesses with high returns, but the trend in a company’s ROIC is what often surprises the market and moves the stock price. Over the last few years, Orion’s ROIC has increased. This is a good sign, but we recognize its lack of profitable growth during the COVID era was the primary reason for the change.
11. Balance Sheet Assessment
Orion reported $3.29 million of cash and $50.38 million of debt on its balance sheet in the most recent quarter. As investors in high-quality companies, we primarily focus on two things: 1) that a company’s debt level isn’t too high and 2) that its interest payments are not excessively burdening the business.
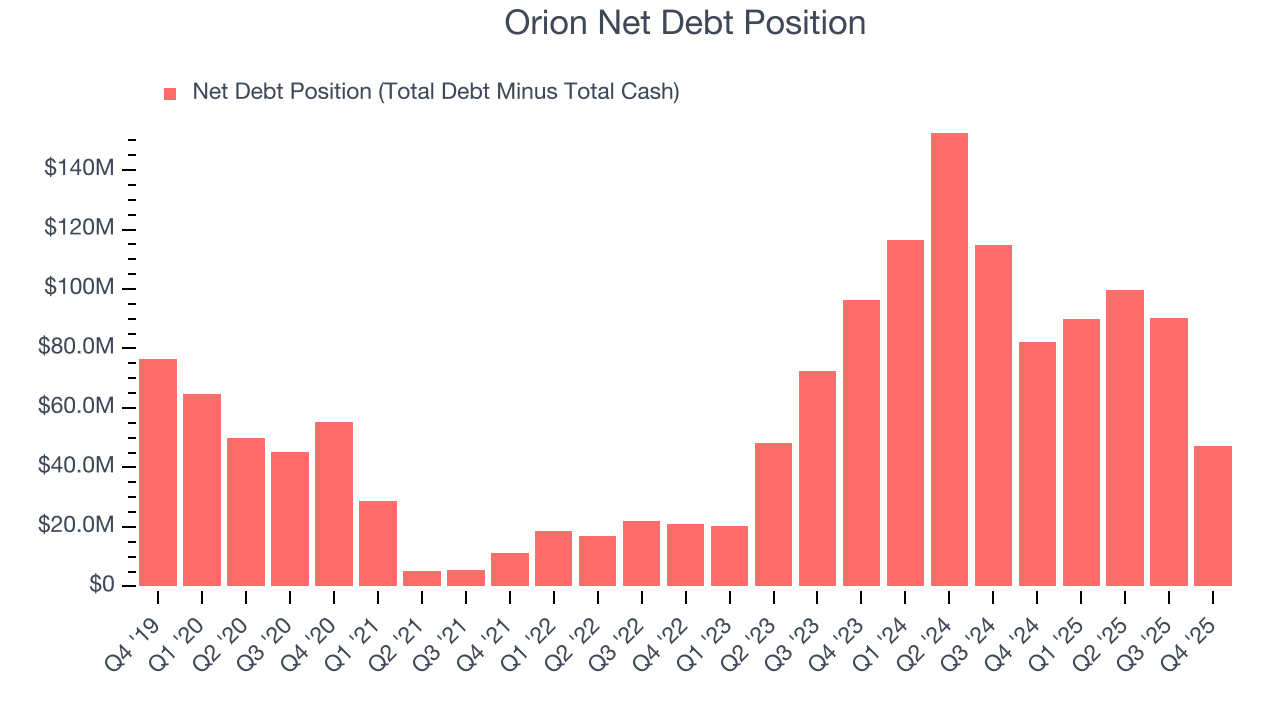
With $45.24 million of EBITDA over the last 12 months, we view Orion’s 1.0× net-debt-to-EBITDA ratio as safe. We also see its $5.69 million of annual interest expenses as appropriate. The company’s profits give it plenty of breathing room, allowing it to continue investing in growth initiatives.
12. Key Takeaways from Orion’s Q4 Results
It was good to see Orion beat analysts’ EPS expectations this quarter. We were also excited its revenue outperformed Wall Street’s estimates by a wide margin. Zooming out, we think this was a good print with some key areas of upside. The market seemed to be hoping for more, and the stock traded down 6.2% to $12.56 immediately after reporting.
13. Is Now The Time To Buy Orion?
Updated: March 24, 2026 at 11:41 PM EDT
A common mistake we notice when investors are deciding whether to buy a stock or not is that they simply look at the latest earnings results. Business quality and valuation matter more, so we urge you to understand these dynamics as well.
Orion’s business quality ultimately falls short of our standards. To begin with, its revenue growth was weak over the last five years. While its projected EPS for the next year implies the company’s fundamentals will improve, the downside is its relatively low ROIC suggests management has struggled to find compelling investment opportunities. On top of that, its declining EPS over the last five years makes it a less attractive asset to the public markets.
Orion’s P/E ratio based on the next 12 months is 27.7x. This valuation multiple is fair, but we don’t have much faith in the company. We're fairly confident there are better investments elsewhere.
Wall Street analysts have a consensus one-year price target of $16.40 on the company (compared to the current share price of $11.17).
Although the price target is bullish, readers should exercise caution because analysts tend to be overly optimistic. The firms they work for, often big banks, have relationships with companies that extend into fundraising, M&A advisory, and other rewarding business lines. As a result, they typically hesitate to say bad things for fear they will lose out. We at StockStory do not suffer from such conflicts of interest, so we’ll always tell it like it is.