
Prosperity Bancshares (PB)
Prosperity Bancshares is in for a bumpy ride. Its weak sales growth and low returns on capital show it struggled to generate demand and profits.― StockStory Analyst Team
1. News


2. Summary
Why We Think Prosperity Bancshares Will Underperform
With a network of banking centers spanning the Lone Star State and beyond, Prosperity Bancshares (NYSE:PB) operates full-service banking locations throughout Texas and Oklahoma, offering a wide range of financial products and services to businesses and consumers.
- Flat earnings per share over the last five years lagged its peers
- Flat net interest income over the last five years suggest it must find different ways to grow during this cycle
- Tangible book value per share is projected to decrease by 4.6% over the next 12 months as capital generation weakens


Prosperity Bancshares doesn’t meet our quality standards. We believe there are better opportunities elsewhere.
Why There Are Better Opportunities Than Prosperity Bancshares


At $64.28 per share, Prosperity Bancshares trades at 0.8x forward P/B. This sure is a cheap multiple, but you get what you pay for.
Cheap stocks can look like a great deal at first glance, but they can be value traps. They often have less earnings power, meaning there is more reliance on a re-rating to generate good returns - an unlikely scenario for low-quality companies.
3. Prosperity Bancshares (PB) Research Report: Q4 CY2025 Update
Regional banking company Prosperity Bancshares (NYSE:PB) met Wall Streets revenue expectations in Q4 CY2025, with sales up 3.2% year on year to $317.7 million. Its GAAP profit of $1.49 per share was 4.4% above analysts’ consensus estimates.
Prosperity Bancshares (PB) Q4 CY2025 Highlights:
- Net Interest Income: $275 million vs analyst estimates of $277 million (2.7% year-on-year growth, 0.7% miss)
- Net Interest Margin: 3.3% vs analyst estimates of 3.3% (in line)
- Revenue: $317.7 million vs analyst estimates of $318.6 million (3.2% year-on-year growth, in line)
- Efficiency Ratio: 43.7% vs analyst estimates of 44.2% (54.5 basis point beat)
- EPS (GAAP): $1.49 vs analyst estimates of $1.43 (4.4% beat)
- Tangible Book Value per Share: $43.64 vs analyst estimates of $43.61 (7.5% year-on-year growth, in line)
- Market Capitalization: $7.11 billion
Company Overview
With a network of banking centers spanning the Lone Star State and beyond, Prosperity Bancshares (NYSE:PB) operates full-service banking locations throughout Texas and Oklahoma, offering a wide range of financial products and services to businesses and consumers.
Prosperity Bank offers a comprehensive range of financial products including commercial, residential, and construction loans, as well as traditional deposit products like certificates of deposit and checking accounts. The bank's lending portfolio is diversified across several sectors, with significant portions dedicated to commercial real estate, residential properties, and construction financing.
For businesses, Prosperity provides working capital loans, term loans for expansion, equipment financing, and commercial real estate loans. The bank's Warehouse Purchase Program enables mortgage originators to close residential loans in their own name while managing cash flow until the loans are sold to investors. Agricultural producers can access specialized financing for livestock, crop production, equipment, and land.
Individual consumers benefit from personal banking options including home mortgages, home equity loans, auto loans, and various deposit accounts. Unlike many mortgage lenders, Prosperity typically retains residential mortgage loans for its own portfolio rather than selling them into the secondary market, though it does originate and sell some longer-term mortgages.
The bank operates in metropolitan areas like Houston, Dallas/Fort Worth, San Antonio, and Austin, as well as smaller communities throughout Texas and Oklahoma where it often competes with small community banks or regional bank branches. This geographic diversity provides stability across different economic environments. As a financial holding company, Prosperity operates under the supervision of the Federal Reserve Board, while the bank itself is regulated by the FDIC and Texas Department of Banking.
4. Regional Banks
Regional banks, financial institutions operating within specific geographic areas, serve as intermediaries between local depositors and borrowers. They benefit from rising interest rates that improve net interest margins (the difference between loan yields and deposit costs), digital transformation reducing operational expenses, and local economic growth driving loan demand. However, these banks face headwinds from fintech competition, deposit outflows to higher-yielding alternatives, credit deterioration (increasing loan defaults) during economic slowdowns, and regulatory compliance costs. Recent concerns about regional bank stability following high-profile failures and significant commercial real estate exposure present additional challenges.
Prosperity Bancshares competes with other regional banks operating in Texas and Oklahoma such as Cullen/Frost Bankers (NYSE:CFR), Texas Capital Bancshares (NASDAQ:TCBI), BOK Financial (NASDAQ:BOKF), as well as larger national banks with significant presence in the region including JPMorgan Chase (NYSE:JPM) and Bank of America (NYSE:BAC).
5. Sales Growth
Two primary revenue streams drive bank earnings. While net interest income, which is earned by charging higher rates on loans than paid on deposits, forms the foundation, fee-based services across banking, credit, wealth management, and trading operations provide additional income. Regrettably, Prosperity Bancshares’s revenue grew at a weak 1.3% compounded annual growth rate over the last five years. This was below our standards and is a poor baseline for our analysis.
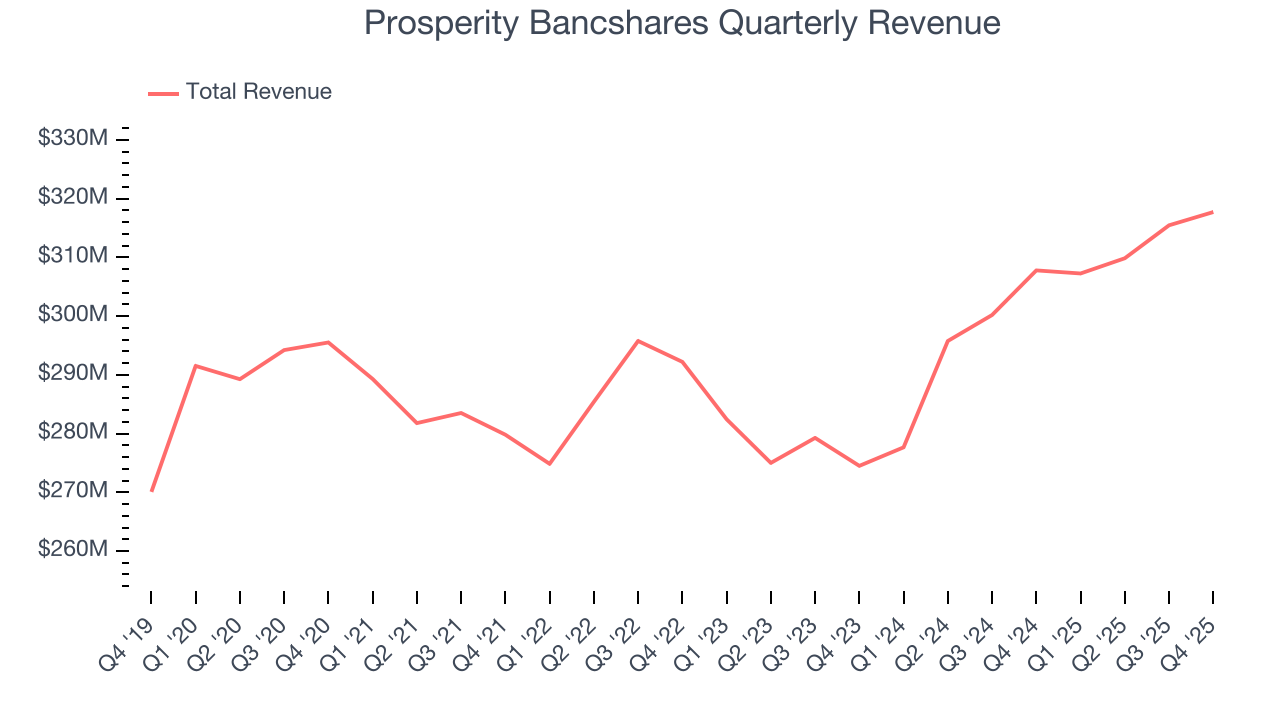
We at StockStory place the most emphasis on long-term growth, but within financials, a half-decade historical view may miss recent interest rate changes, market returns, and industry trends. Prosperity Bancshares’s annualized revenue growth of 6.1% over the last two years is above its five-year trend, but we were still disappointed by the results. 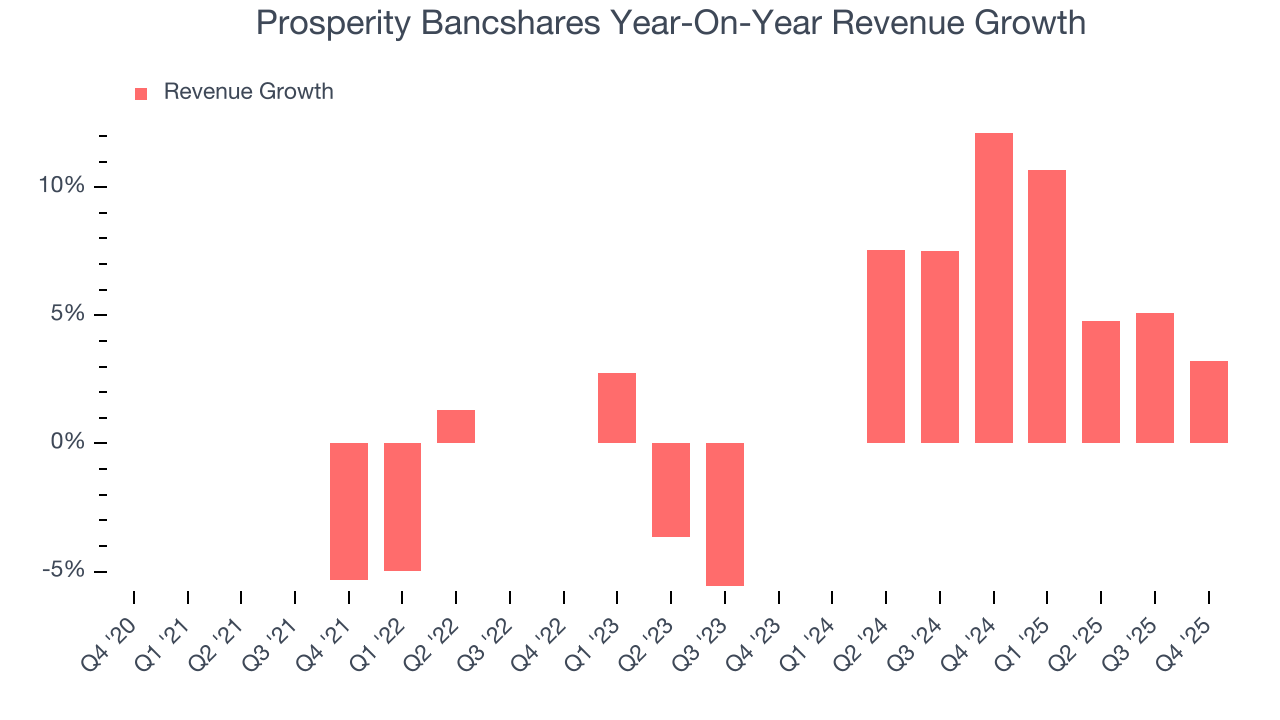 Note: Quarters not shown were determined to be outliers, impacted by outsized investment gains/losses that are not indicative of the recurring fundamentals of the business.
This quarter, Prosperity Bancshares grew its revenue by 3.2% year on year, and its $317.7 million of revenue was in line with Wall Street’s estimates.
Net interest income made up 86.9% of the company’s total revenue during the last five years, meaning Prosperity Bancshares barely relies on non-interest income to drive its overall growth.
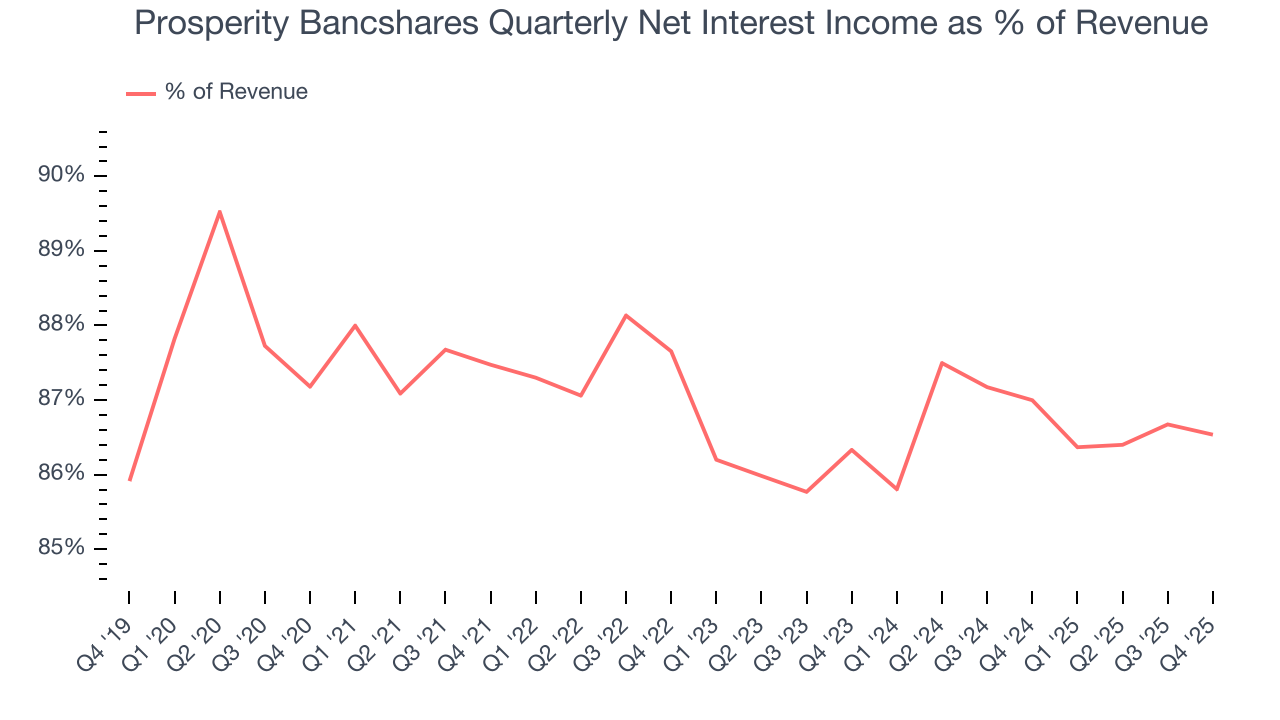
While banks generate revenue from multiple sources, investors view net interest income as the cornerstone - its predictable, recurring characteristics stand in sharp contrast to the volatility of non-interest income.
6. Efficiency Ratio
Topline growth carries importance, but the overall profitability behind this expansion determines true value creation. For banks, the efficiency ratio captures this relationship by measuring non-interest expenses, including salaries, facilities, technology, and marketing, against total revenue.
Investors place greater emphasis on efficiency ratio movements than absolute values, understanding that expense structures reflect revenue mix variations. Lower ratios represent better operational performance since they show banks generating more revenue per dollar of expense.
Over the last five years, Prosperity Bancshares’s efficiency ratio has increased by 1.3 percentage points, going from 41.5% to 44.6%. Said differently, the company’s expenses have increased at a faster rate than revenue, which usually raises questions unless the company is in high-growth mode and reinvesting its profits into attractive ventures.
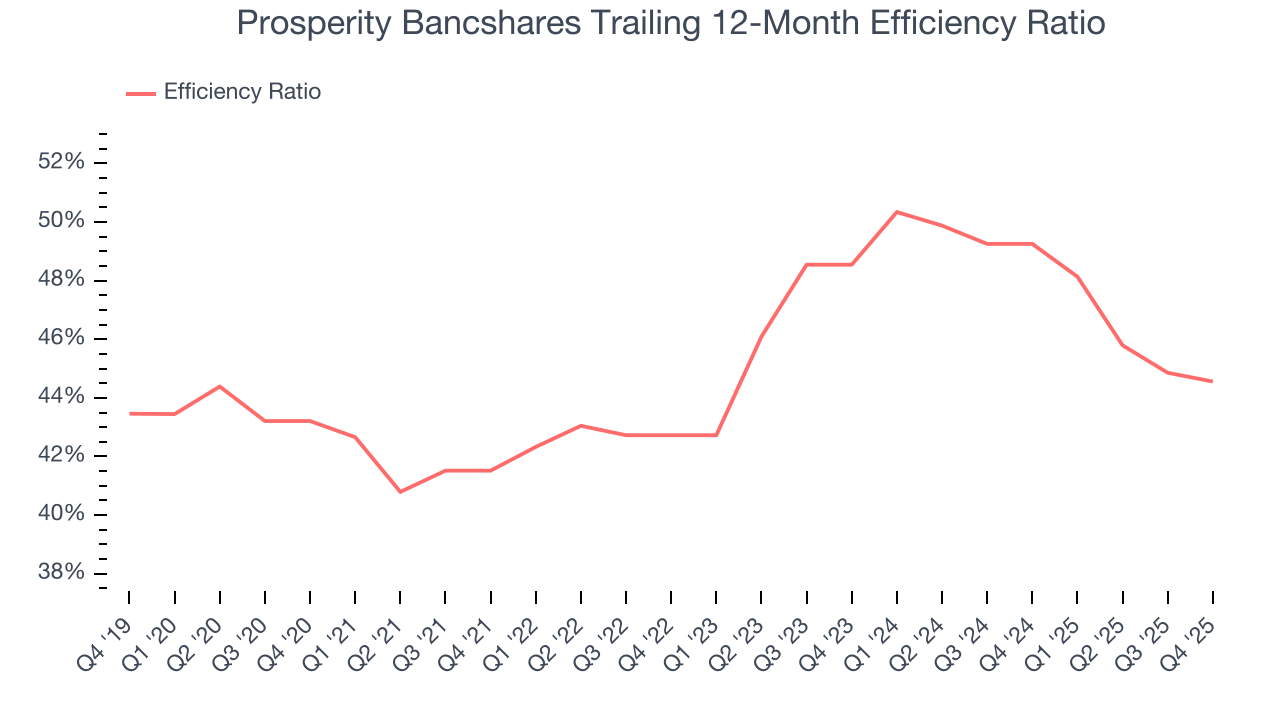
Prosperity Bancshares’s efficiency ratio came in at 43.7% this quarter, beating analysts’ expectations by 54.5 basis points (100 basis points = 1 percentage point).
For the next 12 months, Wall Street expects Prosperity Bancshares to become less profitable as it anticipates an efficiency ratio of 45.6%.
7. Earnings Per Share
Revenue trends explain a company’s historical growth, but the long-term change in earnings per share (EPS) points to the profitability of that growth – for example, a company could inflate its sales through excessive spending on advertising and promotions.
Prosperity Bancshares’s flat EPS over the last five years was below its 1.3% annualized revenue growth. However, its efficiency ratio actually improved during this time, telling us that non-fundamental factors such as taxes affected its ultimate earnings.
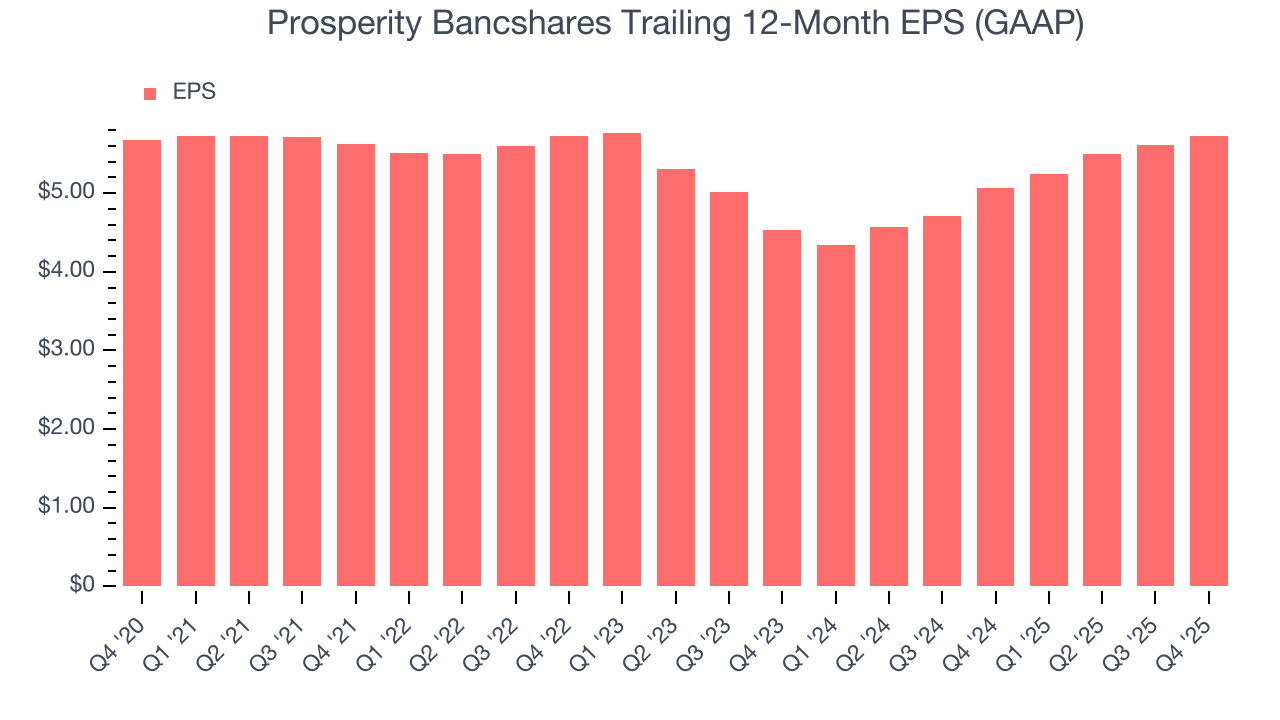
Like with revenue, we analyze EPS over a more recent period because it can provide insight into an emerging theme or development for the business.
For Prosperity Bancshares, its two-year annual EPS growth of 12.5% was higher than its five-year trend. Accelerating earnings growth is almost always an encouraging data point.
In Q4, Prosperity Bancshares reported EPS of $1.49, up from $1.37 in the same quarter last year. This print beat analysts’ estimates by 4.4%. Over the next 12 months, Wall Street expects Prosperity Bancshares’s full-year EPS of $5.73 to grow 6.2%.
8. Tangible Book Value Per Share (TBVPS)
The balance sheet drives banking profitability since earnings flow from the spread between borrowing and lending rates. As such, valuations for these companies concentrate on capital strength and sustainable equity accumulation potential.
This explains why tangible book value per share (TBVPS) stands as the premier banking metric. TBVPS strips away questionable intangible assets, revealing concrete per-share net worth that investors can trust. On the other hand, EPS is often distorted by mergers and flexible loan loss accounting. TBVPS provides clearer performance insights.
Prosperity Bancshares’s TBVPS grew at an impressive 7.4% annual clip over the last five years. However, TBVPS growth has recently decelerated a bit to 6.3% annual growth over the last two years (from $38.62 to $43.64 per share).
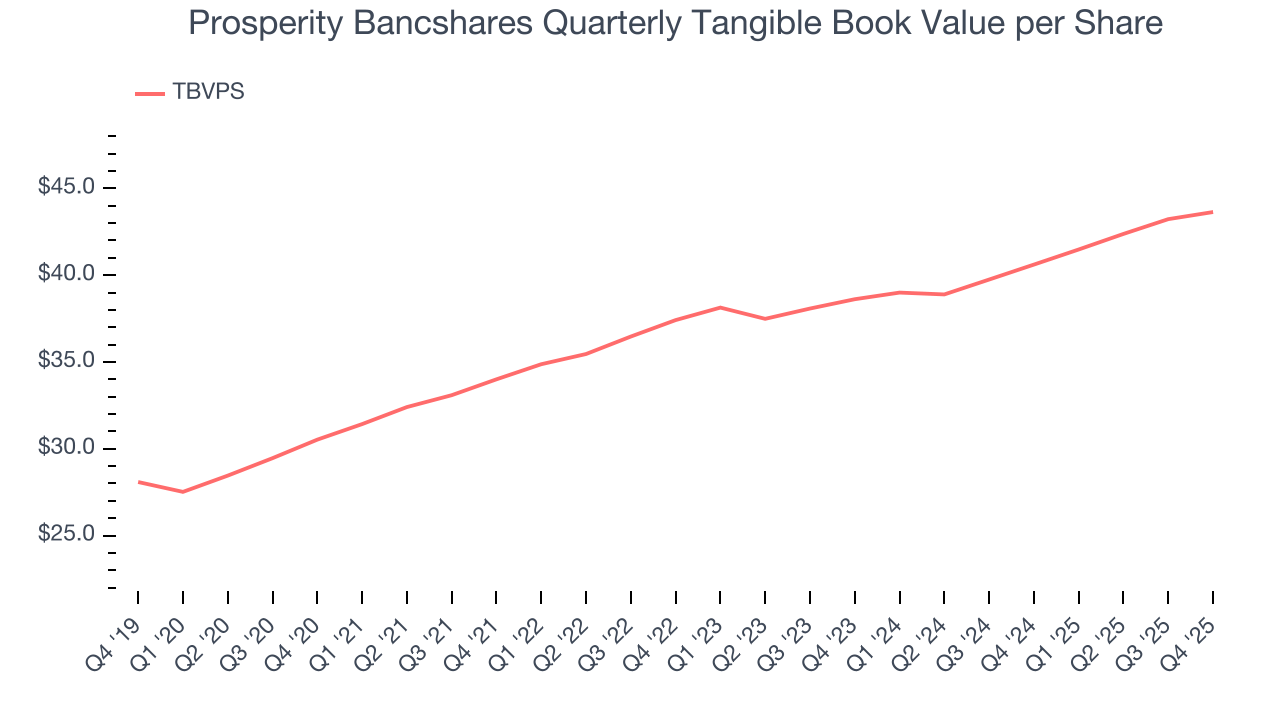
Over the next 12 months, Consensus estimates call for Prosperity Bancshares’s TBVPS to grow by 6.1% to $46.30, lousy growth rate.
9. Balance Sheet Assessment
Leverage is core to a financial firm’s business model (loans funded by deposits). To ensure economic stability and avoid a repeat of the 2008 GFC, regulators require certain levels of capital and liquidity, focusing on the Tier 1 capital ratio.
Tier 1 capital is the highest-quality capital that a firm holds, consisting primarily of common stock and retained earnings, but also physical gold. It serves as the primary cushion against losses and is the first line of defense in times of financial distress.
This capital is divided by risk-weighted assets to derive the Tier 1 capital ratio. Risk-weighted means that cash and US treasury securities are assigned little risk while unsecured consumer loans and equity investments get much higher risk weights, for example.
New regulation after the 2008 financial crisis requires that all firms must maintain a Tier 1 capital ratio greater than 4.5%. On top of this, there are additional buffers based on scale, risk profile, and other regulatory classifications, so that at the end of the day, firms generally must maintain a 7-10% ratio at minimum.
Over the last two years, Prosperity Bancshares has averaged a Tier 1 capital ratio of 16.6%, which is considered safe and well capitalized in the event that macro or market conditions suddenly deteriorate.
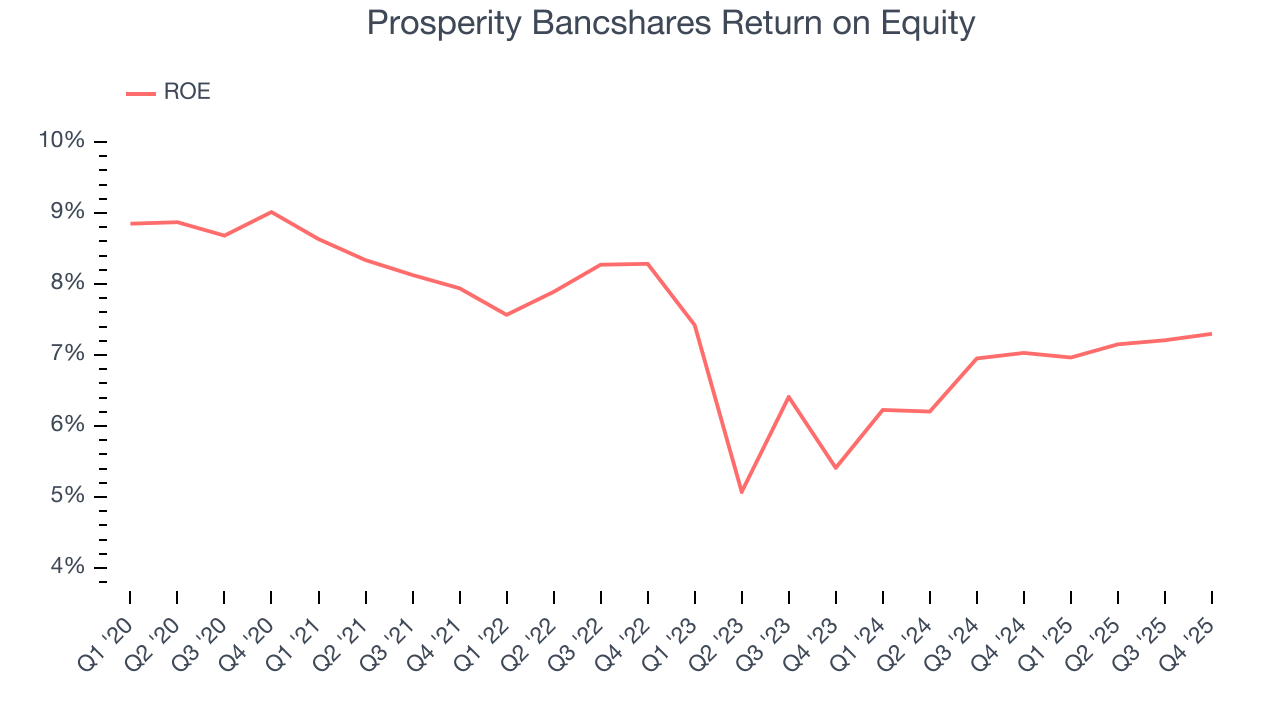
10. Return on Equity
Return on equity (ROE) measures how effectively banks generate profit from each dollar of shareholder equity - a critical funding source. High-ROE institutions typically compound shareholder wealth faster over time through retained earnings, share repurchases, and dividend payments.
Over the last five years, Prosperity Bancshares has averaged an ROE of 7.2%, uninspiring for a company operating in a sector where the average shakes out around 7.5%.
11. Key Takeaways from Prosperity Bancshares’s Q4 Results
We struggled to find many positives in these results. Its net interest income slightly missed and its revenue was just in line with Wall Street’s estimates. Tangible book value per share also just met expectations. Overall, this was a quarter without too many positives to get excited about. The stock traded down 5.1% to $69.17 immediately after reporting.
12. Is Now The Time To Buy Prosperity Bancshares?
Updated: March 15, 2026 at 12:30 AM EDT
The latest quarterly earnings matters, sure, but we actually think longer-term fundamentals and valuation matter more. Investors should consider all these pieces before deciding whether or not to invest in Prosperity Bancshares.
We cheer for all companies supporting the economy, but in the case of Prosperity Bancshares, we’ll be cheering from the sidelines. First off, its revenue growth was weak over the last five years. While its estimated net interest income growth for the next 12 months is great, the downside is its estimated sales for the next 12 months are weak. On top of that, its weak EPS growth over the last five years shows it’s failed to produce meaningful profits for shareholders.
Prosperity Bancshares’s P/B ratio based on the next 12 months is 0.8x. While this valuation is optically cheap, the potential downside is huge given its shaky fundamentals. There are better stocks to buy right now.
Wall Street analysts have a consensus one-year price target of $78.93 on the company (compared to the current share price of $64.28).
Although the price target is bullish, readers should exercise caution because analysts tend to be overly optimistic. The firms they work for, often big banks, have relationships with companies that extend into fundraising, M&A advisory, and other rewarding business lines. As a result, they typically hesitate to say bad things for fear they will lose out. We at StockStory do not suffer from such conflicts of interest, so we’ll always tell it like it is.