
Provident Financial Services (PFS)
We’re skeptical of Provident Financial Services. Its weak returns on capital indicate management was inefficient with its resources and missed opportunities.― StockStory Analyst Team
1. News


2. Summary
Why We Think Provident Financial Services Will Underperform
Founded in 1839 and serving communities across New Jersey, Pennsylvania, and New York, Provident Financial Services (NYSE:PFS) operates a regional bank providing commercial, residential, and consumer lending alongside wealth management and insurance services.
- Net interest income is projected to tank by 7.6% over the next 12 months as demand evaporates
- Tangible book value per share stagnated over the last five years, limiting its ability to leverage its balance sheet to make additional investments
- A silver lining is that its annual net interest income growth of 23.1% over the past five years was outstanding, reflecting market share gains this cycle


Provident Financial Services falls below our quality standards. There are more promising prospects in the market.
Why There Are Better Opportunities Than Provident Financial Services


At $20.28 per share, Provident Financial Services trades at 0.9x forward P/B. Provident Financial Services’s multiple may seem like a great deal among banking peers, but we think there are valid reasons why it’s this cheap.
It’s better to pay up for high-quality businesses with higher long-term earnings potential rather than to buy lower-quality stocks because they appear cheap. These challenged businesses often don’t re-rate, a phenomenon known as a “value trap”.
3. Provident Financial Services (PFS) Research Report: Q4 CY2025 Update
Regional bank Provident Financial Services (NYSE:PFS) beat Wall Street’s revenue expectations in Q4 CY2025, with sales up 9.6% year on year to $225.7 million. Its GAAP profit of $0.64 per share was 15.1% above analysts’ consensus estimates.
Provident Financial Services (PFS) Q4 CY2025 Highlights:
- Net Interest Income: $197.4 million vs analyst estimates of $197.2 million (8.6% year-on-year growth, in line)
- Net Interest Margin: 3.4% vs analyst estimates of 3.4% (in line)
- Revenue: $225.7 million vs analyst estimates of $223.5 million (9.6% year-on-year growth, 1% beat)
- Efficiency Ratio: 51% vs analyst estimates of 50.6% (37 basis point miss)
- EPS (GAAP): $0.64 vs analyst estimates of $0.56 (15.1% beat)
- Tangible Book Value per Share: $15.70 vs analyst estimates of $15.50 (14.9% year-on-year growth, 1.3% beat)
- Market Capitalization: $2.69 billion
Company Overview
Founded in 1839 and serving communities across New Jersey, Pennsylvania, and New York, Provident Financial Services (NYSE:PFS) operates a regional bank providing commercial, residential, and consumer lending alongside wealth management and insurance services.
Provident operates through a network of full-service branches across fourteen counties in northern and central New Jersey, as well as in parts of Pennsylvania and New York. The bank's lending portfolio is diversified, with a strategic emphasis on commercial real estate, multi-family properties, construction projects, and business loans, which collectively represent over 85% of its loan portfolio.
For commercial clients, Provident offers various financing options including equipment purchases, working capital lines of credit, and real estate loans, along with cash management services and Small Business Administration (SBA) guaranteed loans. The bank maintains Preferred Lender status with the SBA, streamlining the application process for small business borrowers.
On the consumer side, Provident provides residential mortgages, home equity loans and lines of credit, personal loans, and deposit products including checking, savings, and money market accounts. A typical customer might use Provident for their primary checking account, obtain a mortgage for their home, and later secure a home equity line of credit for renovations.
Beyond traditional banking, Provident generates fee income through its wholly owned subsidiaries. Beacon Trust Company offers wealth management services including investment management, trust administration, and financial planning, while Provident Protection Plus operates as a retail insurance broker placing property, casualty, life, and health coverage with various carriers.
The bank's revenue model combines interest income from loans and investments with fee income from wealth management, insurance brokerage, and various banking services. This diversified approach helps Provident maintain stability through different economic cycles.
4. Regional Banks
Regional banks, financial institutions operating within specific geographic areas, serve as intermediaries between local depositors and borrowers. They benefit from rising interest rates that improve net interest margins (the difference between loan yields and deposit costs), digital transformation reducing operational expenses, and local economic growth driving loan demand. However, these banks face headwinds from fintech competition, deposit outflows to higher-yielding alternatives, credit deterioration (increasing loan defaults) during economic slowdowns, and regulatory compliance costs. Recent concerns about regional bank stability following high-profile failures and significant commercial real estate exposure present additional challenges.
Provident Financial Services competes with other regional banks operating in the Northeast, including Valley National Bank (NASDAQ:VLY), M&T Bank (NYSE:MTB), and New York Community Bancorp (NYSE:NYCB), as well as larger national institutions like JPMorgan Chase (NYSE:JPM) and Bank of America (NYSE:BAC) that have significant presence in its markets.
5. Sales Growth
Two primary revenue streams drive bank earnings. While net interest income, which is earned by charging higher rates on loans than paid on deposits, forms the foundation, fee-based services across banking, credit, wealth management, and trading operations provide additional income. Thankfully, Provident Financial Services’s 17.7% annualized revenue growth over the last five years was excellent. Its growth beat the average banking company and shows its offerings resonate with customers.
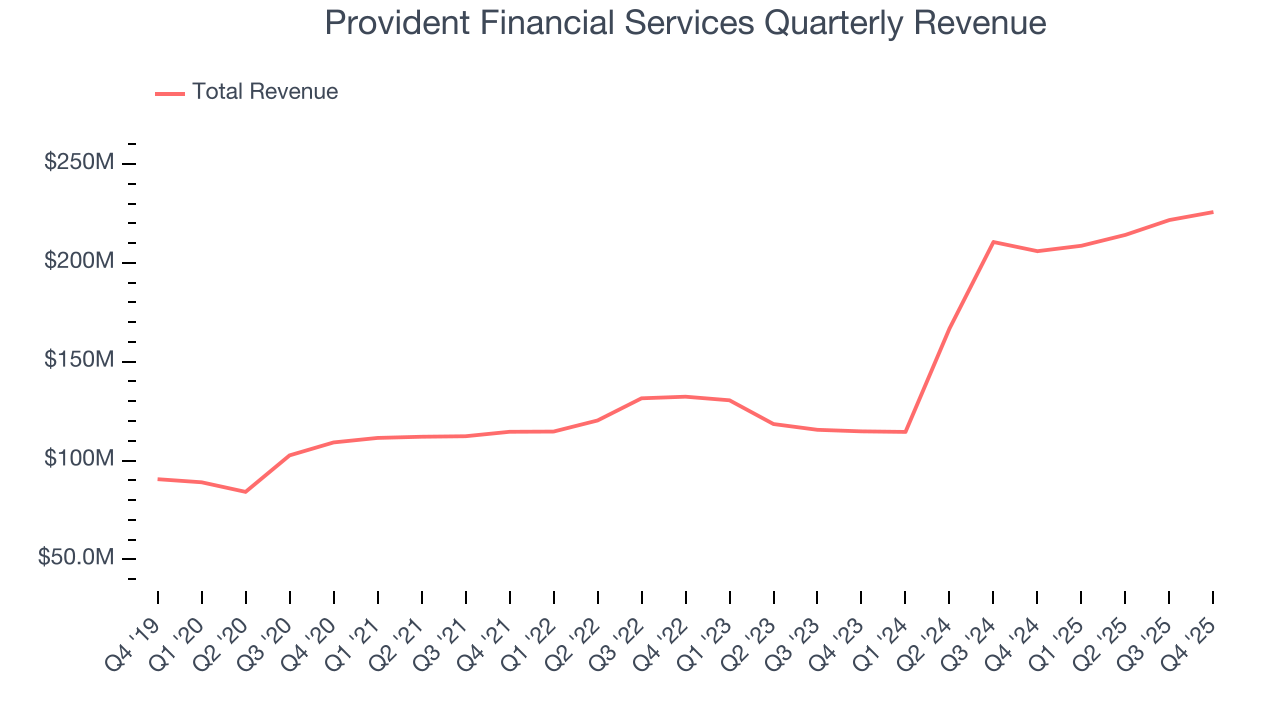
We at StockStory place the most emphasis on long-term growth, but within financials, a half-decade historical view may miss recent interest rate changes, market returns, and industry trends. Provident Financial Services’s annualized revenue growth of 34.8% over the last two years is above its five-year trend, suggesting its demand was strong and recently accelerated. 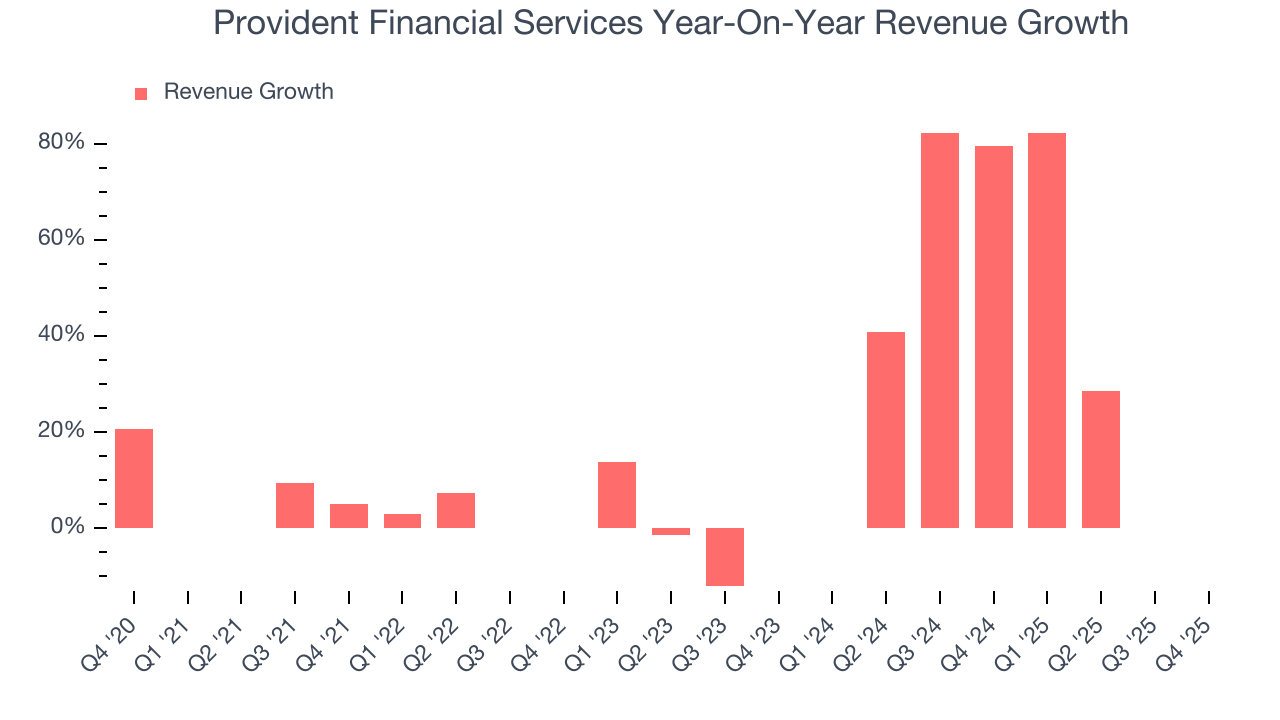 Note: Quarters not shown were determined to be outliers, impacted by outsized investment gains/losses that are not indicative of the recurring fundamentals of the business.
This quarter, Provident Financial Services reported year-on-year revenue growth of 9.6%, and its $225.7 million of revenue exceeded Wall Street’s estimates by 1%.
Net interest income made up 84.2% of the company’s total revenue during the last five years, meaning Provident Financial Services barely relies on non-interest income to drive its overall growth.
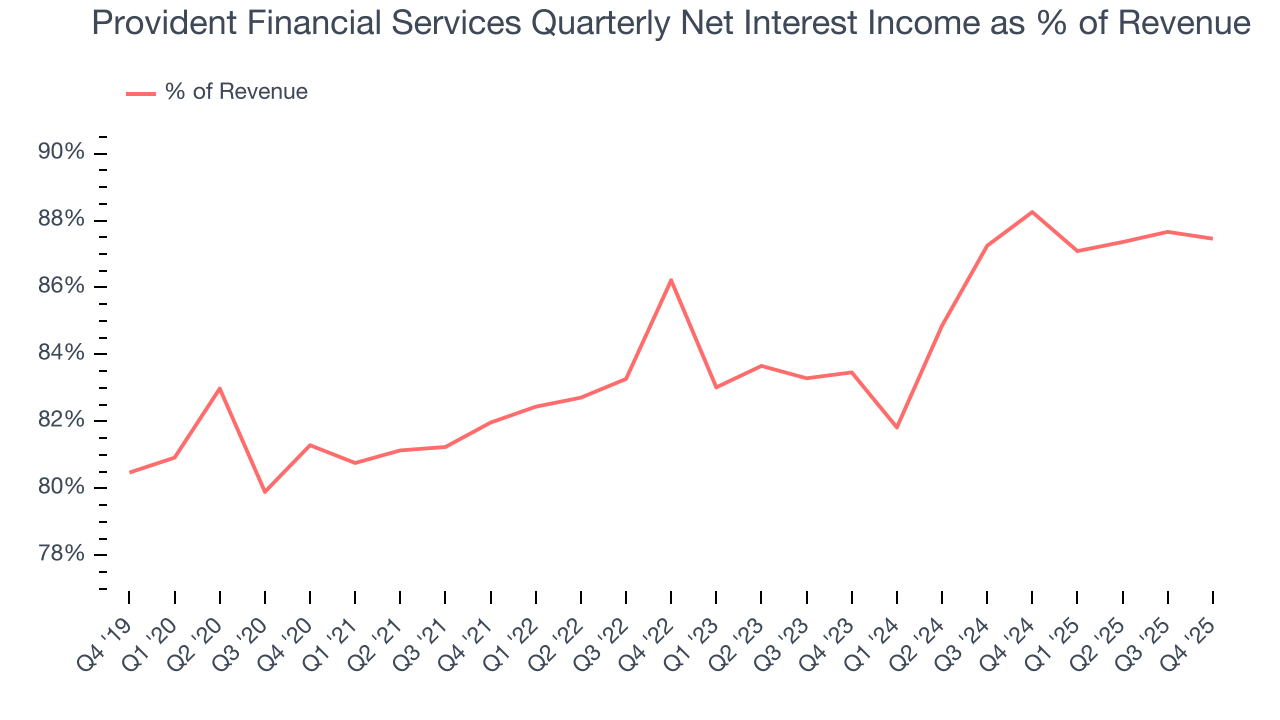
While banks generate revenue from multiple sources, investors view net interest income as the cornerstone - its predictable, recurring characteristics stand in sharp contrast to the volatility of non-interest income.
6. Earnings Per Share
Revenue trends explain a company’s historical growth, but the long-term change in earnings per share (EPS) points to the profitability of that growth – for example, a company could inflate its sales through excessive spending on advertising and promotions.
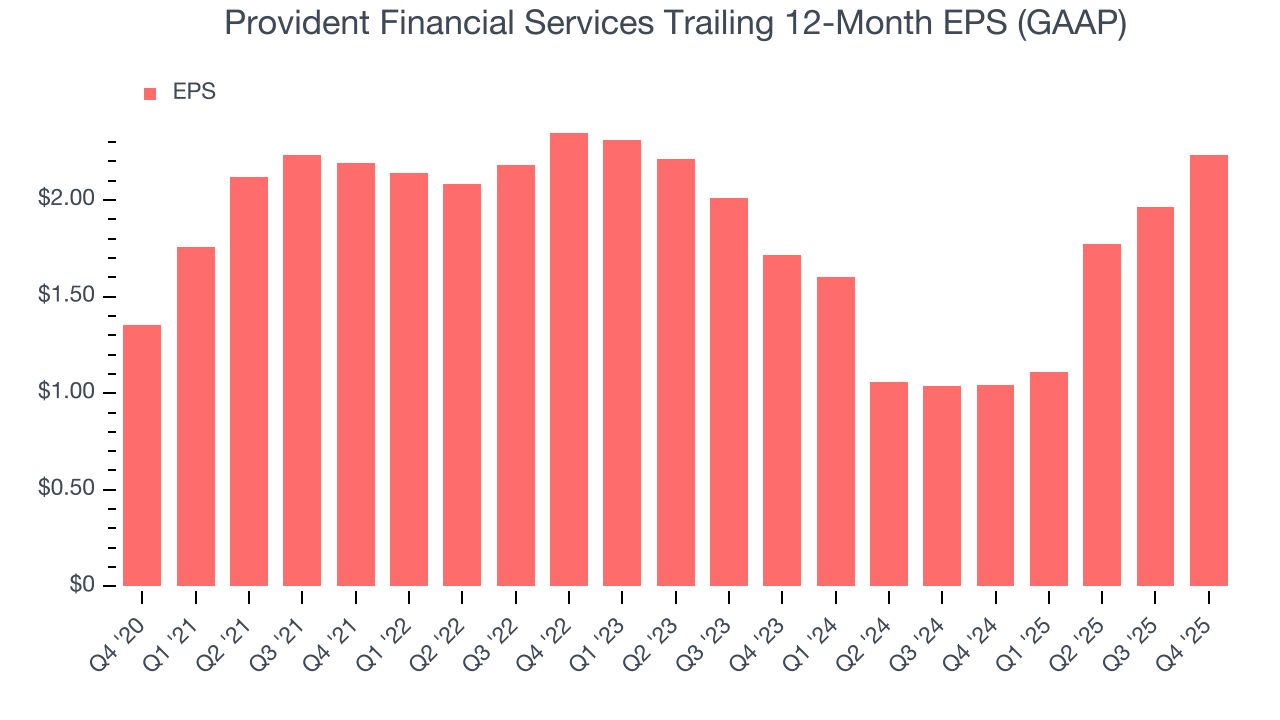
Provident Financial Services’s EPS grew at a decent 10.5% compounded annual growth rate over the last five years. However, this performance was lower than its 17.7% annualized revenue growth, telling us the company became less profitable on a per-share basis as it expanded.
Like with revenue, we analyze EPS over a shorter period to see if we are missing a change in the business.
For Provident Financial Services, its two-year annual EPS growth of 14.1% was higher than its five-year trend. Accelerating earnings growth is almost always an encouraging data point.
In Q4, Provident Financial Services reported EPS of $0.64, up from $0.37 in the same quarter last year. This print easily cleared analysts’ estimates, and shareholders should be content with the results. Over the next 12 months, Wall Street expects Provident Financial Services’s full-year EPS of $2.23 to grow 6.5%.
7. Tangible Book Value Per Share (TBVPS)
Banks profit by intermediating between depositors and borrowers, making them fundamentally balance sheet-driven enterprises. Market participants emphasize balance sheet quality and sustained book value growth when evaluating these institutions.
Because of this, tangible book value per share (TBVPS) emerges as the critical performance benchmark. By excluding intangible assets with uncertain liquidation values, this metric captures real, liquid net worth per share. Traditional metrics like EPS are helpful but face distortion from M&A activity and loan loss accounting rules.
Provident Financial Services’s TBVPS was flat over the last five years. A turnaround doesn’t seem to be in sight as its TBVPS also dropped by 2.1% annually over the last two years ($16.39 to $15.70 per share).
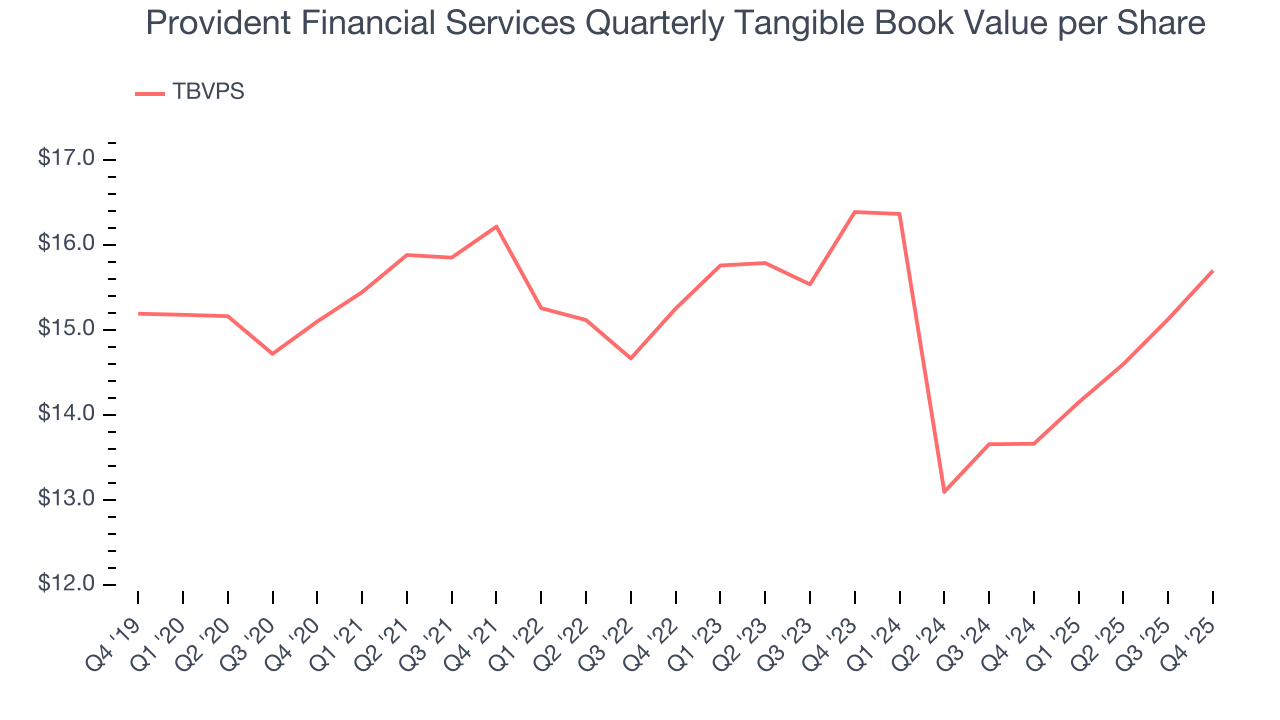
Over the next 12 months, Consensus estimates call for Provident Financial Services’s TBVPS to grow by 8.9% to $17.10, paltry growth rate.
8. Balance Sheet Assessment
Leverage is core to a financial firm’s business model (loans funded by deposits). To ensure economic stability and avoid a repeat of the 2008 GFC, regulators require certain levels of capital and liquidity, focusing on the Tier 1 capital ratio.
Tier 1 capital is the highest-quality capital that a firm holds, consisting primarily of common stock and retained earnings, but also physical gold. It serves as the primary cushion against losses and is the first line of defense in times of financial distress.
This capital is divided by risk-weighted assets to derive the Tier 1 capital ratio. Risk-weighted means that cash and US treasury securities are assigned little risk while unsecured consumer loans and equity investments get much higher risk weights, for example.
New regulation after the 2008 financial crisis requires that all firms must maintain a Tier 1 capital ratio greater than 4.5%. On top of this, there are additional buffers based on scale, risk profile, and other regulatory classifications, so that at the end of the day, firms generally must maintain a 7-10% ratio at minimum.
Over the last two years, Provident Financial Services has averaged a Tier 1 capital ratio of 10.2%, which is considered safe and well capitalized in the event that macro or market conditions suddenly deteriorate.
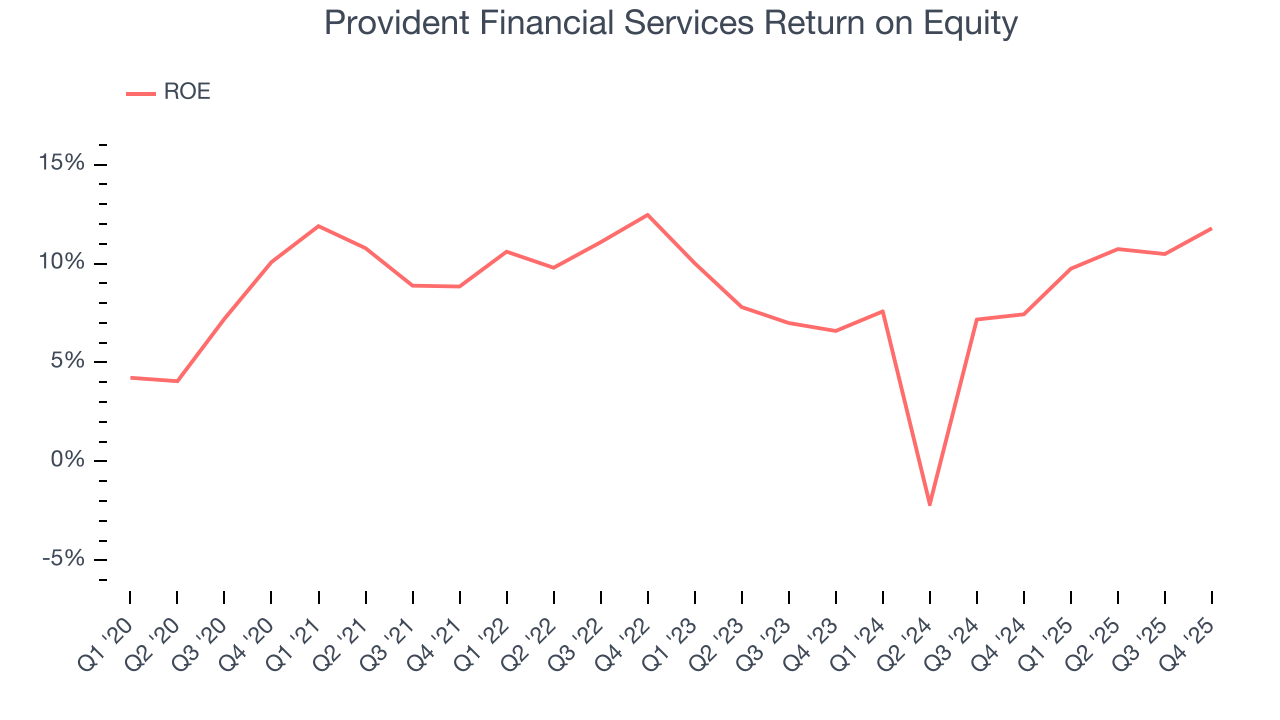
9. Return on Equity
Return on equity, or ROE, quantifies bank profitability relative to shareholder equity - an essential capital source for these institutions. Over extended periods, superior ROE performance drives faster shareholder wealth compounding through reinvestment, share repurchases, and dividend growth.
Over the last five years, Provident Financial Services has averaged an ROE of 8.9%, uninspiring for a company operating in a sector where the average shakes out around 7.5%.
10. Key Takeaways from Provident Financial Services’s Q4 Results
It was good to see Provident Financial Services beat analysts’ EPS expectations this quarter. We were also happy its tangible book value per share narrowly outperformed Wall Street’s estimates. Overall, we think this was a decent quarter with some key metrics above expectations. The stock remained flat at $21.02 immediately after reporting.
11. Is Now The Time To Buy Provident Financial Services?
Updated: March 20, 2026 at 12:22 AM EDT
A common mistake we notice when investors are deciding whether to buy a stock or not is that they simply look at the latest earnings results. Business quality and valuation matter more, so we urge you to understand these dynamics as well.
Provident Financial Services isn’t a terrible business, but it doesn’t pass our bar. Although its revenue growth was impressive over the last five years, it’s expected to deteriorate over the next 12 months and its estimated net interest income for the next 12 months are weak. And while the company’s net interest income growth was exceptional over the last five years, the downside is its TBVPS growth was weak over the last five years.
Provident Financial Services’s P/B ratio based on the next 12 months is 0.9x. This valuation is reasonable, but the company’s shakier fundamentals present too much downside risk. We're fairly confident there are better investments elsewhere.
Wall Street analysts have a consensus one-year price target of $25 on the company (compared to the current share price of $20.28).
Although the price target is bullish, readers should exercise caution because analysts tend to be overly optimistic. The firms they work for, often big banks, have relationships with companies that extend into fundraising, M&A advisory, and other rewarding business lines. As a result, they typically hesitate to say bad things for fear they will lose out. We at StockStory do not suffer from such conflicts of interest, so we’ll always tell it like it is.