
PNC Financial Services Group (PNC)
PNC Financial Services Group doesn’t excite us. Its sluggish sales growth shows demand is soft, a worrisome sign for investors in high-quality stocks.― StockStory Analyst Team
1. News


2. Summary
Why PNC Financial Services Group Is Not Exciting
Tracing its roots back to 1852 when Pittsburgh's industrial boom demanded stronger financial institutions, PNC (NYSE:PNC) is a diversified financial institution that provides retail banking, corporate banking, and asset management services through a coast-to-coast branch network.
- Net interest margin of 2.7% reflects its high servicing and capital costs
- Estimated tangible book value per share growth of 4.3% for the next 12 months implies profitability will slow from its two-year trend
- On the bright side, its incremental sales significantly boosted profitability as its annual earnings per share growth of 21.7% over the last five years outstripped its revenue performance


PNC Financial Services Group is in the penalty box. Better businesses are for sale in the market.
Why There Are Better Opportunities Than PNC Financial Services Group


PNC Financial Services Group is trading at $204.24 per share, or 1.3x forward P/B. This multiple is higher than most banking companies, and we think it’s quite expensive for the weaker revenue growth you get.
We prefer to invest in similarly-priced but higher-quality companies with superior earnings growth.
3. PNC Financial Services Group (PNC) Research Report: Q4 CY2025 Update
Financial services giant PNC (NYSE:PNC) reported revenue ahead of Wall Streets expectations in Q4 CY2025, with sales up 8.5% year on year to $6.07 billion. Its GAAP profit of $4.88 per share was 15.9% above analysts’ consensus estimates.
PNC Financial Services Group (PNC) Q4 CY2025 Highlights:
- Net Interest Income: $3.73 billion vs analyst estimates of $3.73 billion (5.9% year-on-year growth, in line)
- Net Interest Margin: 2.8% vs analyst estimates of 2.8% (in line)
- Revenue: $6.07 billion vs analyst estimates of $5.97 billion (8.5% year-on-year growth, 1.7% beat)
- Efficiency Ratio: 59% vs analyst estimates of 59.2% (16.3 basis point beat)
- EPS (GAAP): $4.88 vs analyst estimates of $4.21 (15.9% beat)
- Tangible Book Value per Share: $112.51 vs analyst estimates of $109.91 (18% year-on-year growth, 2.4% beat)
- Market Capitalization: $84.33 billion
Company Overview
Tracing its roots back to 1852 when Pittsburgh's industrial boom demanded stronger financial institutions, PNC (NYSE:PNC) is a diversified financial institution that provides retail banking, corporate banking, and asset management services through a coast-to-coast branch network.
PNC operates through three main business segments that serve different customer needs. The Retail Banking segment focuses on building primary customer relationships by offering deposit accounts, mortgages, auto loans, credit cards, and investment products to individuals and small businesses. This segment maintains a nationwide branch network complemented by digital banking capabilities and ATMs.
The Corporate & Institutional Banking segment serves larger businesses with traditional banking products alongside specialized services like treasury management, capital markets advisory, and commercial mortgage banking. This division helps companies manage cash flow, raise capital, execute mergers and acquisitions, and finance commercial real estate projects.
The Asset Management Group caters to affluent individuals and institutions through two primary businesses: PNC Private Bank and Institutional Asset Management. Private Bank clients receive personalized banking, trust, and investment management services, while institutional clients benefit from outsourced investment management, custody solutions, and retirement plan services.
PNC generates revenue through interest income on loans and securities, as well as fees from various financial services. For example, a mid-sized manufacturing company might use PNC's treasury management services to optimize cash flow, access working capital through a revolving credit facility, and receive advisory services for expansion financing. Meanwhile, an affluent individual might utilize PNC Private Bank for wealth planning, trust services, and investment management.
4. Diversified Banks
At their core, diversified banks take in deposits and engage in various forms of lending, which means revenue is generated through interest rate spreads (difference between loan and deposit rates) and fees. Other revenue comes from adjacent services such as wealth management, card and account fees, and products such as annuities. These institutions benefit from rising interest rates that improve NIMs (net interest margins), digital transformation reducing operational costs, and expanding wealth management services as populations age. However, they face headwinds including fintech competition disrupting traditional models (how disruptive is crypto?), stringent regulatory requirements increasing compliance costs, and cybersecurity threats requiring substantial technology investments. Economic downturns also pose risks through potential loan defaults and compressed margins during accommodative monetary policy periods.
PNC's primary competitors include other large U.S. financial institutions such as JPMorgan Chase (NYSE:JPM), Bank of America (NYSE:BAC), Wells Fargo (NYSE:WFC), and U.S. Bancorp (NYSE:USB), as well as regional banks like Truist Financial (NYSE:TFC) and Fifth Third Bancorp (NASDAQ:FITB).
5. Sales Growth
From lending activities to service fees, most banks build their revenue model around two income sources. Interest rate spreads between loans and deposits create the first stream, with the second coming from charges on everything from basic bank accounts to complex investment banking transactions. Unfortunately, PNC Financial Services Group’s 6.2% annualized revenue growth over the last five years was tepid. This was below our standard for the banking sector and is a tough starting point for our analysis.
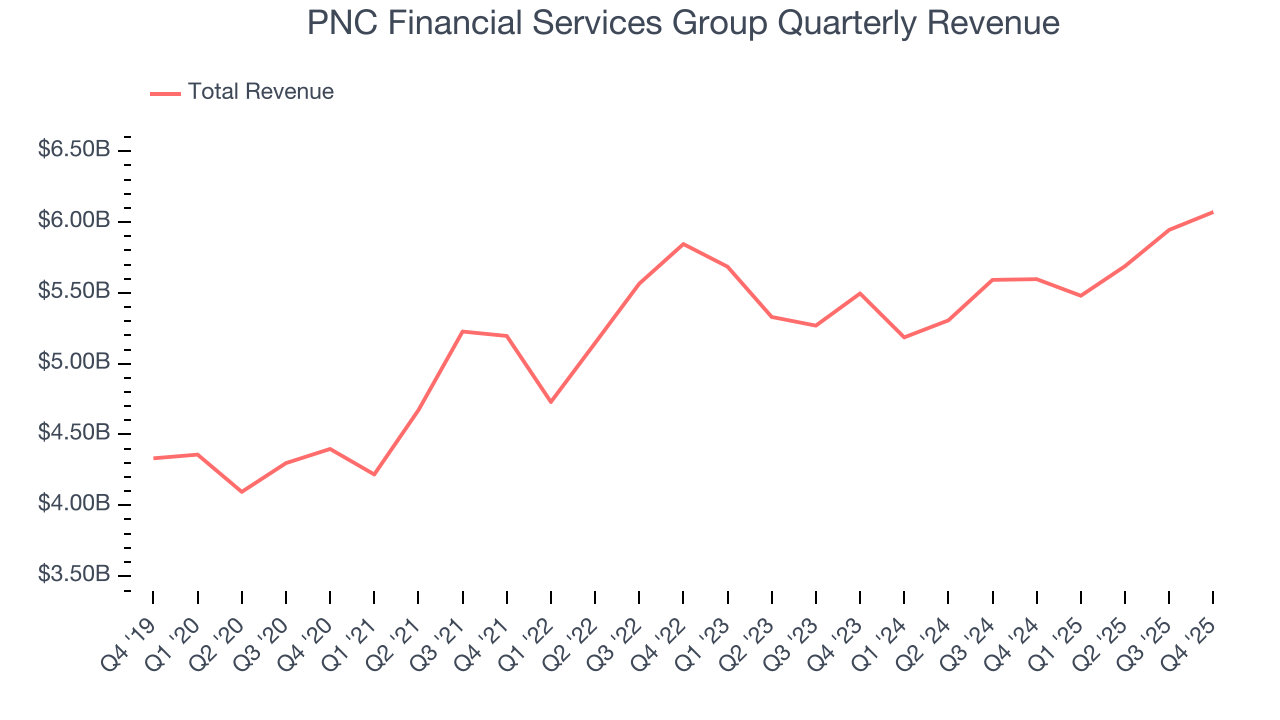
We at StockStory place the most emphasis on long-term growth, but within financials, a half-decade historical view may miss recent interest rate changes, market returns, and industry trends. PNC Financial Services Group’s recent performance shows its demand has slowed as its annualized revenue growth of 3.2% over the last two years was below its five-year trend. 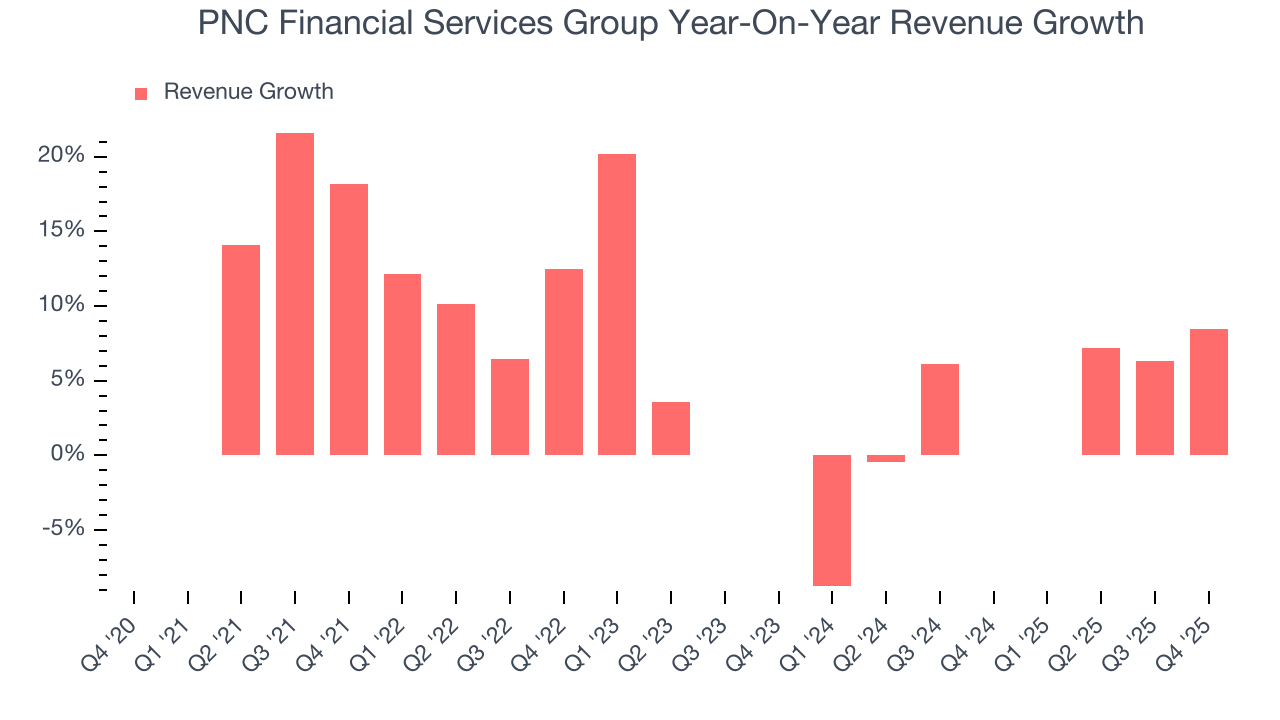 Note: Quarters not shown were determined to be outliers, impacted by outsized investment gains/losses that are not indicative of the recurring fundamentals of the business.
This quarter, PNC Financial Services Group reported year-on-year revenue growth of 8.5%, and its $6.07 billion of revenue exceeded Wall Street’s estimates by 1.7%.
Net interest income made up 60.9% of the company’s total revenue during the last five years, meaning lending operations are PNC Financial Services Group’s largest source of revenue.
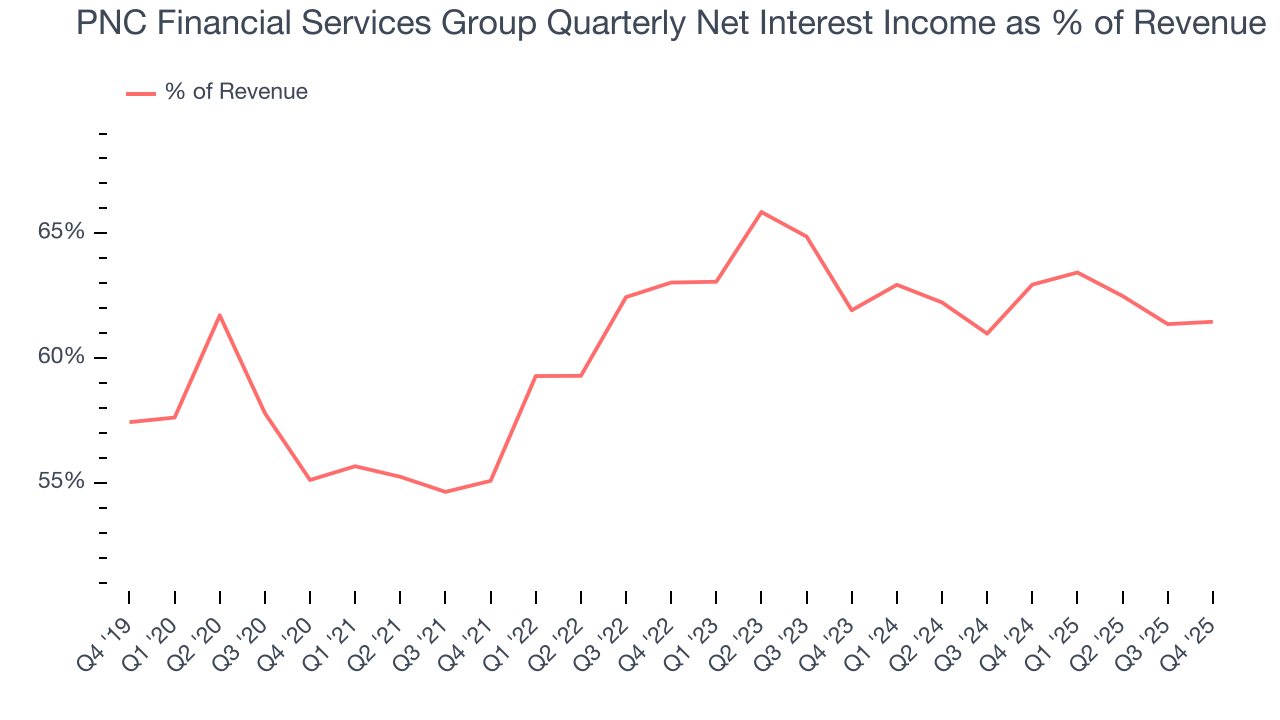
Markets consistently prioritize net interest income growth over fee-based revenue, recognizing its superior quality and recurring nature compared to the more unpredictable non-interest income streams.
6. Efficiency Ratio
Topline growth alone doesn't tell the complete story - the profitability of that growth shapes actual earnings impact. Banks track this dynamic through efficiency ratios, which compare non-interest expenses such as personnel, rent, IT, and marketing costs to total revenue streams.
Markets understand that a bank’s expense base depends on its revenue mix and what mostly drives share price performance is the change in this ratio, rather than its absolute value. It’s somewhat counterintuitive, but a lower efficiency ratio is better.
Over the last five years, PNC Financial Services Group’s efficiency ratio has swelled by 1.1 percentage points, going from 67.3% to 59.8%. Said differently, the company’s expenses have grown at a slower rate than revenue, which typically signals prudent management.
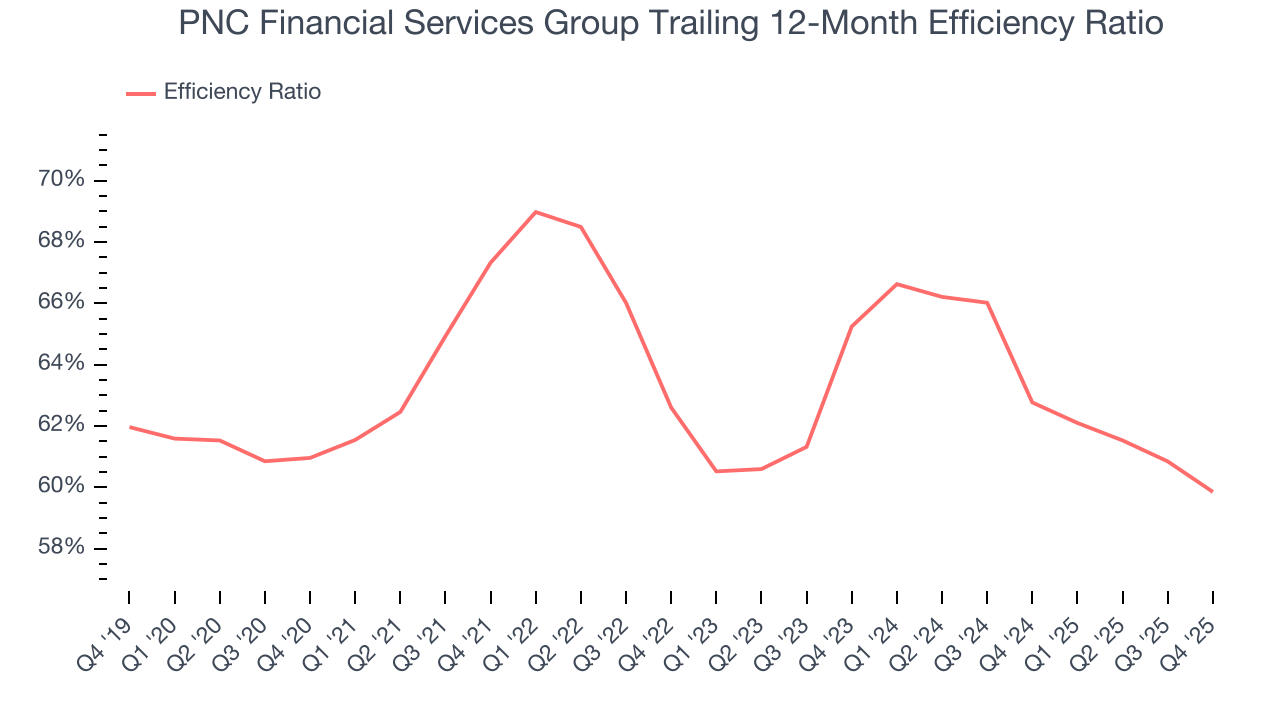
In Q4, PNC Financial Services Group’s efficiency ratio was 59%, beating analysts’ expectations by 45.8 basis points (100 basis points = 1 percentage point). This result was 4 percentage points better than the same quarter last year.
For the next 12 months, Wall Street expects PNC Financial Services Group to rein in some of its expenses as it anticipates an efficiency ratio of 58.2%.
7. Earnings Per Share
Revenue trends explain a company’s historical growth, but the long-term change in earnings per share (EPS) points to the profitability of that growth – for example, a company could inflate its sales through excessive spending on advertising and promotions.
PNC Financial Services Group’s flat EPS over the last five years was below its 6.2% annualized revenue growth. However, its efficiency ratio didn’t change during this time, telling us that non-fundamental factors such as interest and taxes affected its ultimate earnings.
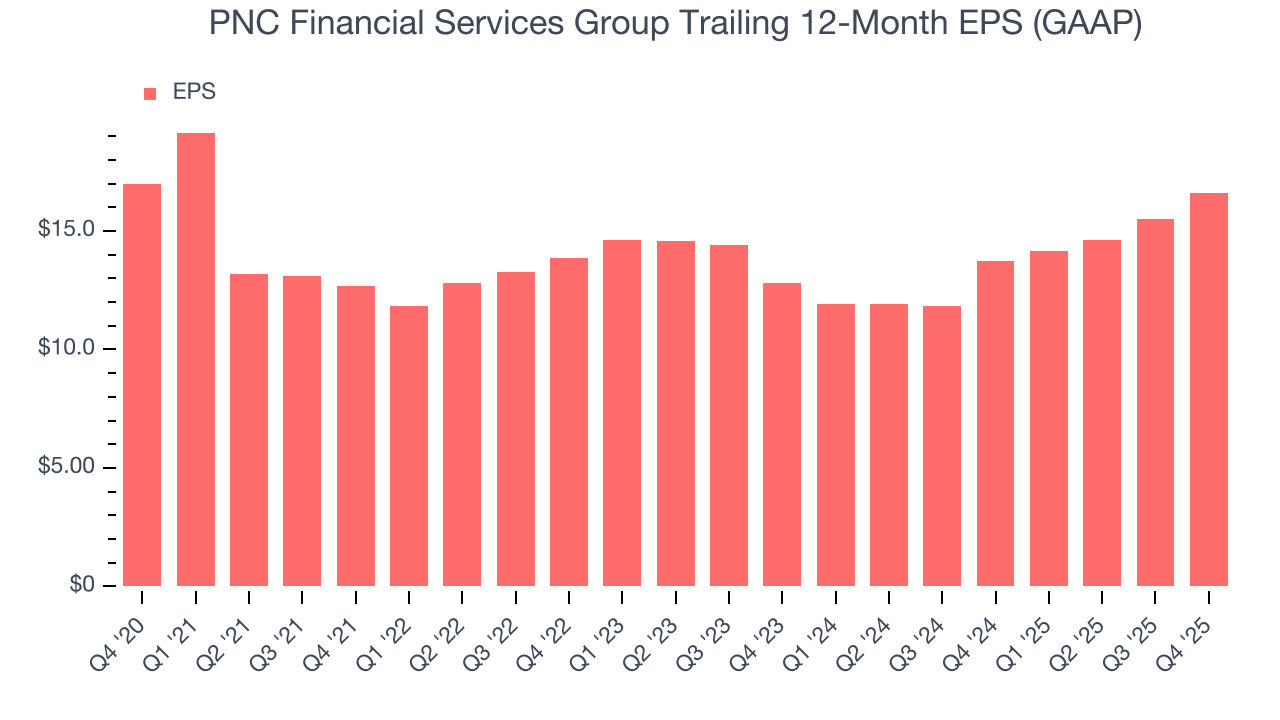
Like with revenue, we analyze EPS over a shorter period to see if we are missing a change in the business.
For PNC Financial Services Group, its two-year annual EPS growth of 13.9% was higher than its five-year trend. Accelerating earnings growth is almost always an encouraging data point.
In Q4, PNC Financial Services Group reported EPS of $4.88, up from $3.77 in the same quarter last year. This print easily cleared analysts’ estimates, and shareholders should be content with the results. Over the next 12 months, Wall Street expects PNC Financial Services Group’s full-year EPS of $16.60 to grow 8.4%.
8. Tangible Book Value Per Share (TBVPS)
Banks are balance sheet-driven businesses because they generate earnings primarily through borrowing and lending. They’re also valued based on their balance sheet strength and ability to compound book value (another name for shareholders’ equity) over time.
This explains why tangible book value per share (TBVPS) stands as the premier banking metric. TBVPS strips away questionable intangible assets, revealing concrete per-share net worth that investors can trust. EPS can become murky due to acquisition impacts or accounting flexibility around loan provisions, and TBVPS resists financial engineering manipulation.
PNC Financial Services Group’s TBVPS grew at a sluggish 2.9% annual clip over the last five years. However, TBVPS growth has accelerated recently, growing by 14.9% annually over the last two years from $85.26 to $112.51 per share.
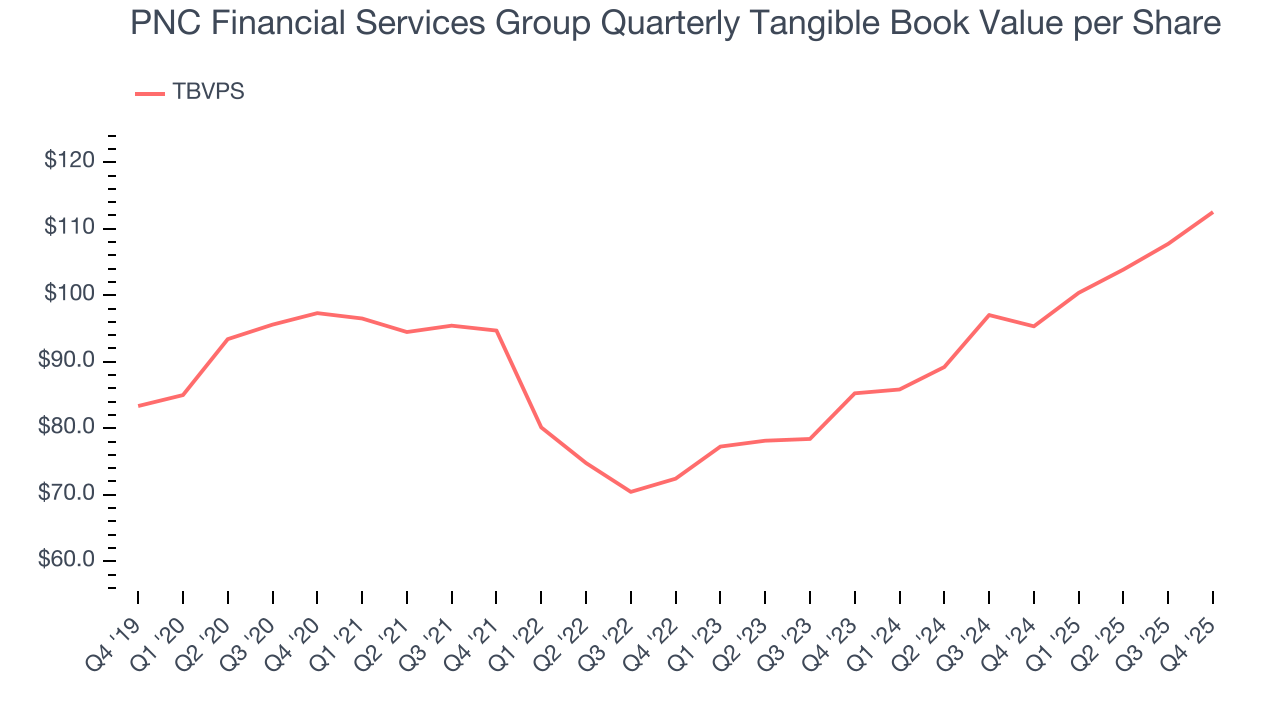
Over the next 12 months, Consensus estimates call for PNC Financial Services Group’s TBVPS to grow by 4.6% to $117.68, lousy growth rate.
9. Balance Sheet Assessment
Leverage is core to a financial firm’s business model (loans funded by deposits). To ensure economic stability and avoid a repeat of the 2008 GFC, regulators require certain levels of capital and liquidity, focusing on the Tier 1 capital ratio.
Tier 1 capital is the highest-quality capital that a firm holds, consisting primarily of common stock and retained earnings, but also physical gold. It serves as the primary cushion against losses and is the first line of defense in times of financial distress.
This capital is divided by risk-weighted assets to derive the Tier 1 capital ratio. Risk-weighted means that cash and US treasury securities are assigned little risk while unsecured consumer loans and equity investments get much higher risk weights, for example.
New regulation after the 2008 financial crisis requires that all firms must maintain a Tier 1 capital ratio greater than 4.5%. On top of this, there are additional buffers based on scale, risk profile, and other regulatory classifications, so that at the end of the day, firms generally must maintain a 7-10% ratio at minimum.
Over the last two years, PNC Financial Services Group has averaged a Tier 1 capital ratio of 11.1%, which is considered safe and well capitalized in the event that macro or market conditions suddenly deteriorate.
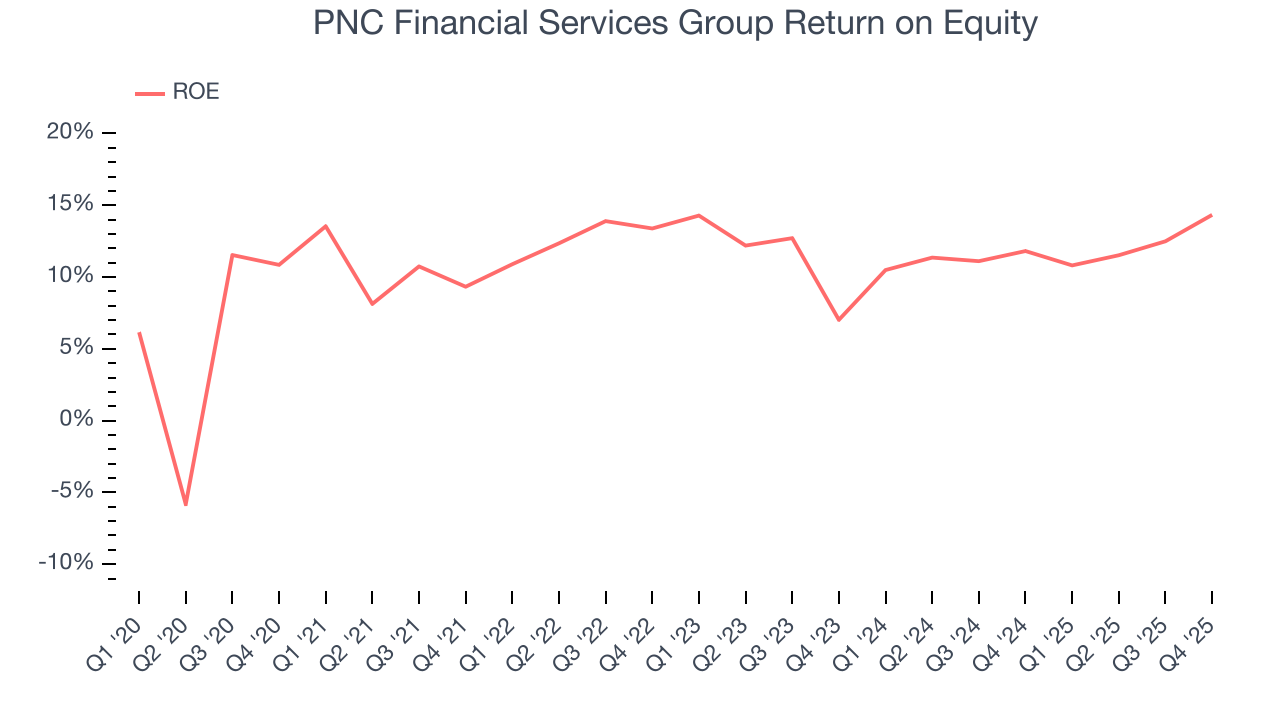
10. Return on Equity
Return on equity (ROE) measures how effectively banks generate profit from each dollar of shareholder equity - a critical funding source. High-ROE institutions typically compound shareholder wealth faster over time through retained earnings, share repurchases, and dividend payments.
Over the last five years, PNC Financial Services Group has averaged an ROE of 11.6%, respectable for a company operating in a sector where the average shakes out around 7.5% and those putting up 15%+ are greatly admired.
11. Key Takeaways from PNC Financial Services Group’s Q4 Results
It was good to see PNC Financial Services Group beat analysts’ EPS expectations this quarter. We were also happy its tangible book value per share outperformed Wall Street’s estimates. Overall, we think this was a solid quarter with some key areas of upside. The stock traded up 2.8% to $221 immediately following the results.
12. Is Now The Time To Buy PNC Financial Services Group?
Updated: March 20, 2026 at 12:38 AM EDT
A common mistake we notice when investors are deciding whether to buy a stock or not is that they simply look at the latest earnings results. Business quality and valuation matter more, so we urge you to understand these dynamics as well.
PNC Financial Services Group isn’t a terrible business, but it isn’t one of our picks. To kick things off, its revenue growth was uninspiring over the last five years. While its astounding EPS growth over the last five years shows its profits are trickling down to shareholders, the downside is its net interest margin limits its operating profit potential compared to other banks that can earn more, all else equal.. On top of that, its estimated sales for the next 12 months are weak.
PNC Financial Services Group’s P/B ratio based on the next 12 months is 1.3x. This valuation is reasonable, but the company’s shakier fundamentals present too much downside risk. We're pretty confident there are more exciting stocks to buy at the moment.
Wall Street analysts have a consensus one-year price target of $251.90 on the company (compared to the current share price of $204.24).
Although the price target is bullish, readers should exercise caution because analysts tend to be overly optimistic. The firms they work for, often big banks, have relationships with companies that extend into fundraising, M&A advisory, and other rewarding business lines. As a result, they typically hesitate to say bad things for fear they will lose out. We at StockStory do not suffer from such conflicts of interest, so we’ll always tell it like it is.