
Parsons (PSN)
We aren’t fans of Parsons. Its weak returns on capital suggest it doesn’t generate sufficient profits, a sign of value destruction.― StockStory Analyst Team
1. News


2. Summary
Why Parsons Is Not Exciting
Delivering aerospace technology during the Cold War-era, Parsons (NYSE:PSN) offers engineering, construction, and cybersecurity solutions for the infrastructure and defense sectors.
- Underwhelming 6.8% return on capital reflects management’s difficulties in finding profitable growth opportunities
- Estimated sales growth of 5.1% for the next 12 months implies demand will slow from its two-year trend
- A silver lining is that its solid 10.2% annual revenue growth over the last five years indicates its offering’s solve complex business issues


Parsons’s quality isn’t great. We see more attractive opportunities in the market.
Why There Are Better Opportunities Than Parsons


Parsons is trading at $52.16 per share, or 16.4x forward P/E. Parsons’s multiple may seem like a great deal among industrials peers, but we think there are valid reasons why it’s this cheap.
It’s better to pay up for high-quality businesses with higher long-term earnings potential rather than to buy lower-quality stocks because they appear cheap. These challenged businesses often don’t re-rate, a phenomenon known as a “value trap”.
3. Parsons (PSN) Research Report: Q4 CY2025 Update
Infrastructure and defense services provider Parsons (NYSE:PSN) missed Wall Street’s revenue expectations in Q4 CY2025, with sales falling 7.5% year on year to $1.60 billion. The company’s full-year revenue guidance of $6.65 million at the midpoint came in 99.9% below analysts’ estimates. Its non-GAAP profit of $0.75 per share was 4.9% below analysts’ consensus estimates.
Parsons (PSN) Q4 CY2025 Highlights:
- Revenue: $1.60 billion vs analyst estimates of $1.67 billion (7.5% year-on-year decline, 4.1% miss)
- Adjusted EPS: $0.75 vs analyst expectations of $0.79 (4.9% miss)
- Adjusted EBITDA: $153.3 million vs analyst estimates of $159.4 million (9.6% margin, 3.8% miss)
- EBITDA guidance for the upcoming financial year 2026 is $645 million at the midpoint, in line with analyst expectations
- Operating Margin: 6.6%, in line with the same quarter last year
- Free Cash Flow Margin: 8.5%, up from 6.2% in the same quarter last year
- Backlog: $8.72 billion at quarter end, down 2% year on year
- Market Capitalization: $7.48 billion
Company Overview
Delivering aerospace technology during the Cold War-era, Parsons (NYSE:PSN) offers engineering, construction, and cybersecurity solutions for the infrastructure and defense sectors.
Parsons was established to meet the needs of the post-World War II era. Since its founding, it has addressed challenges associated with rebuilding and expanding essential infrastructure and enhancing national defense capabilities. The company is therefore known for its capabilities in areas like threat protection for infrastructure such as bridges and waterways as well as missile defense systems.
Today, Parsons is enhancing its core competencies with digitization and software. Areas such as cybersecurity and intelligence services designed to protect national security interests are areas of investment. One example is Parsons's Border Security Integration system. It incorporates advanced sensors, data analytics, and unmanned aerial systems to strengthen border surveillance and control.
Parsons's revenue model is primarily based on project-based contracts. These contracts are mainly with government entities, including the Department of Defense and various federal and state agencies. However, the company also serves commercial clients in the infrastructure sector. The company is therefore always trying to balance bid discipline with high retention and win rates of contracts.
4. Defense Contractors
Defense contractors typically require technical expertise and government clearance. Companies in this sector can also enjoy long-term contracts with government bodies, leading to more predictable revenues. Combined, these factors create high barriers to entry and can lead to limited competition. Lately, geopolitical tensions–whether it be Russia’s invasion of Ukraine or China’s aggression towards Taiwan–highlight the need for defense spending. On the other hand, demand for these products can ebb and flow with defense budgets and even who is president, as different administrations can have vastly different ideas of how to allocate federal funds.
Competitors in the Government and commercial technology industry include Jacobs Solutions (NYSE:J), KBR (NYSE:KBR), and SAIC (NYSE:SAIC).
5. Revenue Growth
A company’s long-term sales performance is one signal of its overall quality. Any business can put up a good quarter or two, but the best consistently grow over the long haul. Luckily, Parsons’s sales grew at a solid 10.2% compounded annual growth rate over the last five years. Its growth beat the average industrials company and shows its offerings resonate with customers.
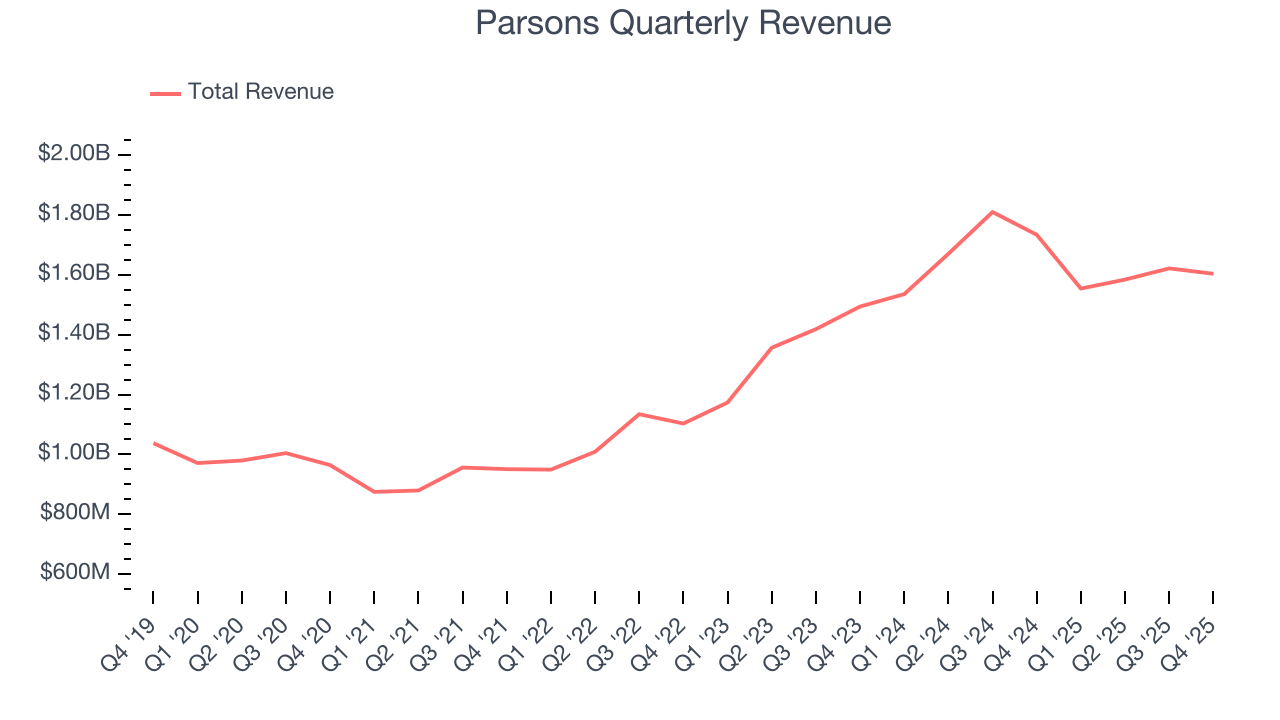
We at StockStory place the most emphasis on long-term growth, but within industrials, a half-decade historical view may miss cycles, industry trends, or a company capitalizing on catalysts such as a new contract win or a successful product line. Parsons’s annualized revenue growth of 8.1% over the last two years is below its five-year trend, but we still think the results were respectable. 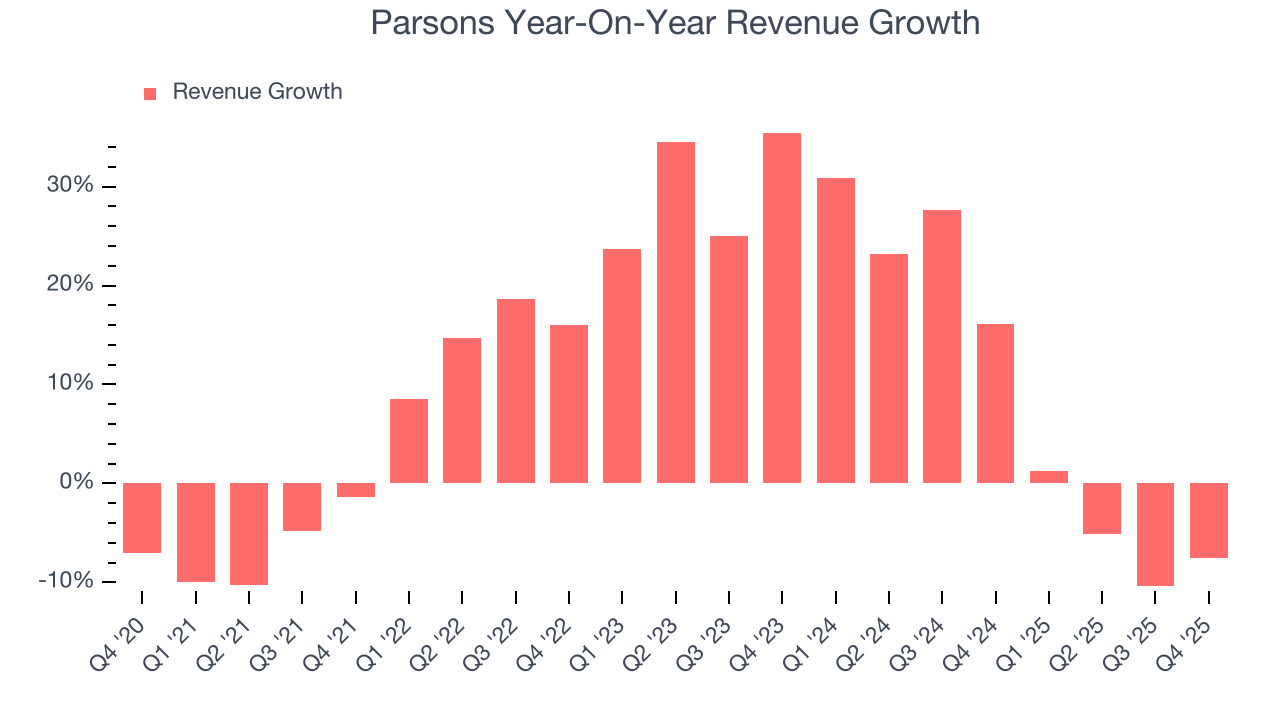
Parsons also reports its backlog, or the value of its outstanding orders that have not yet been executed or delivered. Parsons’s backlog reached $8.72 billion in the latest quarter and averaged 1.3% year-on-year growth over the last two years. Because this number is lower than its revenue growth, we can see the company fulfilled orders at a faster rate than it added new orders to the backlog. This implies Parsons was operating efficiently but raises questions about the health of its sales pipeline. 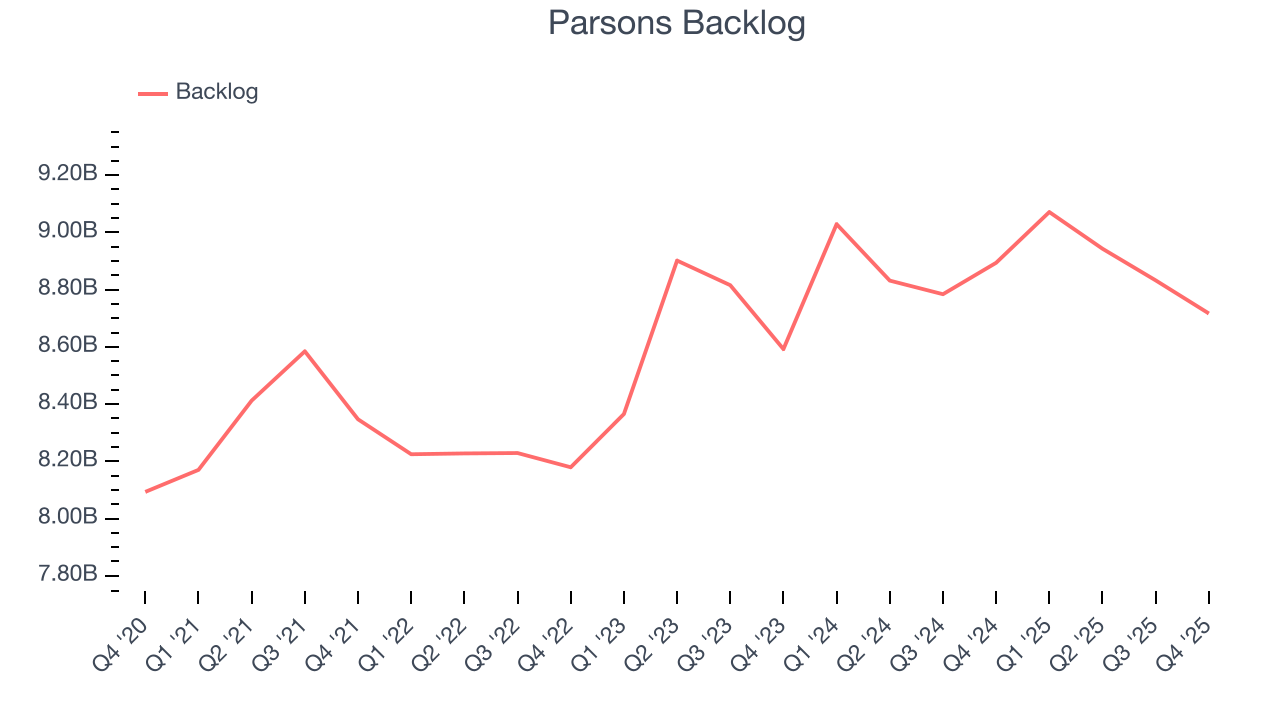
This quarter, Parsons missed Wall Street’s estimates and reported a rather uninspiring 7.5% year-on-year revenue decline, generating $1.60 billion of revenue.
Looking ahead, sell-side analysts expect revenue to grow 4.9% over the next 12 months, a deceleration versus the last two years. This projection is underwhelming and implies its products and services will see some demand headwinds.
6. Operating Margin
Operating margin is a key measure of profitability. Think of it as net income - the bottom line - excluding the impact of taxes and interest on debt, which are less connected to business fundamentals.
Parsons was profitable over the last five years but held back by its large cost base. Its average operating margin of 5.5% was weak for an industrials business.
On the plus side, Parsons’s operating margin rose by 3 percentage points over the last five years, as its sales growth gave it operating leverage.
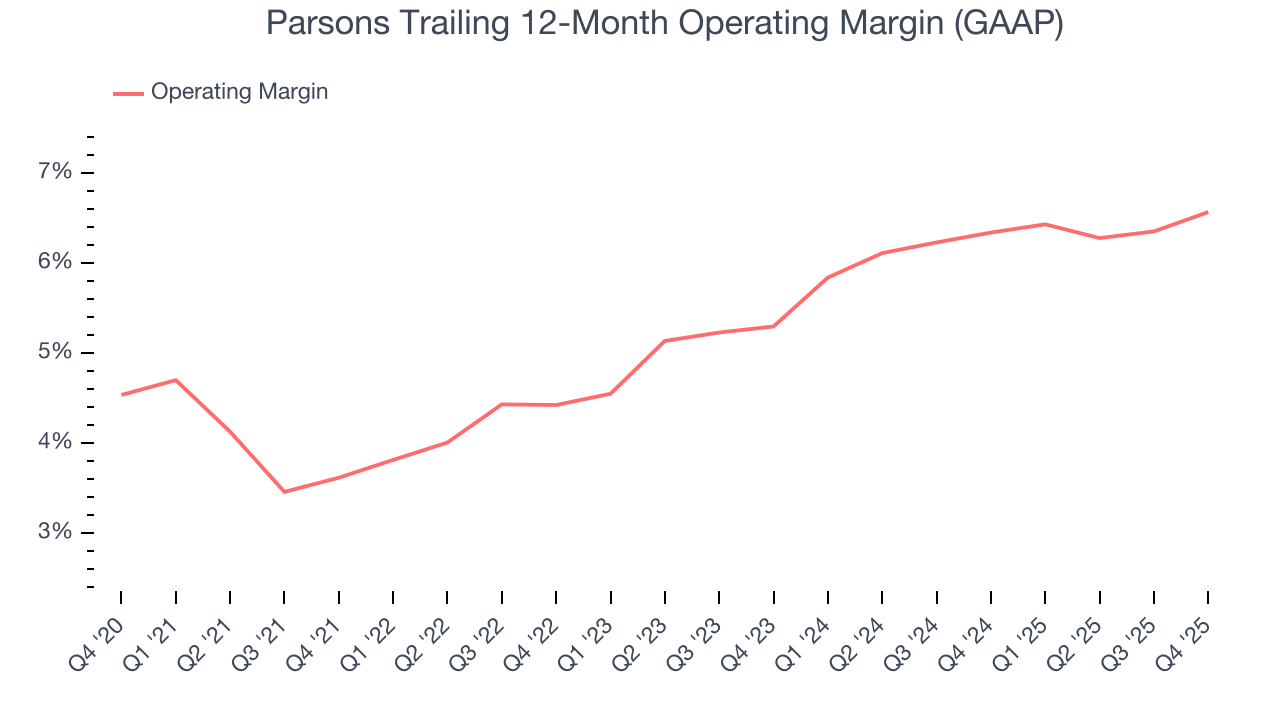
This quarter, Parsons generated an operating margin profit margin of 6.6%, in line with the same quarter last year. This indicates the company’s overall cost structure has been relatively stable.
7. Earnings Per Share
We track the long-term change in earnings per share (EPS) for the same reason as long-term revenue growth. Compared to revenue, however, EPS highlights whether a company’s growth is profitable.
Parsons’s solid 10.8% annual EPS growth over the last five years aligns with its revenue performance. This tells us its incremental sales were profitable.
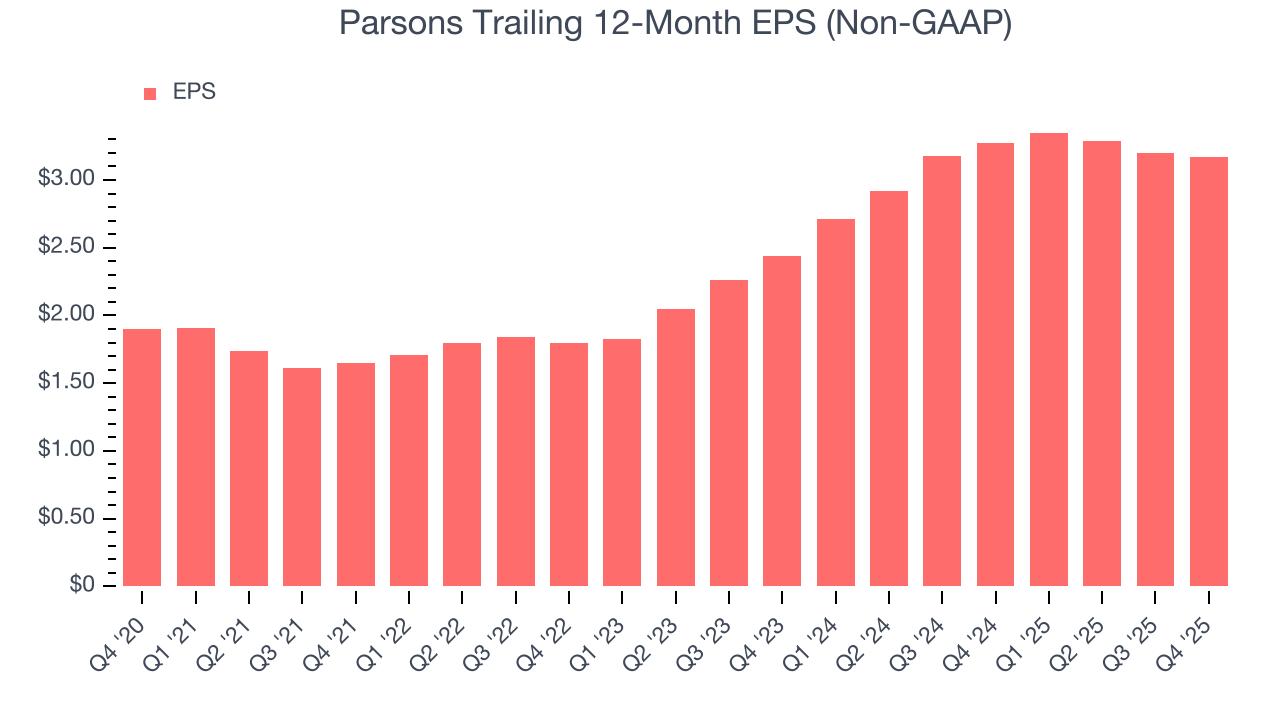
Like with revenue, we analyze EPS over a more recent period because it can provide insight into an emerging theme or development for the business.
Parsons’s two-year annual EPS growth of 14% was great and topped its 8.1% two-year revenue growth.
Diving into the nuances of Parsons’s earnings can give us a better understanding of its performance. While we mentioned earlier that Parsons’s operating margin was flat this quarter, a two-year view shows its margin has expandedwhile its share count has shrunk 6%. Improving profitability and share buybacks are positive signs for shareholders as they juice EPS growth relative to revenue growth. 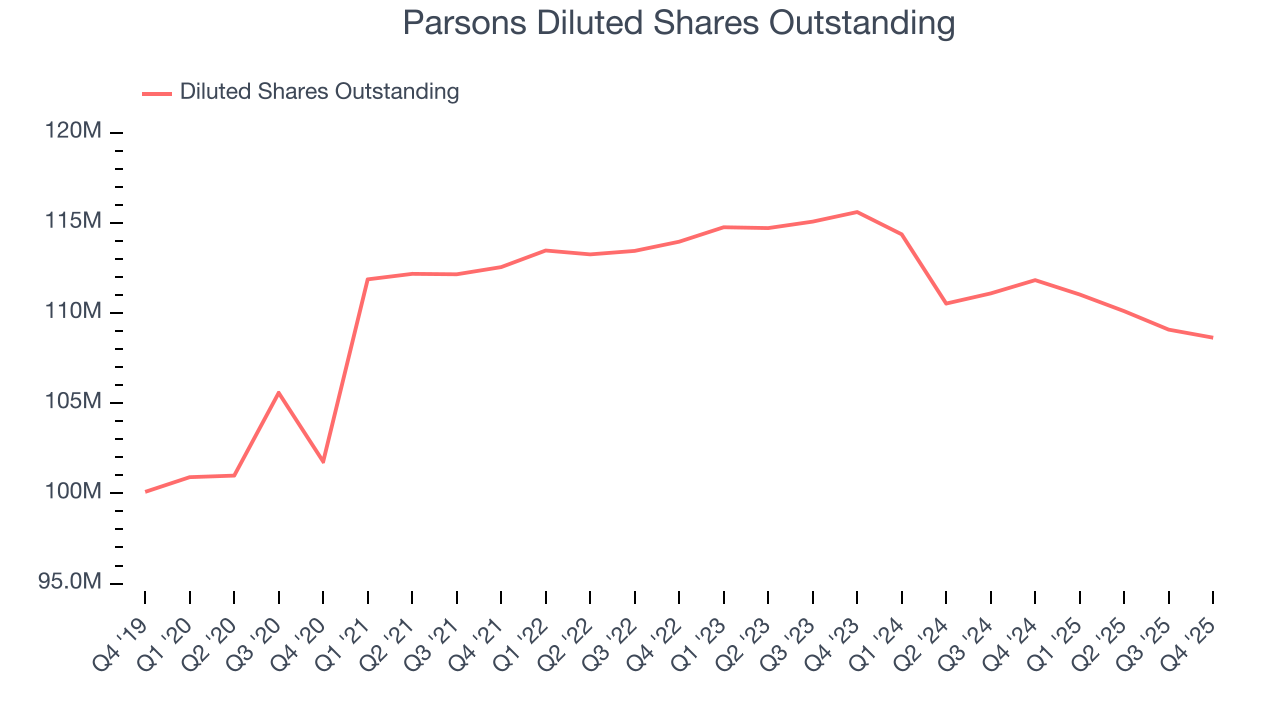
In Q4, Parsons reported adjusted EPS of $0.75, down from $0.78 in the same quarter last year. This print missed analysts’ estimates, but we care more about long-term adjusted EPS growth than short-term movements. Over the next 12 months, Wall Street expects Parsons’s full-year EPS of $3.17 to grow 6.4%.
8. Cash Is King
Although earnings are undoubtedly valuable for assessing company performance, we believe cash is king because you can’t use accounting profits to pay the bills.
Parsons has shown decent cash profitability, giving it some flexibility to reinvest or return capital to investors. The company’s free cash flow margin averaged 6.2% over the last five years, slightly better than the broader industrials sector.
Taking a step back, we can see that Parsons’s margin expanded by 1.4 percentage points during that time. This is encouraging because it gives the company more optionality.
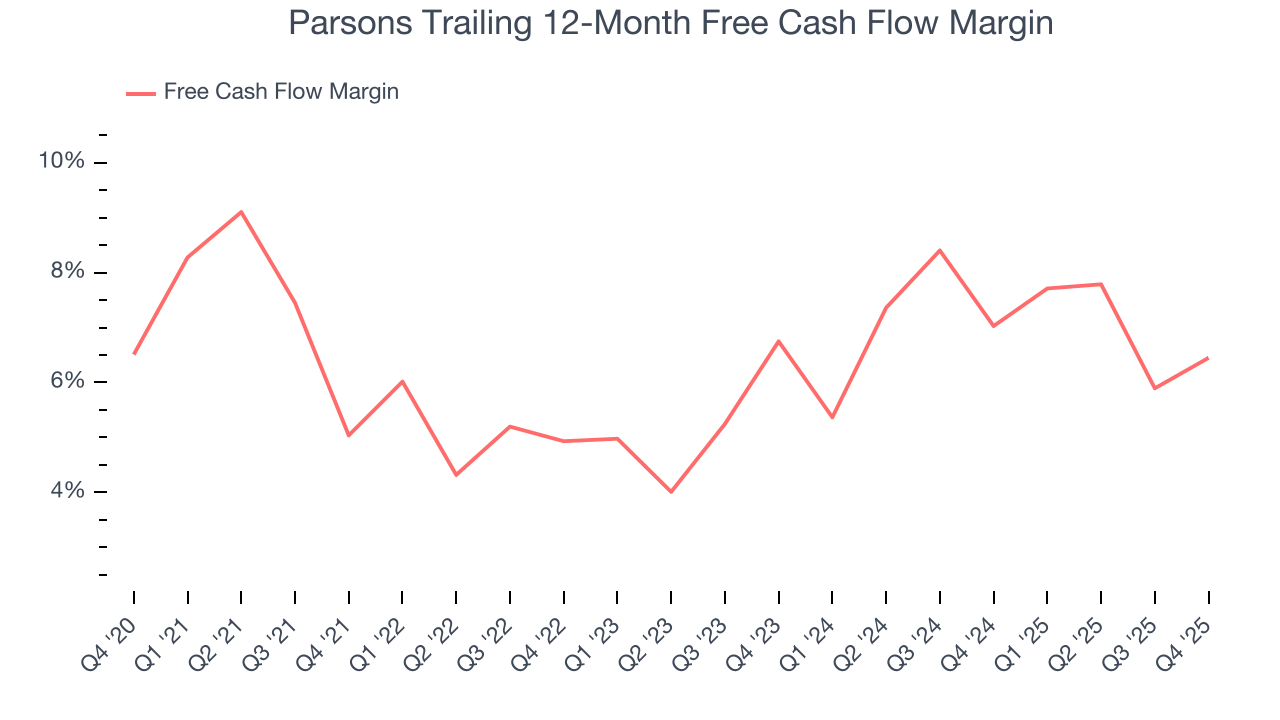
Parsons’s free cash flow clocked in at $135.6 million in Q4, equivalent to a 8.5% margin. This result was good as its margin was 2.2 percentage points higher than in the same quarter last year, building on its favorable historical trend.
9. Return on Invested Capital (ROIC)
EPS and free cash flow tell us whether a company was profitable while growing its revenue. But was it capital-efficient? A company’s ROIC explains this by showing how much operating profit it makes compared to the money it has raised (debt and equity).
Parsons historically did a mediocre job investing in profitable growth initiatives. Its five-year average ROIC was 7.1%, somewhat low compared to the best industrials companies that consistently pump out 20%+.
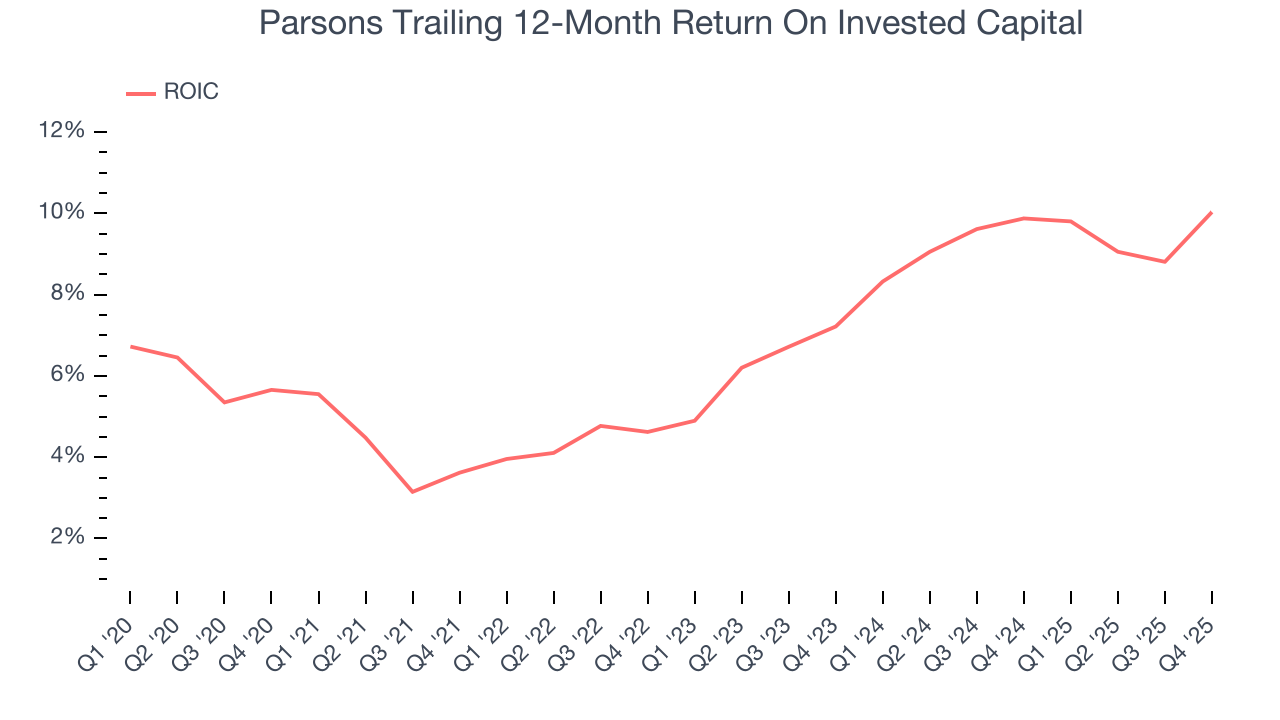
We like to invest in businesses with high returns, but the trend in a company’s ROIC is what often surprises the market and moves the stock price. Parsons’s ROIC has increased over the last few years. This is a good sign, and if its returns keep rising, there’s a chance it could evolve into an investable business.
10. Balance Sheet Assessment
Parsons reported $466.4 million of cash and $1.38 billion of debt on its balance sheet in the most recent quarter. As investors in high-quality companies, we primarily focus on two things: 1) that a company’s debt level isn’t too high and 2) that its interest payments are not excessively burdening the business.
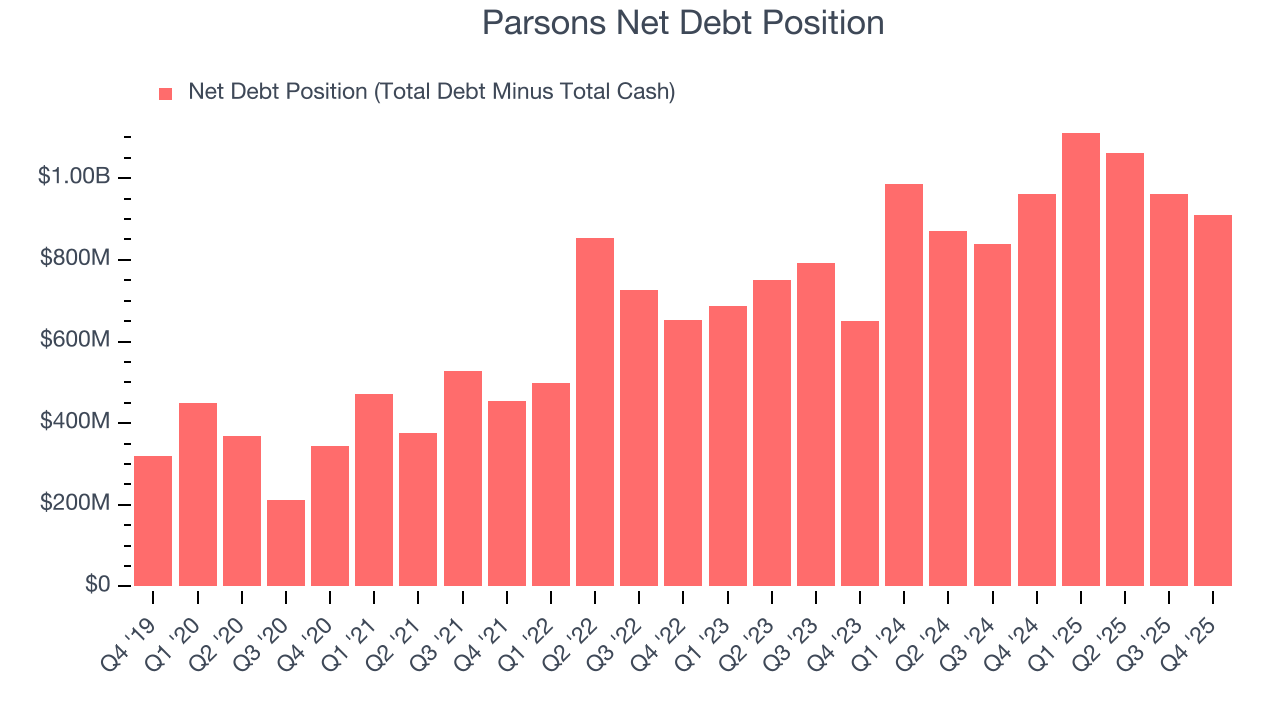
With $609.3 million of EBITDA over the last 12 months, we view Parsons’s 1.5× net-debt-to-EBITDA ratio as safe. We also see its $22.18 million of annual interest expenses as appropriate. The company’s profits give it plenty of breathing room, allowing it to continue investing in growth initiatives.
11. Key Takeaways from Parsons’s Q4 Results
We struggled to find many positives in these results. Its full-year revenue guidance missed and its revenue fell short of Wall Street’s estimates. Overall, this was a softer quarter. The stock traded down 2.4% to $68.54 immediately following the results.
12. Is Now The Time To Buy Parsons?
Updated: March 27, 2026 at 11:19 PM EDT
Before investing in or passing on Parsons, we urge you to understand the company’s business quality (or lack thereof), valuation, and the latest quarterly results - in that order.
Parsons doesn’t top our investment wishlist, but we understand that it’s not a bad business. To kick things off, its revenue growth was solid over the last five years. And while Parsons’s relatively low ROIC suggests management has struggled to find compelling investment opportunities, its expanding operating margin shows the business has become more efficient.
Parsons’s P/E ratio based on the next 12 months is 16.4x. This valuation multiple is fair, but we don’t have much faith in the company. We're pretty confident there are more exciting stocks to buy at the moment.
Wall Street analysts have a consensus one-year price target of $79.91 on the company (compared to the current share price of $52.16).