
P10 (PX)
We’re skeptical of P10. Its low returns on capital raise concerns about its ability to deliver profits, a must for quality companies.― StockStory Analyst Team
1. News


2. Summary
Why We Think P10 Will Underperform
Operating as a bridge between institutional investors and hard-to-access private market opportunities, P10 (NYSE:PX) is an alternative asset management firm that provides access to private equity, venture capital, impact investing, and private credit opportunities in the middle and lower middle markets.
- Low return on equity reflects management’s struggle to allocate funds effectively
- The good news is that its annual revenue growth of 40.9% over the past five years was outstanding, reflecting market share gains this cycle


P10 doesn’t meet our quality criteria. We’re looking for better stocks elsewhere.
Why There Are Better Opportunities Than P10


P10’s stock price of $10.76 implies a valuation ratio of 10.6x forward P/E. P10’s valuation may seem like a bargain, especially when stacked up against other financials companies. We remind you that you often get what you pay for, though.
We’d rather pay up for companies with elite fundamentals than get a bargain on weak ones. Cheap stocks can be value traps, and as their performance deteriorates, they will stay cheap or get even cheaper.
3. P10 (PX) Research Report: Q3 CY2025 Update
Private markets investment firm P10 (NYSE:PX) missed Wall Street’s revenue expectations in Q3 CY2025 as sales rose 2.2% year on year to $75.9 million. Its non-GAAP profit of $0.24 per share was in line with analysts’ consensus estimates.
P10 (PX) Q3 CY2025 Highlights:
Company Overview
Operating as a bridge between institutional investors and hard-to-access private market opportunities, P10 (NYSE:PX) is an alternative asset management firm that provides access to private equity, venture capital, impact investing, and private credit opportunities in the middle and lower middle markets.
P10 focuses on middle and lower-middle market investments, primarily in North America, where it has built extensive networks with fund managers and companies. The firm structures its business around four main solutions: Private Equity, Venture Capital, Impact Investing, and Private Credit, each operating under established brands within their specialized markets.
For institutional clients like pension funds and endowments, P10 offers various investment vehicles including primary investment funds (both commingled and separate accounts), direct investments, co-investments, and secondary market opportunities. This flexibility allows investors to tailor their private market exposure according to their specific needs and objectives.
A university endowment, for example, might engage P10 to access a portfolio of venture capital funds that would be difficult to invest in directly due to high minimum investment requirements or closed status to new investors. Similarly, a pension fund might use P10's services to co-invest alongside experienced private equity managers in middle-market companies.
P10's business model generates revenue primarily through management fees based on committed or invested capital, with typical investment commitments spanning 10-15 years. The company differentiates itself through proprietary databases containing information on thousands of investment firms, funds, and private companies, which it leverages for due diligence and investment selection. This data-driven approach, combined with decades of relationship-building in private markets, forms the foundation of P10's value proposition to investors seeking specialized expertise in alternative investments.
4. Custody Bank
Custody banks safeguard financial assets and provide services like settlement, accounting, and regulatory compliance for institutional investors. Growth opportunities stem from increasing global assets under custody, demand for data analytics, and blockchain technology adoption for settlement efficiency. Challenges include fee pressure from large clients, substantial technology investment requirements, and competition from both traditional players and fintech firms entering the space.
P10 competes with other alternative asset managers and private market solutions providers such as Hamilton Lane (NASDAQ:HLNE), StepStone Group (NASDAQ:STEP), and Blackstone's Strategic Partners (NYSE:BX), as well as with the direct investment platforms of large institutional investors.
5. Revenue Growth
Examining a company’s long-term performance can provide clues about its quality. Any business can experience short-term success, but top-performing ones enjoy sustained growth for years. Over the last five years, P10 grew its revenue at an incredible 38.3% compounded annual growth rate. Its growth beat the average financials company and shows its offerings resonate with customers, a helpful starting point for our analysis.
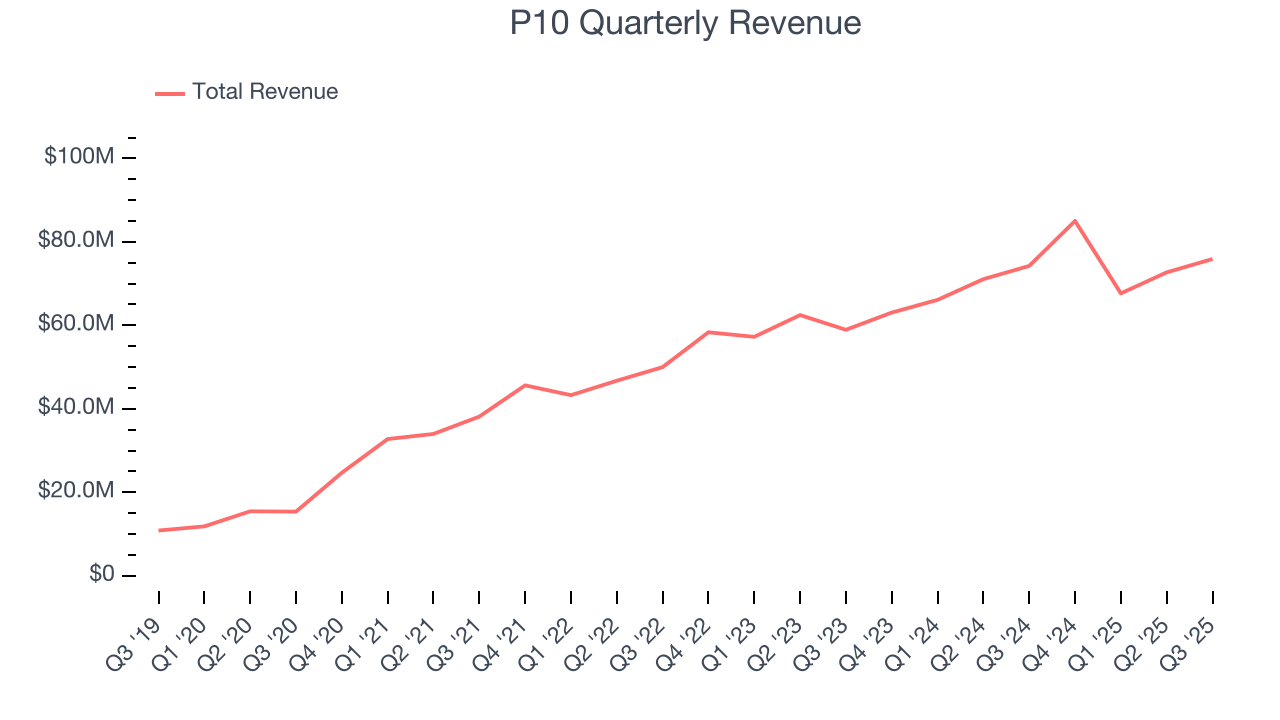
Long-term growth is the most important, but within financials, a half-decade historical view may miss recent interest rate changes and market returns. P10’s annualized revenue growth of 12.7% over the last two years is below its five-year trend, but we still think the results suggest healthy demand. 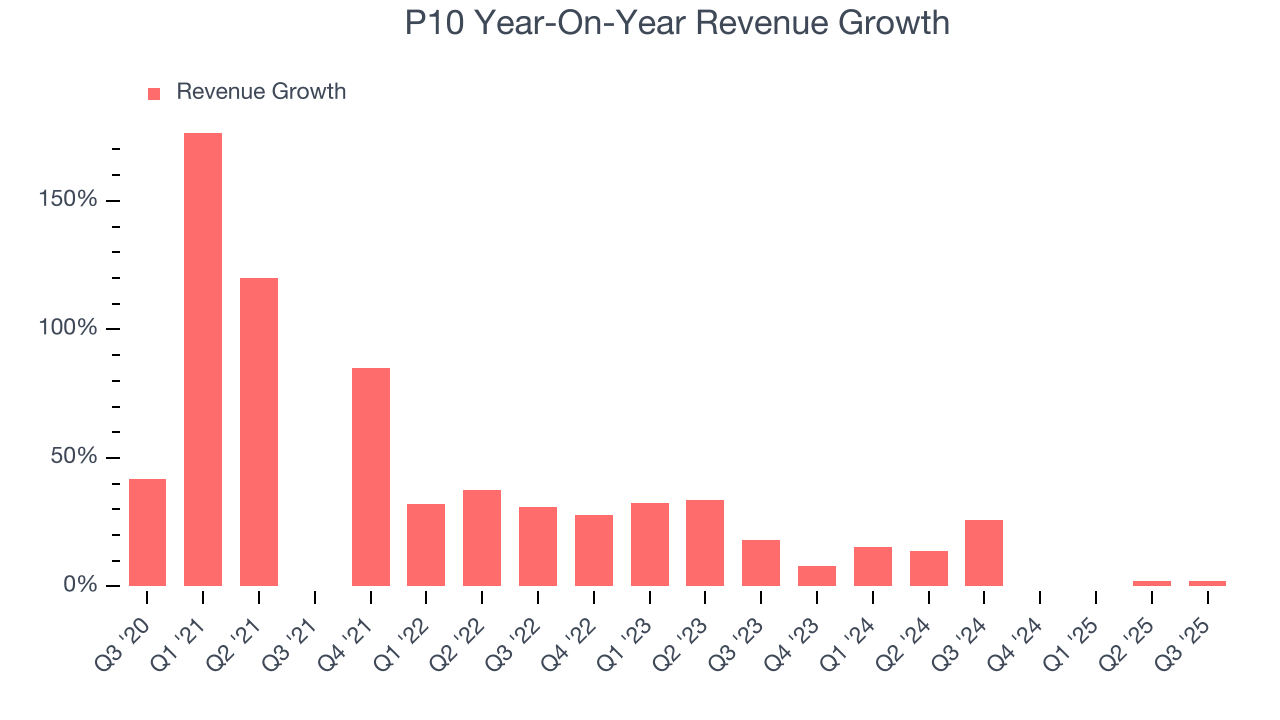 Note: Quarters not shown were determined to be outliers, impacted by outsized investment gains/losses that are not indicative of the recurring fundamentals of the business.
This quarter, P10’s revenue grew by 2.2% year on year to $75.9 million, falling short of Wall Street’s estimates.
6. Assets Under Management (AUM)
Assets Under Management (AUM) is the total capital a firm oversees or manages on behalf of clients. Fees on this AUM, typically a small percentage, are contractually recurring and provide a high level of stability to revenue even if investment performance lags (although too much poor investment performance eventually hurts fundraising ability).
P10’s AUM has grown at an annual rate of 18.3% over the last four years, better than the broader financials industry. When analyzing P10’s AUM over the last two years, we can see that growth decelerated to 12% annually. This performance aligned with its total revenue.
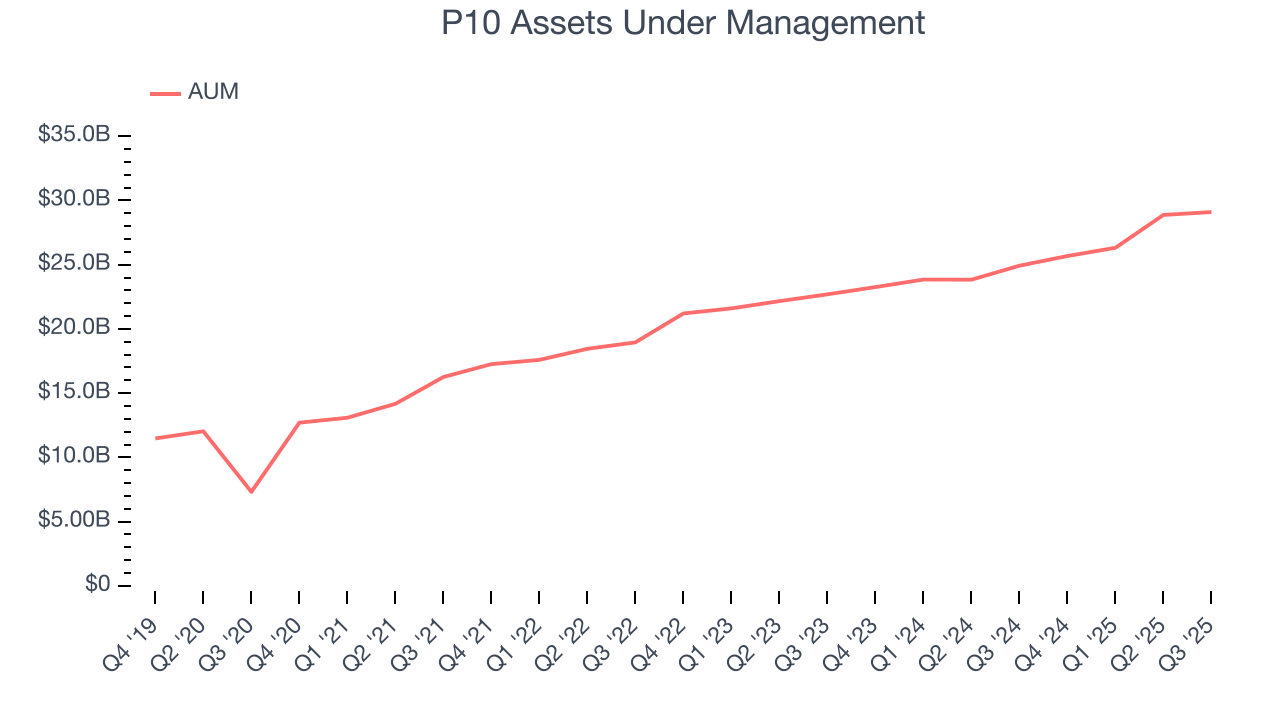
P10’s AUM punched in at $29.1 billion this quarter, falling 1.9% short of analysts’ expectations. This print was 16.8% higher than the same quarter last year.
7. Pre-Tax Profit Margin
Revenue growth is one major determinant of business quality, and the efficiency of operations is another. For Custody Bank companies, we look at pre-tax profit rather than the operating margin that defines sectors such as consumer, tech, and industrials.
Interest income and expenses play a big role in financial institutions' profitability, so they should be factored into the definition of profit. Taxes, however, should not as they are largely out of a company's control. This is pre-tax profit by definition.
Over the last four years, P10’s pre-tax profit margin has fallen by 1.4 percentage points, going from 5.9% to 7.4%. It has also expanded by 7.9 percentage points on a two-year basis, showing its expenses have consistently grown at a slower rate than revenue. This typically signals prudent management.
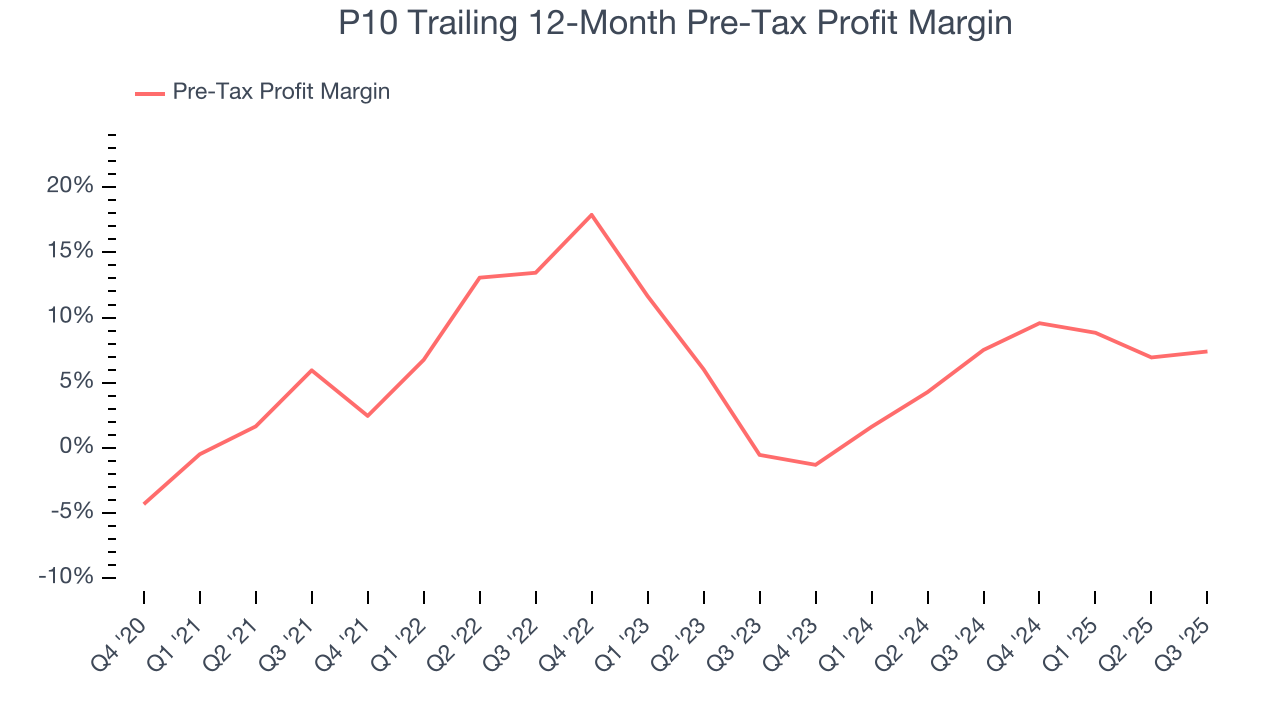
P10’s pre-tax profit margin came in at 5.4% this quarter. This result was 1.9 percentage points better than the same quarter last year.
8. Earnings Per Share
Revenue trends explain a company’s historical growth, but the change in earnings per share (EPS) points to the profitability of that growth – for example, a company could inflate its sales through excessive spending on advertising and promotions.
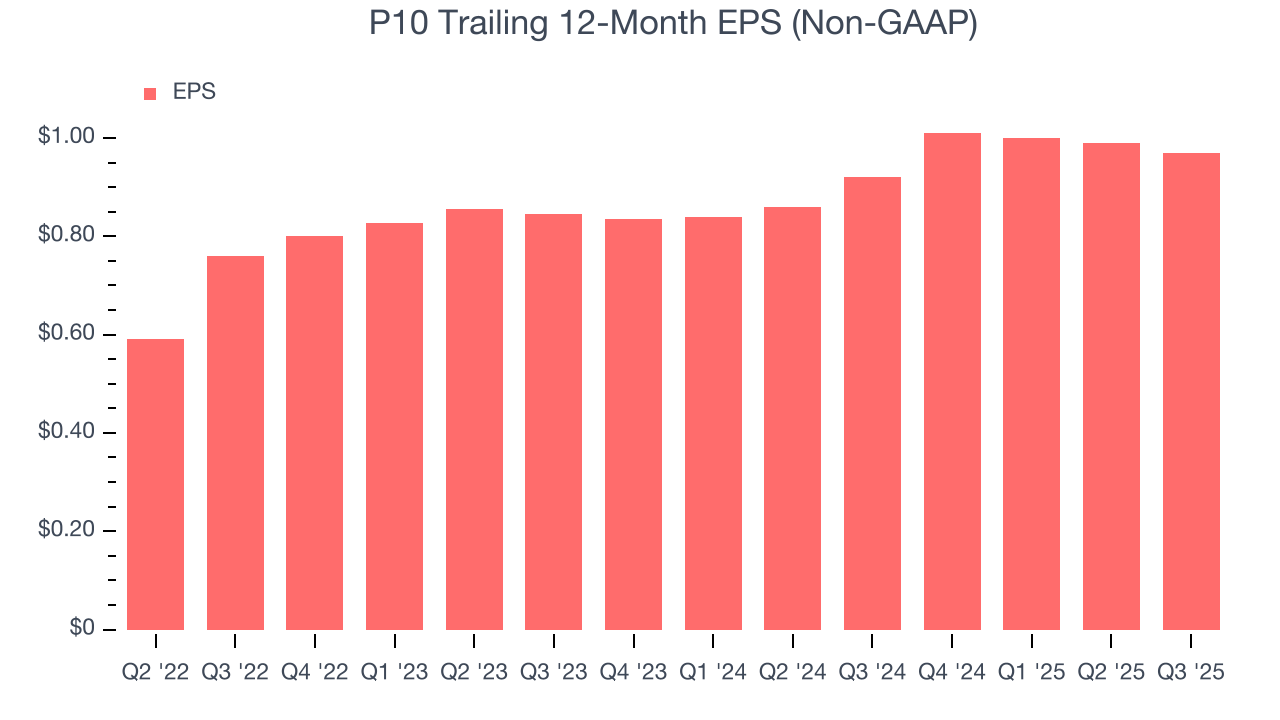
P10’s EPS grew at an unimpressive 7.1% compounded annual growth rate over the last two years, lower than its 12.7% annualized revenue growth. However, its operating margin actually improved during this time, telling us that non-fundamental factors such as interest and taxes affected its ultimate earnings.
Diving into the nuances of P10’s earnings can give us a better understanding of its performance. A two-year view shows P10 has diluted its shareholders, growing its share count by 1.3%. This dilution overshadowed its increased operational efficiency and has led to lower per share earnings. 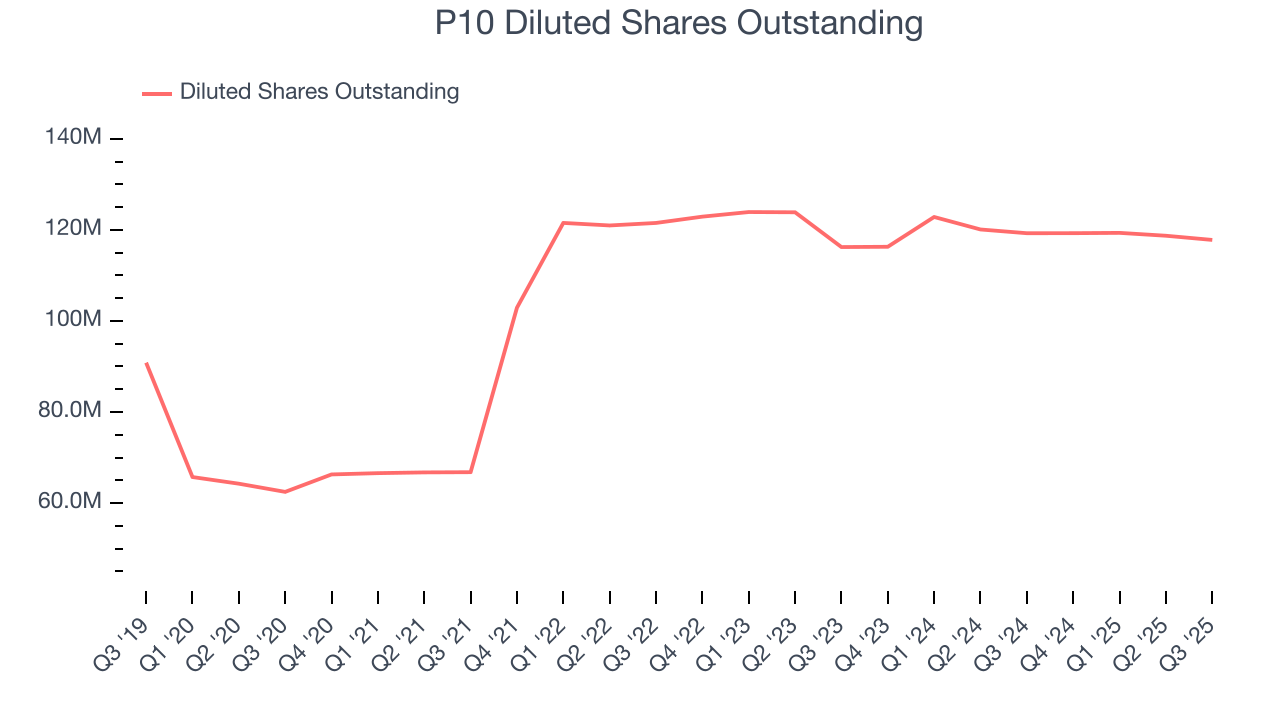
In Q3, P10 reported adjusted EPS of $0.24, down from $0.26 in the same quarter last year. Despite falling year on year, this print beat analysts’ estimates by 3.6%. Over the next 12 months, Wall Street expects P10’s full-year EPS of $0.97 to grow 8.4%.
9. Return on Equity
Return on equity, or ROE, quantifies bank profitability relative to shareholder equity - an essential capital source for these institutions. Over extended periods, superior ROE performance drives faster shareholder wealth compounding through reinvestment, share repurchases, and dividend growth.
Over the last five years, P10 has averaged an ROE of 5.9%, uninspiring for a company operating in a sector where the average shakes out around 10%. We’re optimistic P10 can turn the ship around given its success in other measures of financial health.
10. Balance Sheet Assessment
The debt-to-equity ratio is a widely used measure to assess a company's balance sheet health. A higher ratio means that a business aggressively financed its growth with debt. This can result in higher earnings (if the borrowed funds are invested profitably) but also increases risk.
If debt levels are too high, there could be difficulties in meeting obligations, especially during economic downturns or periods of rising interest rates if the debt has variable-rate payments.
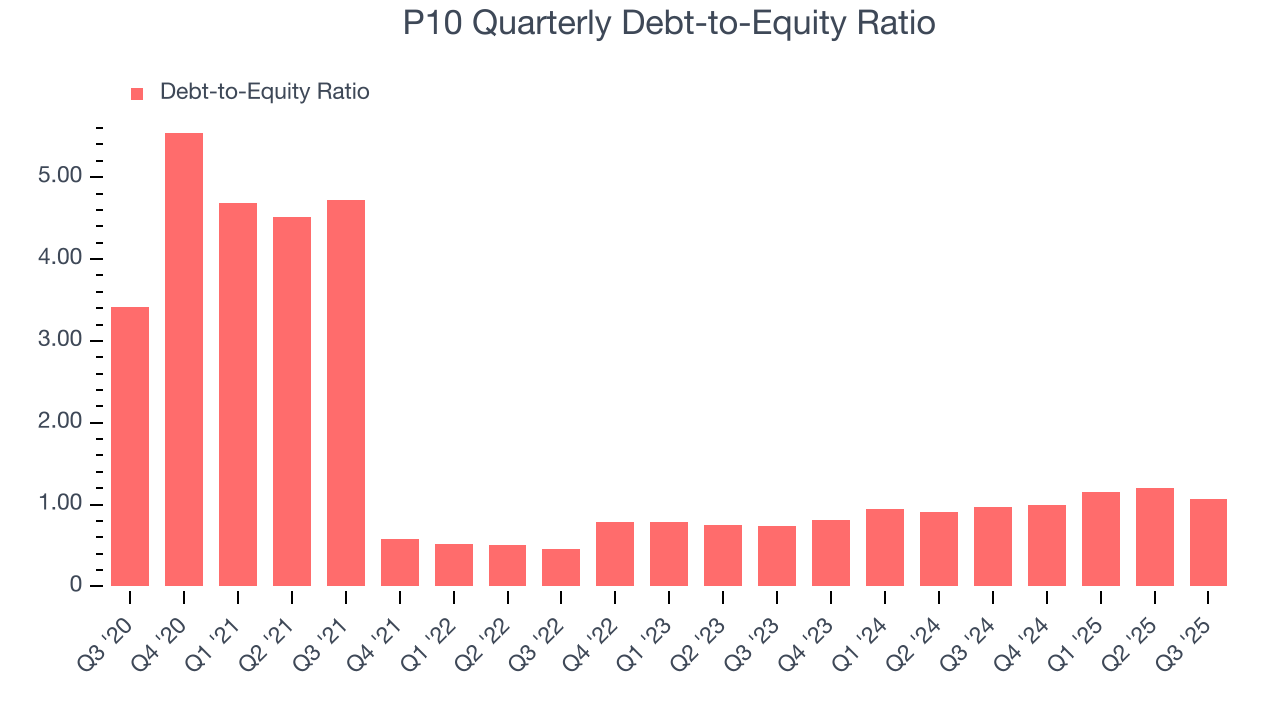
P10 currently has $424.1 million of debt and $396.8 million of shareholder's equity on its balance sheet, and over the past four quarters, has averaged a debt-to-equity ratio of 1.1×. We think this is safe and raises no red flags. In general, we’re comfortable with any ratio below 3.5× for a financials business.
11. Key Takeaways from P10’s Q3 Results
It was encouraging to see P10 meet analysts’ EPS expectations this quarter. On the other hand, its AUM missed and its revenue fell short of Wall Street’s estimates. Overall, this was a weaker quarter. The stock traded up 2% to $10.79 immediately after reporting.
12. Is Now The Time To Buy P10?
Updated: January 24, 2026 at 10:59 PM EST
A common mistake we notice when investors are deciding whether to buy a stock or not is that they simply look at the latest earnings results. Business quality and valuation matter more, so we urge you to understand these dynamics as well.
P10 isn’t a terrible business, but it doesn’t pass our quality test. Although its revenue growth was exceptional over the last five years, it’s expected to deteriorate over the next 12 months and its relatively low ROE suggests management has struggled to find compelling investment opportunities.
P10’s P/E ratio based on the next 12 months is 10.6x. While this valuation is reasonable, we don’t really see a big opportunity at the moment. We're pretty confident there are more exciting stocks to buy at the moment.
Wall Street analysts have a consensus one-year price target of $16.63 on the company (compared to the current share price of $10.76).
Although the price target is bullish, readers should exercise caution because analysts tend to be overly optimistic. The firms they work for, often big banks, have relationships with companies that extend into fundraising, M&A advisory, and other rewarding business lines. As a result, they typically hesitate to say bad things for fear they will lose out. We at StockStory do not suffer from such conflicts of interest, so we’ll always tell it like it is.