
Q2 Holdings (QTWO)
Q2 Holdings doesn’t excite us. Its weak revenue growth and gross margin show it not only lacks demand but also decent unit economics.― StockStory Analyst Team
1. News


2. Summary
Why Q2 Holdings Is Not Exciting
With a platform powering digital services for approximately 25 million account holders across America, Q2 Holdings (NYSE:QTWO) provides cloud-based digital solutions that help financial institutions, fintechs, and alternative finance companies deliver modern banking experiences to their customers.
- Bad unit economics and steep infrastructure costs are reflected in its gross margin of 54.1%, one of the worst among software companies
- Estimated sales growth of 9.9% for the next 12 months implies demand will slow from its two-year trend
- A bright spot is that its user-friendly software enables clients to ramp up spending quickly, leading to the speedy recovery of customer acquisition costs


Q2 Holdings doesn’t satisfy our quality benchmarks. We’d search for superior opportunities elsewhere.
Why There Are Better Opportunities Than Q2 Holdings


Q2 Holdings’s stock price of $53.70 implies a valuation ratio of 4.5x forward price-to-sales. This sure is a cheap multiple, but you get what you pay for.
Cheap stocks can look like great bargains at first glance, but you often get what you pay for. These mediocre businesses often have less earnings power, meaning there is more reliance on a re-rating to generate good returns - an unlikely scenario for low-quality companies.
3. Q2 Holdings (QTWO) Research Report: Q4 CY2025 Update
Digital banking software provider Q2 Holdings (NYSE:QTWO) reported Q4 CY2025 results beating Wall Street’s revenue expectations, with sales up 13.8% year on year to $208.2 million. Guidance for next quarter’s revenue was optimistic at $214.5 million at the midpoint, 2.5% above analysts’ estimates. Its GAAP profit of $0.31 per share was 33.3% above analysts’ consensus estimates.
Q2 Holdings (QTWO) Q4 CY2025 Highlights:
- Revenue: $208.2 million vs analyst estimates of $205 million (13.8% year-on-year growth, 1.5% beat)
- EPS (GAAP): $0.31 vs analyst estimates of $0.23 (33.3% beat)
- Adjusted Operating Income: $43.22 million vs analyst estimates of $40.63 million (20.8% margin, 6.4% beat)
- Revenue Guidance for Q1 CY2026 is $214.5 million at the midpoint, above analyst estimates of $209.3 million
- EBITDA guidance for the upcoming financial year 2026 is $227.5 million at the midpoint, in line with analyst expectations
- Operating Margin: 8.1%, up from -0.9% in the same quarter last year
- Free Cash Flow Margin: 27.2%, up from 18.5% in the previous quarter
- Market Capitalization: $3.58 billion
Company Overview
With a platform powering digital services for approximately 25 million account holders across America, Q2 Holdings (NYSE:QTWO) provides cloud-based digital solutions that help financial institutions, fintechs, and alternative finance companies deliver modern banking experiences to their customers.
Q2's comprehensive suite of solutions includes its flagship digital banking platform, which enables retail, small business, and commercial banking functionalities across all digital channels. The company's open architecture approach allows financial institutions to integrate their internal systems with third-party applications, creating unified financial experiences for end users. This flexibility helps banks and credit unions differentiate their digital brands while meeting regulatory requirements.
Beyond its core banking platform, Q2 offers specialized solutions like Helix, a cloud-native core processing platform that provides Banking-as-a-Service capabilities. This allows fintech companies to incorporate banking services into their offerings without having to independently navigate complex regulatory requirements. The company's Innovation Studio further extends its value by enabling financial institutions and partners to develop customized extensions and integrations through APIs and software development kits.
Q2 generates revenue primarily through subscription-based pricing models, with revenues growing as customers adopt more solutions and increase their end-user base. For example, a credit union might initially implement Q2's digital banking platform for basic online services, then gradually add fraud detection, lending capabilities, and relationship pricing tools as their digital strategy evolves. The company's focus on security and compliance is embedded throughout its solutions, designed to meet the stringent requirements of the financial services industry.
4. Banking Software
Consumers these days are accustomed to frictionless digital experiences from online shopping to ordering food or hailing a cab. Financial services firms are notoriously risk averse in adopting modern software, often lacking the resources or competency to develop the digital solutions in-house. That drives demand for software as a service platforms that allows banks and other finance institutions to offer the digital services without having to run or maintain them.
Q2 Holdings competes with digital banking specialists like Alkami Technology and Apiture, as well as core processing vendors including Fiserv, Jack Henry & Associates, and FIS. In the Banking-as-a-Service space, Q2's Helix platform faces competition from Galileo Financial Technologies (owned by SoFi), Marqeta (NYSE:MQ), and Green Dot (NYSE:GDOT).
5. Revenue Growth
A company’s long-term sales performance is one signal of its overall quality. Even a bad business can shine for one or two quarters, but a top-tier one grows for years. Over the last five years, Q2 Holdings grew its sales at a 14.3% annual rate. Though this growth is acceptable on an absolute basis, we need to see more than just topline growth for the software sector, which can display significant earnings volatility. This means our bar for the sector is particularly high, reflecting the non-essential and hit-driven nature of the products and services offered. Additionally, five-year CAGR starts around Covid, when revenue was depressed then rebounded.
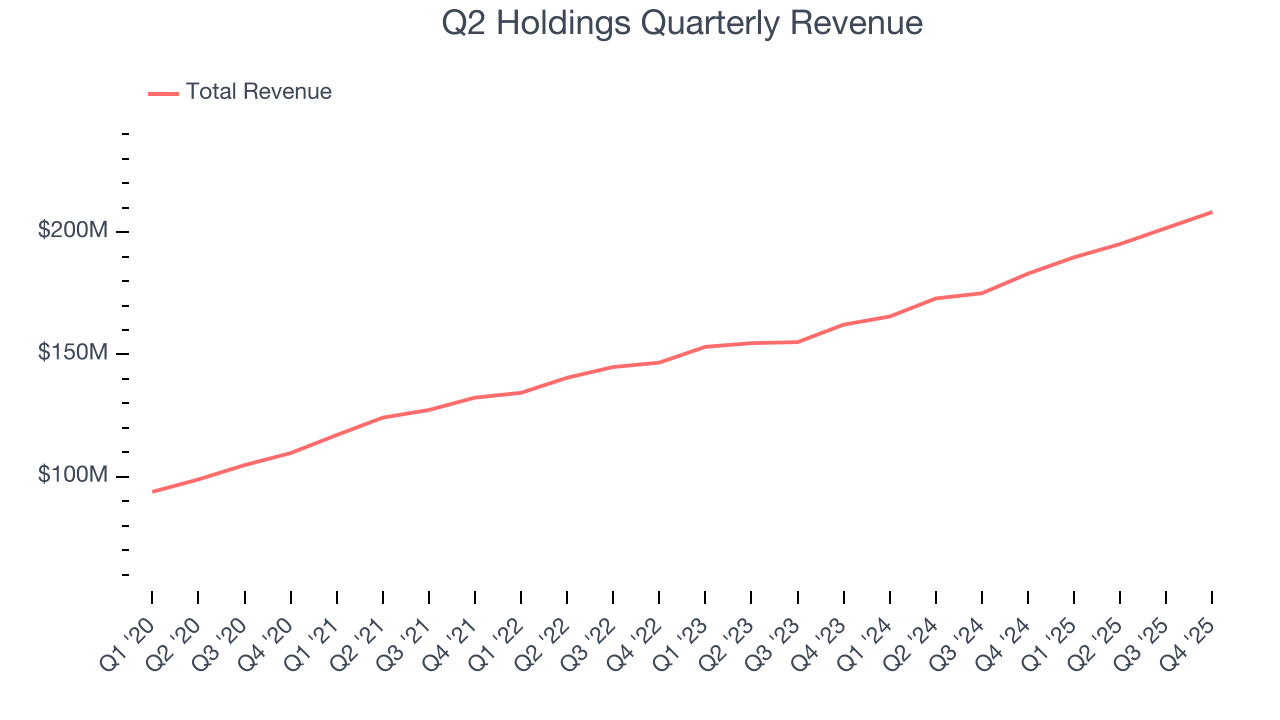
We at StockStory place the most emphasis on long-term growth, but within software, a half-decade historical view may miss recent innovations or disruptive industry trends. Q2 Holdings’s recent performance shows its demand has slowed as its annualized revenue growth of 12.8% over the last two years was below its five-year trend. We’re wary when companies in the sector see decelerations in revenue growth, as it could signal changing consumer tastes aided by low switching costs. 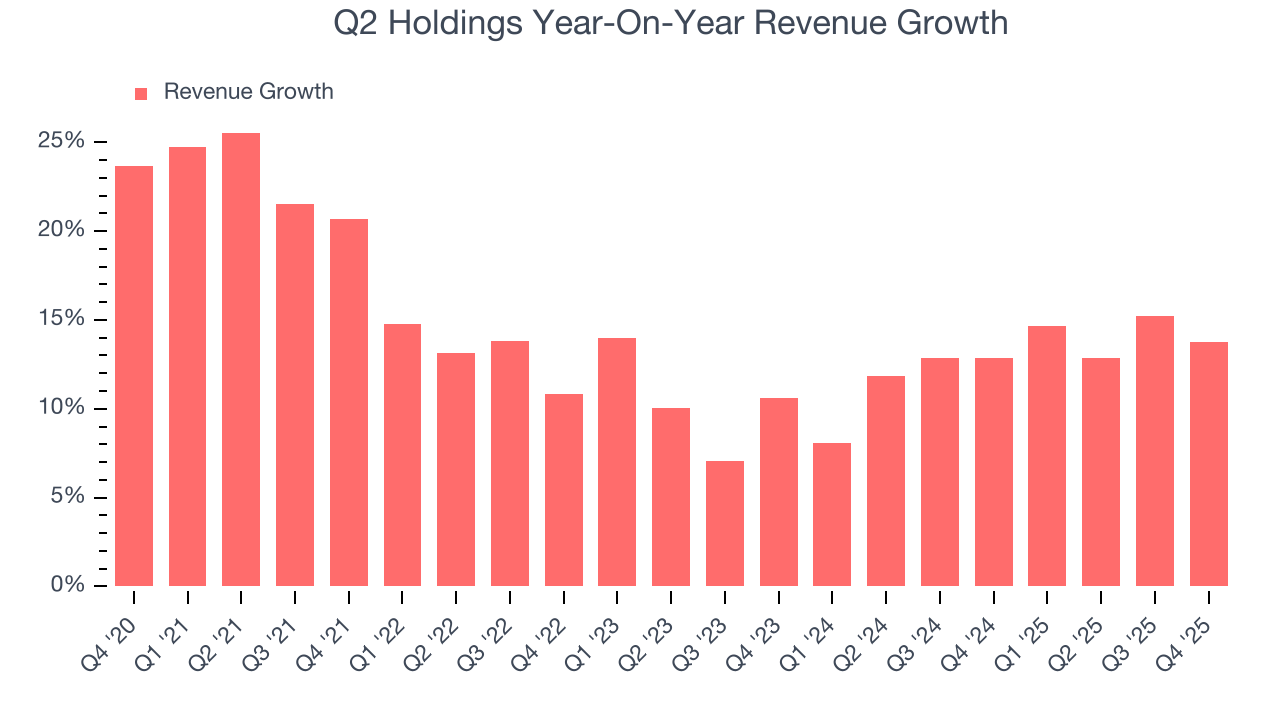
This quarter, Q2 Holdings reported year-on-year revenue growth of 13.8%, and its $208.2 million of revenue exceeded Wall Street’s estimates by 1.5%. Company management is currently guiding for a 13.1% year-on-year increase in sales next quarter.
Looking further ahead, sell-side analysts expect revenue to grow 9.9% over the next 12 months, a slight deceleration versus the last two years. This projection doesn't excite us and indicates its products and services will see some demand headwinds.
6. Customer Acquisition Efficiency
The customer acquisition cost (CAC) payback period represents the months required to recover the cost of acquiring a new customer. Essentially, it’s the break-even point for sales and marketing investments. A shorter CAC payback period is ideal, as it implies better returns on investment and business scalability.
Q2 Holdings is very efficient at acquiring new customers, and its CAC payback period checked in at 23.8 months this quarter. The company’s rapid recovery of its customer acquisition costs means it can attempt to spur growth by increasing its sales and marketing investments.
7. Gross Margin & Pricing Power
For software companies like Q2 Holdings, gross profit tells us how much money remains after paying for the base cost of products and services (typically servers, licenses, and certain personnel). These costs are usually low as a percentage of revenue, explaining why software is more lucrative than other sectors.
Q2 Holdings’s gross margin is substantially worse than most software businesses, signaling it has relatively high infrastructure costs compared to asset-lite businesses like ServiceNow. As you can see below, it averaged a 54.1% gross margin over the last year. That means Q2 Holdings paid its providers a lot of money ($45.94 for every $100 in revenue) to run its business.
The market not only cares about gross margin levels but also how they change over time because expansion creates firepower for profitability and free cash generation. Q2 Holdings has seen gross margins improve by 5.6 percentage points over the last 2 year, which is elite in the software space.
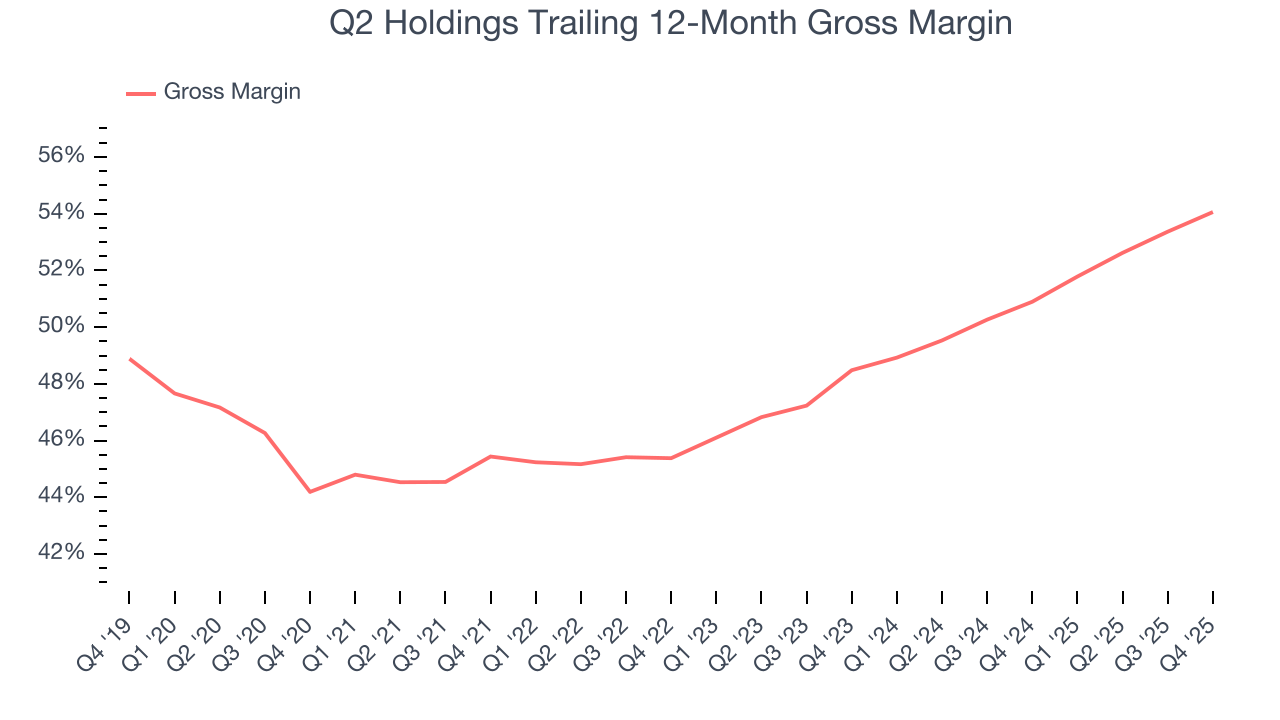
Q2 Holdings’s gross profit margin came in at 55.4% this quarter, up 2.7 percentage points year on year. Q2 Holdings’s full-year margin has also been trending up over the past 12 months, increasing by 3.2 percentage points. If this move continues, it could suggest better unit economics due to more leverage from its growing sales on the fixed portion of its cost of goods sold (such as servers).
8. Operating Margin
Q2 Holdings has managed its cost base well over the last year. It demonstrated solid profitability for a software business, producing an average operating margin of 5%. This result was particularly impressive because of its low gross margin, which is mostly a factor of what it sells and takes huge shifts to move meaningfully. Companies have more control over their operating margins, and it’s a show of well-managed operations if they’re high when gross margins are low.
Looking at the trend in its profitability, Q2 Holdings’s operating margin rose by 11.1 percentage points over the last two years, as its sales growth gave it operating leverage.
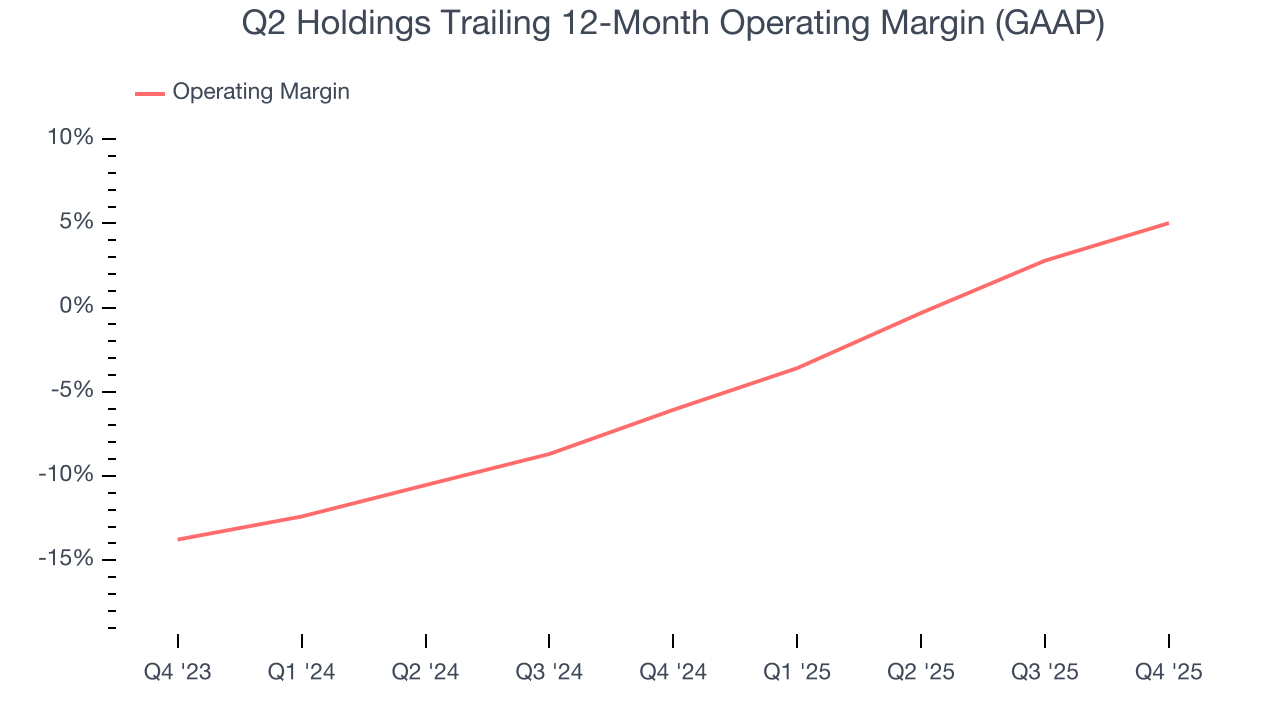
In Q4, Q2 Holdings generated an operating margin profit margin of 8.1%, up 9 percentage points year on year. The increase was solid, and because its operating margin rose more than its gross margin, we can infer it was more efficient with expenses such as marketing, R&D, and administrative overhead.
9. Cash Is King
Free cash flow isn't a prominently featured metric in company financials and earnings releases, but we think it's telling because it accounts for all operating and capital expenses, making it tough to manipulate. Cash is king.
Q2 Holdings has shown impressive cash profitability, driven by its cost-effective customer acquisition strategy that gives it the option to invest in new products and services rather than sales and marketing. The company’s free cash flow margin averaged 21.8% over the last year, better than the broader software sector.
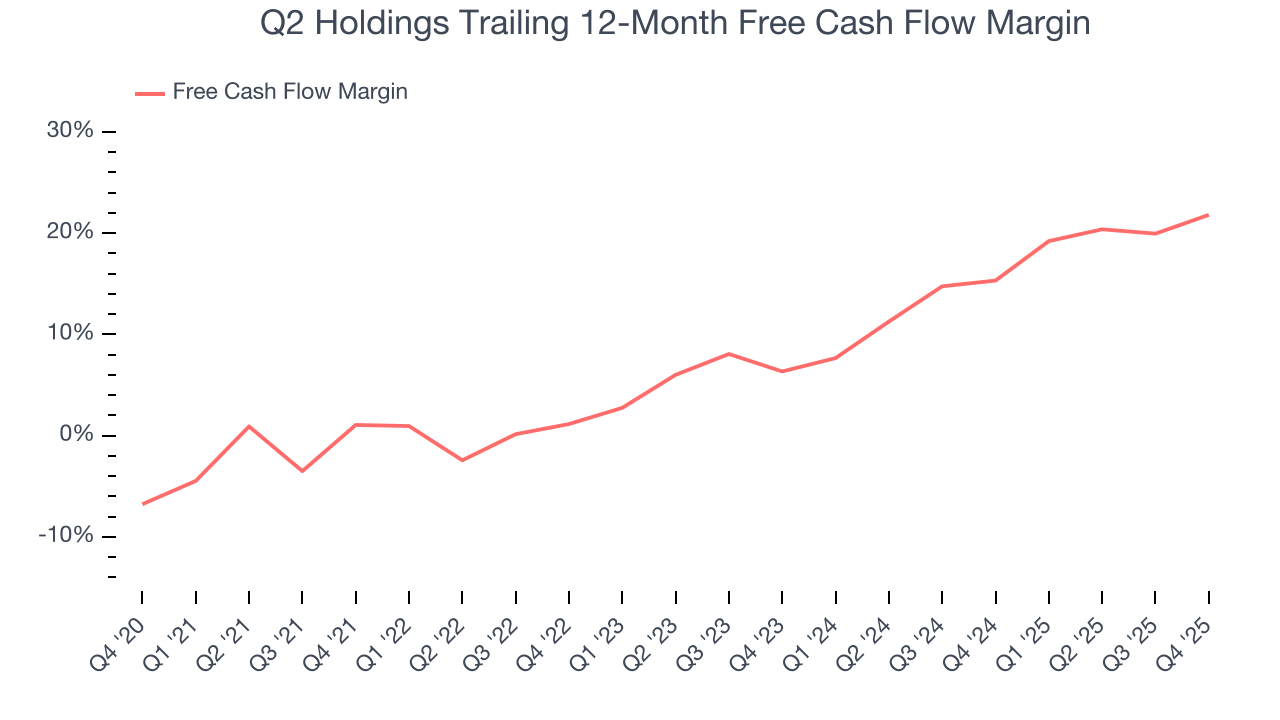
Q2 Holdings’s free cash flow clocked in at $56.59 million in Q4, equivalent to a 27.2% margin. This result was good as its margin was 7 percentage points higher than in the same quarter last year, but we wouldn’t read too much into the short term because investment needs can be seasonal, causing temporary swings. Long-term trends carry greater meaning.
Over the next year, analysts predict Q2 Holdings’s cash conversion will slightly improve. Their consensus estimates imply its free cash flow margin of 21.8% for the last 12 months will increase to 25.4%, giving it more flexibility for investments, share buybacks, and dividends.
10. Balance Sheet Assessment
One of the best ways to mitigate bankruptcy risk is to hold more cash than debt.
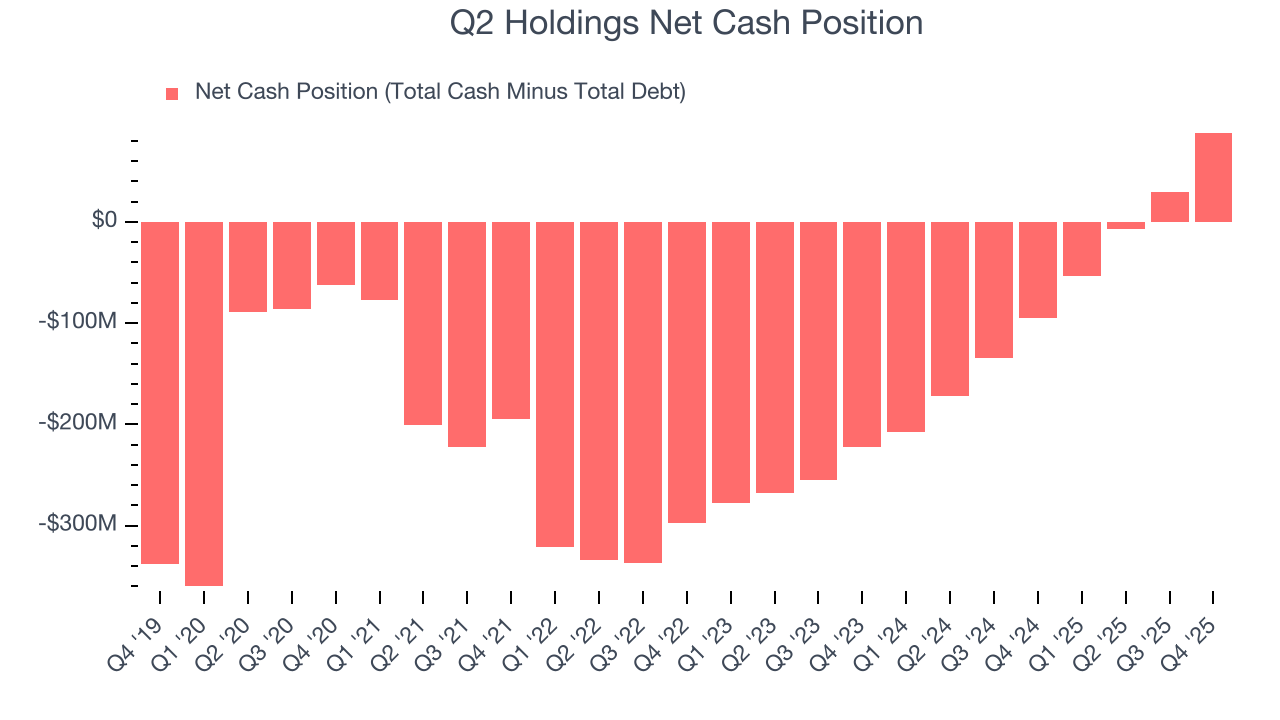
Q2 Holdings is a profitable, well-capitalized company with $434.4 million of cash and $346.1 million of debt on its balance sheet. This $88.25 million net cash position is 2.5% of its market cap and gives it the freedom to borrow money, return capital to shareholders, or invest in growth initiatives. Leverage is not an issue here.
11. Key Takeaways from Q2 Holdings’s Q4 Results
We were impressed by Q2 Holdings’s optimistic EBITDA guidance for next quarter, which blew past analysts’ expectations. We were also glad its EBITDA outperformed Wall Street’s estimates. On the other hand, its revenue guidance for next year suggests a significant slowdown in demand. Investors were likely hoping for more, and shares traded down 5.5% to $53.50 immediately following the results.
12. Is Now The Time To Buy Q2 Holdings?
Updated: February 11, 2026 at 9:27 PM EST
Before making an investment decision, investors should account for Q2 Holdings’s business fundamentals and valuation in addition to what happened in the latest quarter.
Q2 Holdings’s business quality ultimately falls short of our standards. To kick things off, its revenue growth was a little slower over the last five years, and analysts expect its demand to deteriorate over the next 12 months. While its efficient sales strategy allows it to target and onboard new users at scale, the downside is its gross margins show its business model is much less lucrative than other companies. On top of that, its ARR has disappointed and shows the company is having difficulty retaining customers and their spending.
Q2 Holdings’s price-to-sales ratio based on the next 12 months is 4.5x. While this valuation is reasonable, we don’t really see a big opportunity at the moment. We're pretty confident there are more exciting stocks to buy at the moment.
Wall Street analysts have a consensus one-year price target of $89.29 on the company (compared to the current share price of $53.70).
Although the price target is bullish, readers should exercise caution because analysts tend to be overly optimistic. The firms they work for, often big banks, have relationships with companies that extend into fundraising, M&A advisory, and other rewarding business lines. As a result, they typically hesitate to say bad things for fear they will lose out. We at StockStory do not suffer from such conflicts of interest, so we’ll always tell it like it is.