Reinsurance Group of America (RGA)
Reinsurance Group of America doesn’t excite us. Its underwhelming returns on capital show it struggled to generate meaningful profits for shareholders.― StockStory Analyst Team
1. News

2. Summary
Why We Think Reinsurance Group of America Will Underperform
Operating behind the scenes of the insurance industry since 1973, Reinsurance Group of America (NYSE:RGA) provides life and health reinsurance services to insurance companies, helping them manage risk and meet regulatory requirements.
- Projected book value per share decline of 10% for the next 12 months points to tough credit quality challenges ahead
- Book value per share stagnated over the last five years, limiting its ability to leverage its balance sheet to make additional investments
- A bright spot is that its revenue outlook for the upcoming 12 months is outstanding and shows it’s on track to gain market share


Reinsurance Group of America is skating on thin ice. There are superior stocks for sale in the market.
Why There Are Better Opportunities Than Reinsurance Group of America


At $205.11 per share, Reinsurance Group of America trades at 1x forward P/B. This multiple is lower than most insurance companies, but for good reason.
Our advice is to pay up for elite businesses whose advantages are tailwinds to earnings growth. Don’t get sucked into lower-quality businesses just because they seem like bargains. These mediocre businesses often never achieve a higher multiple as hoped, a phenomenon known as a “value trap”.
3. Reinsurance Group of America (RGA) Research Report: Q4 CY2025 Update
Global life reinsurance provider Reinsurance Group of America (NYSE:RGA) beat Wall Street’s revenue expectations in Q4 CY2025, with sales up 20.9% year on year to $6.64 billion. Its non-GAAP profit of $7.75 per share was 34.8% above analysts’ consensus estimates.
Reinsurance Group of America (RGA) Q4 CY2025 Highlights:
- Net Premiums Earned: $4.78 billion vs analyst estimates of $4.43 billion (15% year-on-year growth, 8% beat)
- Revenue: $6.64 billion vs analyst estimates of $6.35 billion (20.9% year-on-year growth, 4.4% beat)
- Pre-tax Profit: $510 million (7.7% margin)
- Adjusted EPS: $7.75 vs analyst estimates of $5.75 (34.8% beat)
- Book Value per Share: $205.63 vs analyst estimates of $163.27 (25.2% year-on-year growth, 25.9% beat)
- Market Capitalization: $13.48 billion
Company Overview
Operating behind the scenes of the insurance industry since 1973, Reinsurance Group of America (NYSE:RGA) provides life and health reinsurance services to insurance companies, helping them manage risk and meet regulatory requirements.
RGA operates as a middleman in the insurance industry, assuming portions of risk from primary insurers through various reinsurance arrangements. The company specializes in traditional life and health reinsurance, where it takes on mortality and morbidity risks, as well as financial solutions that help insurers manage their capital and investment risks.
RGA's traditional reinsurance covers a wide range of products including term life, whole life, universal life, group life, disability, long-term care, and critical illness insurance. For example, when a life insurance company issues a $1 million policy to a customer with complex health conditions, it might reinsure a portion with RGA to reduce its exposure.
The company's financial solutions business includes asset-intensive reinsurance, where RGA assumes investment risks associated with annuities and other investment-oriented products. It also provides longevity reinsurance, protecting pension providers against the risk of retirees living longer than expected, and capital solutions that help insurers meet regulatory requirements.
RGA generates revenue primarily through reinsurance premiums and investment income. Its clients are insurance companies rather than individual consumers, with the company serving most major life insurers globally. The business is organized into geographic segments covering the U.S. and Latin America, Canada, Europe, Middle East and Africa (EMEA), and Asia Pacific, allowing RGA to tailor its offerings to regional market needs and regulations.
The company employs specialized underwriters, actuaries, and investment professionals who assess risks, price contracts, and manage the complex financial aspects of the reinsurance business.
4. Reinsurance
This is a cyclical industry, and the sector benefits when there is 'hard market', characterized by strong premium rate increases that outpace loss and cost inflation, resulting in robust underwriting margins. The opposite is true in a 'soft market'. Interest rates also matter, as they determine the yields earned on fixed-income portfolios. The primary headwind remains the immense and concentrated exposure to large-scale catastrophe losses, as the growing impact of climate change challenges traditional risk models and creates significant earnings volatility. Additionally, they face the risk of adverse prior-year reserve development, where claims prove more costly than anticipated, while the eventual influx of new capital from alternative sources threatens to soften the market and compress future returns.
RGA's main competitors include other global reinsurance providers such as Swiss Re (SWX:SREN), Munich Re (ETR:MUV2), SCOR (EPA:SCR), and Hannover Re (ETR:HNR1), as well as life insurance companies that offer reinsurance services like MetLife (NYSE:MET) and Prudential Financial (NYSE:PRU).
5. Revenue Growth
Insurance companies earn revenue from three primary sources: 1) The core insurance business itself, often called underwriting and represented in the income statement as premiums 2) Income from investing the “float” (premiums collected upfront not yet paid out as claims) in assets such as fixed-income assets and equities 3) Fees from various sources such as policy administration, annuities, or other value-added services. Thankfully, Reinsurance Group of America’s 10.3% annualized revenue growth over the last five years was solid. Its growth beat the average insurance company and shows its offerings resonate with customers.
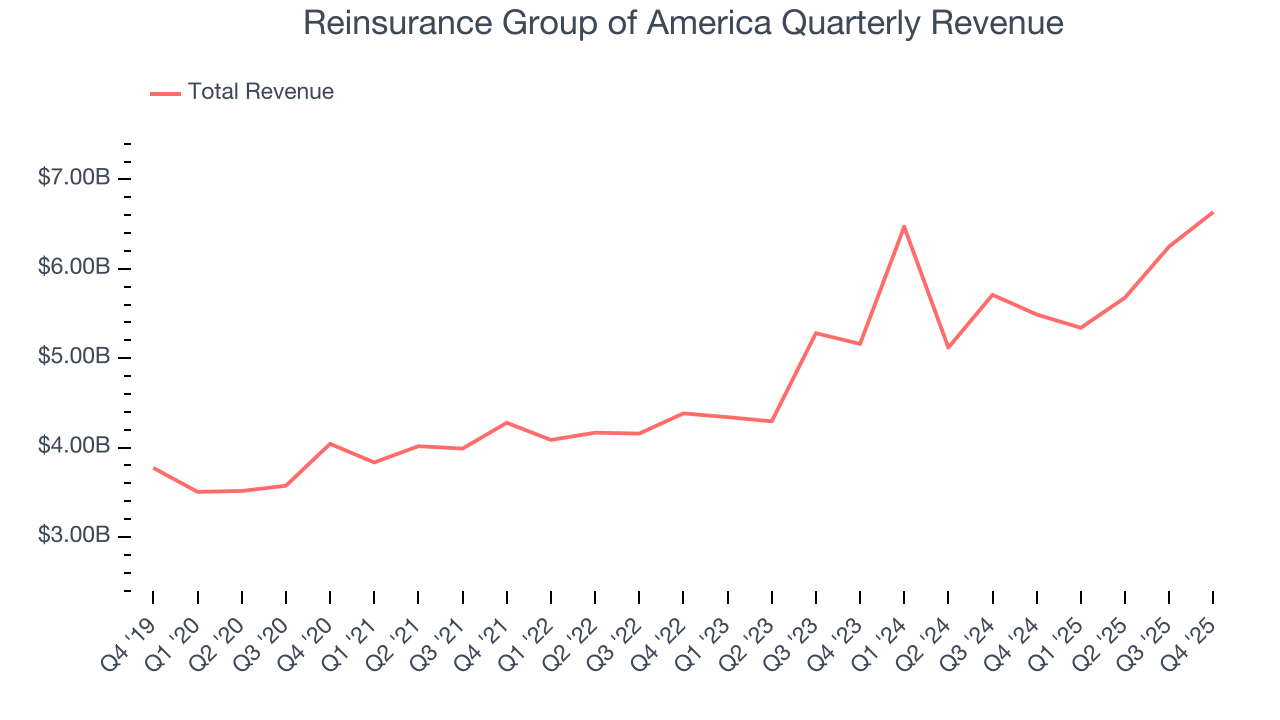
Long-term growth is the most important, but within financials, a half-decade historical view may miss recent interest rate changes and market returns. Reinsurance Group of America’s annualized revenue growth of 11.9% over the last two years is above its five-year trend, suggesting its demand was strong and recently accelerated. 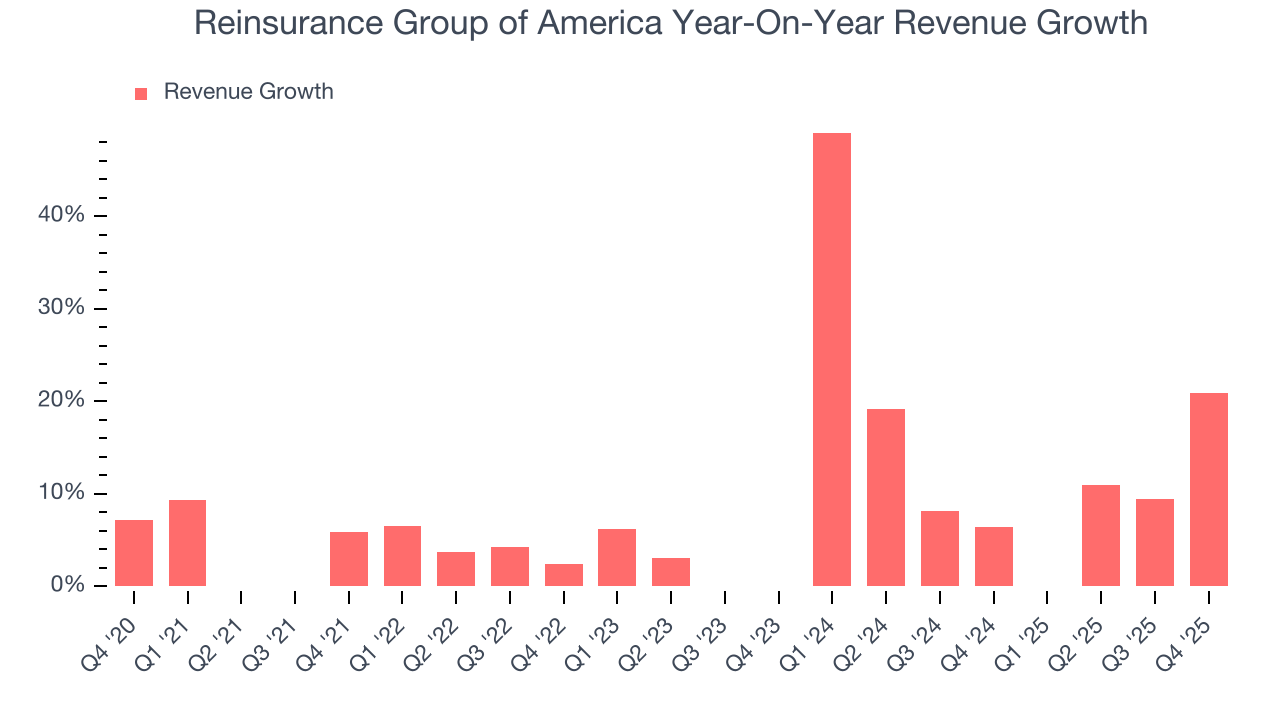 Note: Quarters not shown were determined to be outliers, impacted by outsized investment gains/losses that are not indicative of the recurring fundamentals of the business.
This quarter, Reinsurance Group of America reported robust year-on-year revenue growth of 20.9%, and its $6.64 billion of revenue topped Wall Street estimates by 4.4%.
Net premiums earned made up 76.8% of the company’s total revenue during the last five years, meaning insurance operations are Reinsurance Group of America’s largest source of revenue.
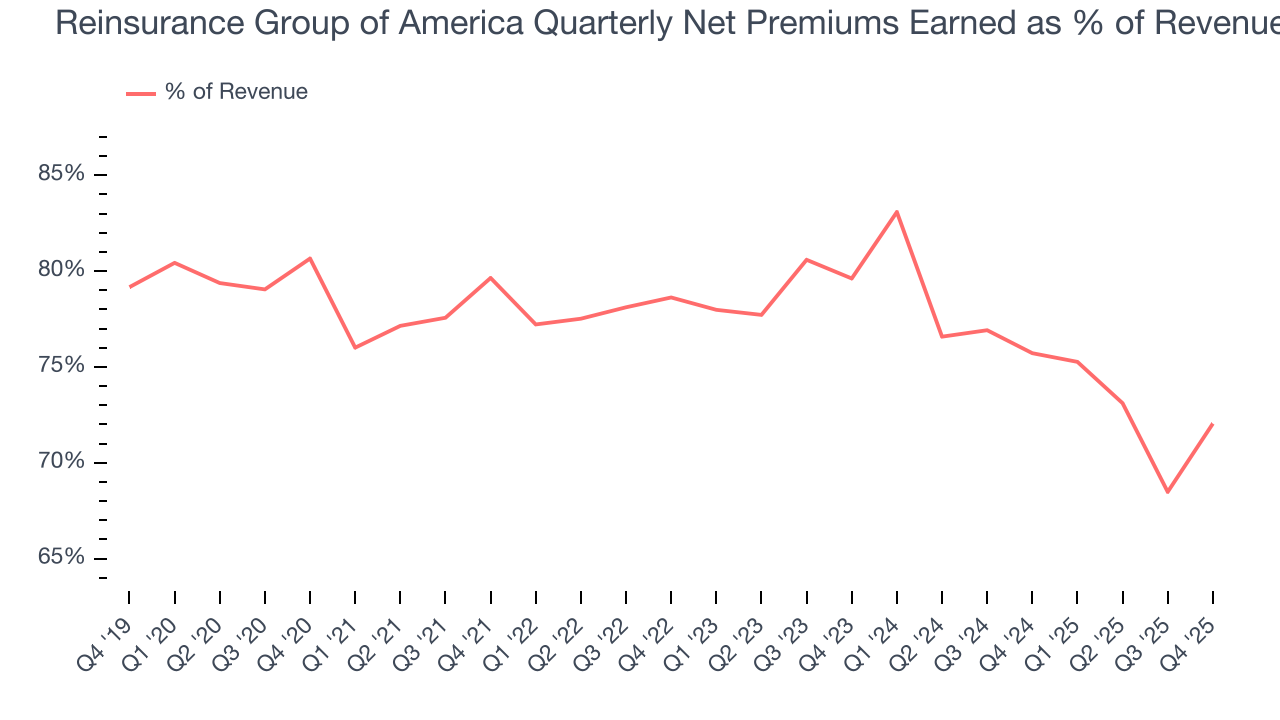
While insurers generate revenue from multiple sources, investors view net premiums earned as the cornerstone - its direct link to core operations stands in sharp contrast to the unpredictability of investment returns and fees.
6. Net Premiums Earned
When insurers sell policies, they protect themselves from extremely large losses or an outsized accumulation of losses with reinsurance (insurance for insurance companies). Net premiums earned are therefore gross premiums less what’s ceded to reinsurers as a risk mitigation and transfer strategy.
Reinsurance Group of America’s net premiums earned has grown at a 8.1% annualized rate over the last five years, slightly better than the broader insurance industry but slower than its total revenue.
When analyzing Reinsurance Group of America’s net premiums earned over the last two years, we can see that growth decelerated to 6.9% annually. Since two-year net premiums earned grew slower than total revenue over this period, it’s implied that other line items such as investment income grew at a faster rate. These extra revenue streams are important to the bottom line, yet their performance can be inconsistent. Some firms have been more successful and consistent in managing their float, but sharp fluctuations in the fixed income and equity markets can dramatically affect short-term results.
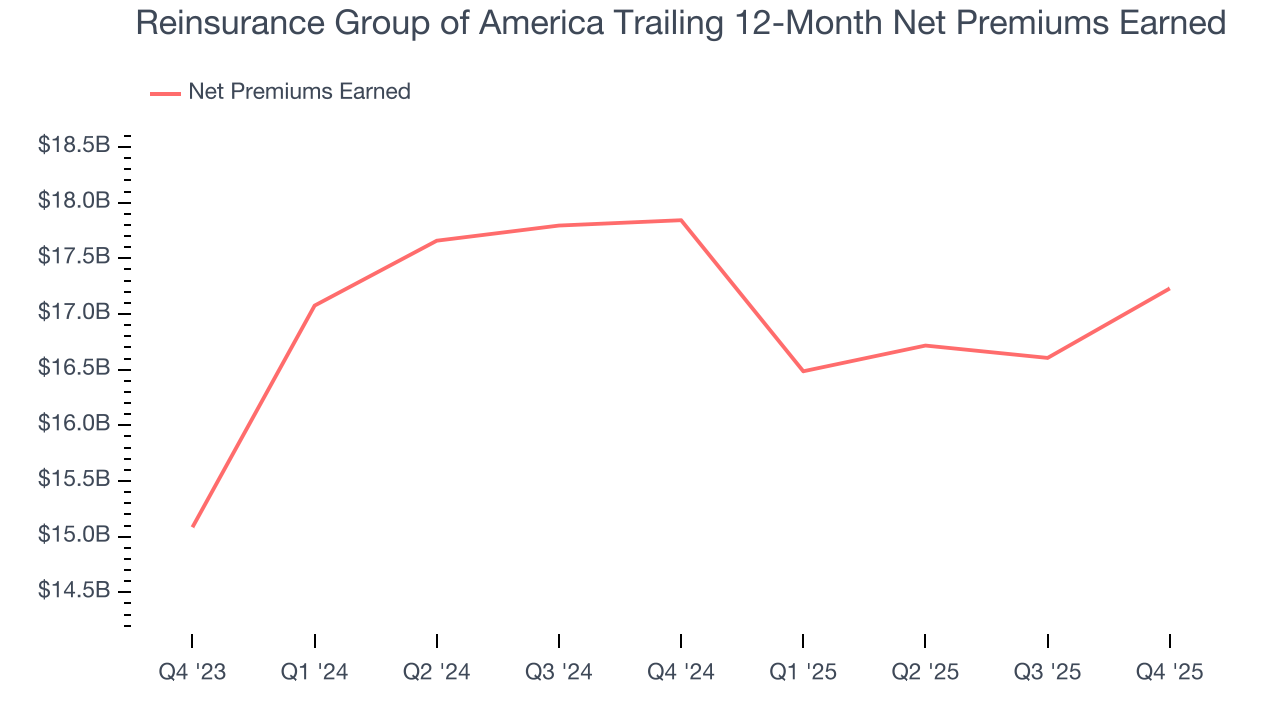
This quarter, Reinsurance Group of America’s net premiums earned was $4.78 billion, up a hearty 15% year on year and topping Wall Street Consensus estimates by 8%.
7. Combined Ratio
Revenue growth is one major determinant of business quality, and the efficiency of operations is another. For insurance companies, we look at the combined ratio rather than the operating expenses and margins that define sectors such as consumer, tech, and industrials.
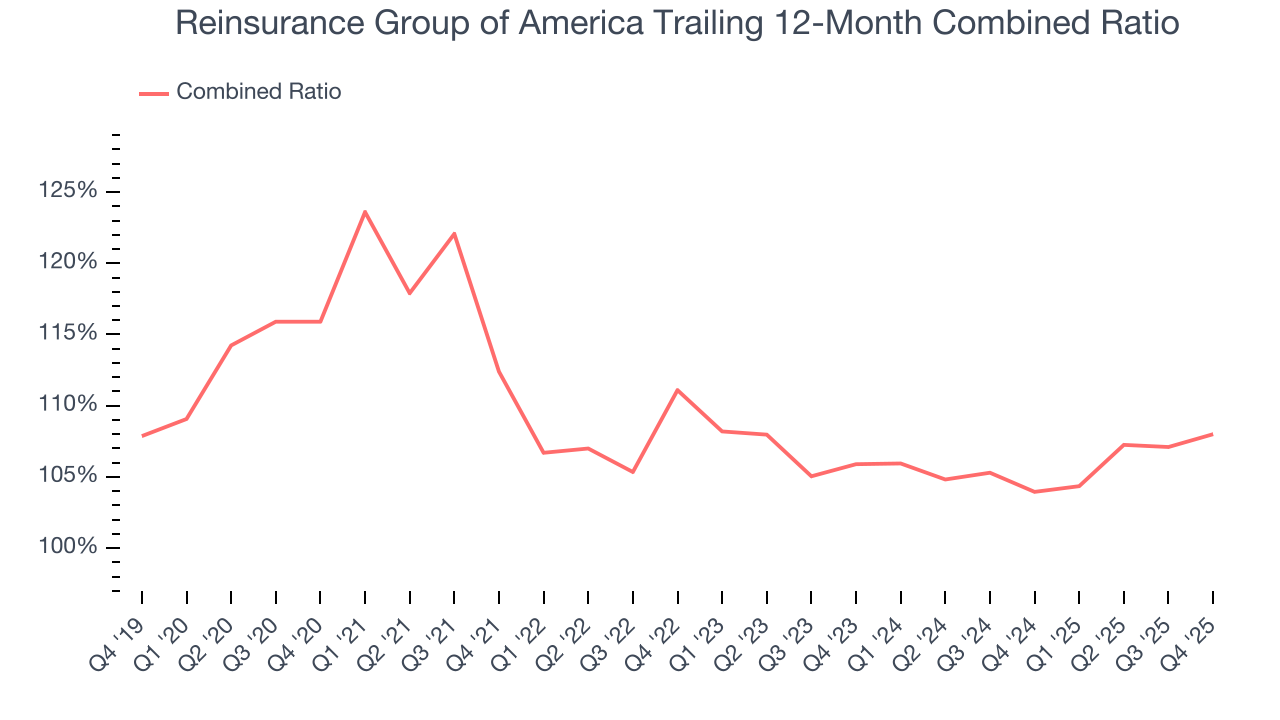
Combined ratio sums operating costs (salaries, commissions, overhead) with what is paid out in claims (losses) and divides this by net premiums earned. Combined ratios under 100% means profits while ones over 100% mean losses on its core operations of selling insurance policies.
Given the calculation, a lower expense ratio is better. Over the last five years, Reinsurance Group of America’s combined ratio has swelled by 7.9 percentage points, going from 112% to 108%. However, the company gave back some of its expense savings as its combined ratio worsened by 2.1 percentage points on a two-year basis.
8. Earnings Per Share
We track the long-term change in earnings per share (EPS) for the same reason as long-term revenue growth. Compared to revenue, however, EPS highlights whether a company’s growth is profitable.
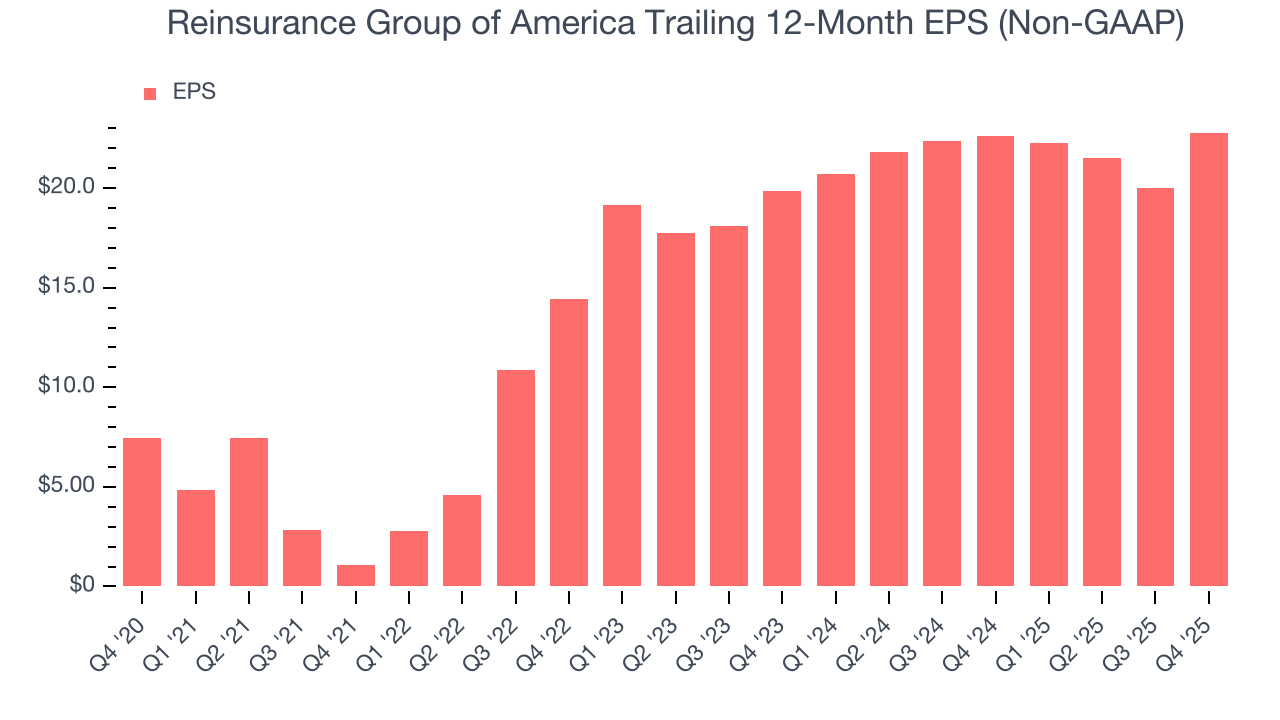
Reinsurance Group of America’s EPS grew at a spectacular 25% compounded annual growth rate over the last five years, higher than its 10.3% annualized revenue growth. However, this alone doesn’t tell us much about its business quality because its combined ratio didn’t improve.
Like with revenue, we analyze EPS over a shorter period to see if we are missing a change in the business.
For Reinsurance Group of America, its two-year annual EPS growth of 7.1% was lower than its five-year trend. We hope its growth can accelerate in the future.
In Q4, Reinsurance Group of America reported adjusted EPS of $7.75, up from $4.99 in the same quarter last year. This print easily cleared analysts’ estimates, and shareholders should be content with the results. Over the next 12 months, Wall Street expects Reinsurance Group of America’s full-year EPS of $22.79 to grow 13.3%.
9. Book Value Per Share (BVPS)
Insurance companies are balance sheet businesses, collecting premiums upfront and paying out claims over time. The float–premiums collected but not yet paid out–are invested, creating an asset base supported by a liability structure. Book value per share (BVPS) captures this dynamic by measuring these assets (investment portfolio, cash, reinsurance recoverables) less liabilities (claim reserves, debt, future policy benefits). BVPS is essentially the residual value for shareholders.
We therefore consider BVPS very important to track for insurers and a metric that sheds light on business quality because it reflects long-term capital growth and is harder to manipulate than more commonly-used metrics like EPS.
Reinsurance Group of America’s BVPS was flat over the last five years. However, BVPS growth has accelerated recently, growing by 21.9% annually over the last two years from $138.39 to $205.63 per share.
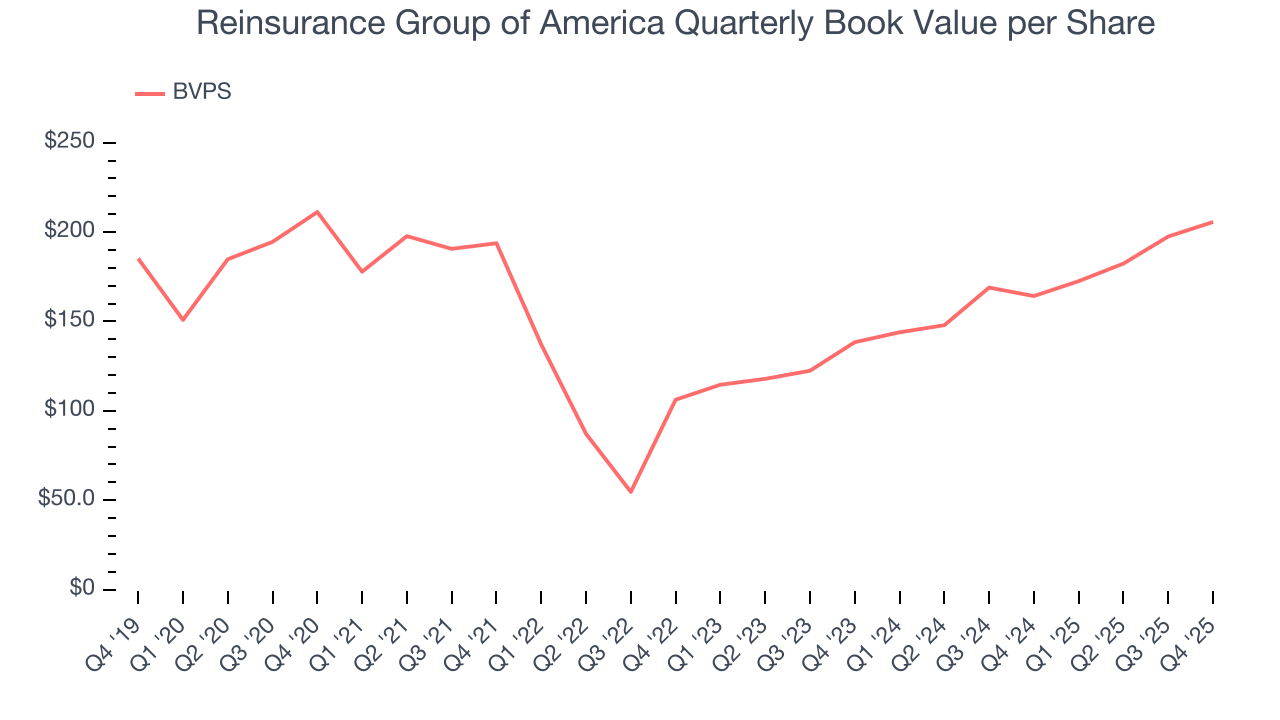
Over the next 12 months, Consensus estimates call for Reinsurance Group of America’s BVPS to shrink by 11.4% to $163.27, a sour projection.
10. Balance Sheet Assessment
The debt-to-equity ratio is a widely used measure to assess a company's balance sheet health. A higher ratio means that a business aggressively financed its growth with debt. This can result in higher earnings (if the borrowed funds are invested profitably) but also increases risk.
If debt levels are too high, there could be difficulties in meeting obligations, especially during economic downturns or periods of rising interest rates if the debt has variable-rate payments.
Reinsurance Group of America has no debt, so leverage is not an issue here.
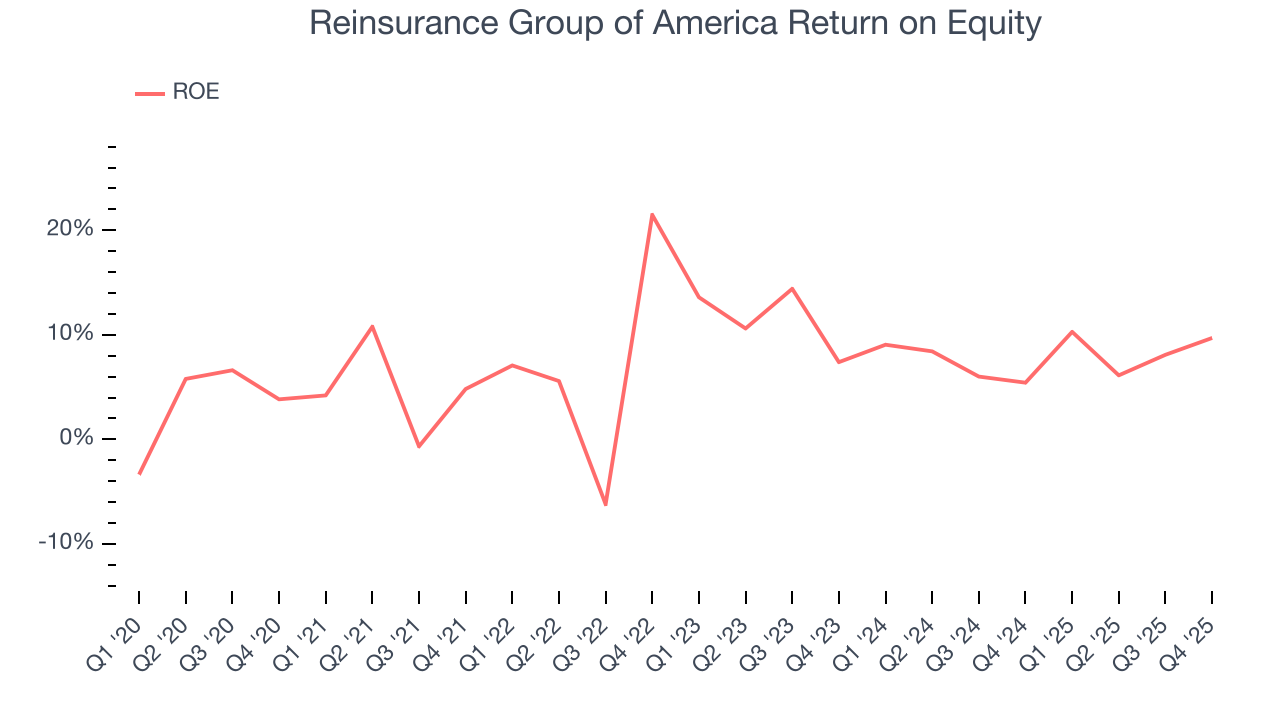
11. Return on Equity
Return on equity, or ROE, represents the ultimate measure of an insurer's effectiveness, quantifying how well it transforms shareholder investments into profits. Over the long term, insurance companies with robust ROE metrics typically deliver superior shareholder returns through a balanced approach to capital management.
Over the last five years, Reinsurance Group of America has averaged an ROE of 7.8%, uninspiring for a company operating in a sector where the average shakes out around 12.5%.
12. Key Takeaways from Reinsurance Group of America’s Q4 Results
We were impressed by how significantly Reinsurance Group of America blew past analysts’ book value per share expectations this quarter. We were also glad its EPS outperformed Wall Street’s estimates. Zooming out, we think this quarter featured some important positives. The stock traded up 4.5% to $215.29 immediately following the results.
13. Is Now The Time To Buy Reinsurance Group of America?
Updated: February 5, 2026 at 4:36 PM EST
Before deciding whether to buy Reinsurance Group of America or pass, we urge investors to consider business quality, valuation, and the latest quarterly results.
Reinsurance Group of America isn’t a terrible business, but it doesn’t pass our quality test. Although its revenue growth was solid over the last five years, it’s expected to deteriorate over the next 12 months and its estimated sales for the next 12 months are weak. And while the company’s spectacular EPS growth over the last five years shows its profits are trickling down to shareholders, the downside is its BVPS growth was weak over the last five years.
Reinsurance Group of America’s P/B ratio based on the next 12 months is 0.9x. This valuation is reasonable, but the company’s shakier fundamentals present too much downside risk. We're fairly confident there are better investments elsewhere.
Wall Street analysts have a consensus one-year price target of $236.89 on the company (compared to the current share price of $215.29).