
Renasant (RNST)
We’re skeptical of Renasant. Its sales have underperformed and its low returns on capital show it has few growth opportunities.― StockStory Analyst Team
1. News


2. Summary
Why Renasant Is Not Exciting
Founded in 1904 during a time when the South was rebuilding its economy, Renasant (NYSE:RNST) is a regional bank holding company that offers banking, wealth management, insurance, and specialized lending services throughout the Southeast.
- Underwhelming 7.1% return on equity reflects management’s difficulties in finding profitable growth opportunities
- Annual tangible book value per share growth of 3.6% over the last five years was below our standards for the banking sector
- On the bright side, its anticipated efficiency ratio improvement of -9.4 percentage points over the next year signals it will gain leverage on its fixed costs and become more productive


Renasant doesn’t measure up to our expectations. There are superior stocks for sale in the market.
Why There Are Better Opportunities Than Renasant


Renasant’s stock price of $35.19 implies a valuation ratio of 0.8x forward P/B. Yes, this valuation multiple is lower than that of other banking peers, but we’ll remind you that you often get what you pay for.
Cheap stocks can look like great bargains at first glance, but you often get what you pay for. These mediocre businesses often have less earnings power, meaning there is more reliance on a re-rating to generate good returns - an unlikely scenario for low-quality companies.
3. Renasant (RNST) Research Report: Q4 CY2025 Update
Regional banking company Renasant (NYSE:RNST) reported Q4 CY2025 results exceeding the market’s revenue expectations, with sales up 64.3% year on year to $278.5 million. Its non-GAAP profit of $0.91 per share was 13.5% above analysts’ consensus estimates.
Renasant (RNST) Q4 CY2025 Highlights:
- Net Interest Income: $227.4 million vs analyst estimates of $229.4 million (71.1% year-on-year growth, 0.9% miss)
- Net Interest Margin: 3.9% vs analyst estimates of 3.8% (7.3 basis point beat)
- Revenue: $278.5 million vs analyst estimates of $275.5 million (64.3% year-on-year growth, 1.1% beat)
- Efficiency Ratio: 60.2% vs analyst estimates of 58.1% (217.6 basis point miss)
- Adjusted EPS: $0.91 vs analyst estimates of $0.80 (13.5% beat)
- Tangible Book Value per Share: $24.65 vs analyst estimates of $24.42 (6.5% year-on-year decline, 1% beat)
- Market Capitalization: $3.54 billion
Company Overview
Founded in 1904 during a time when the South was rebuilding its economy, Renasant (NYSE:RNST) is a regional bank holding company that offers banking, wealth management, insurance, and specialized lending services throughout the Southeast.
Renasant operates through three main segments: Community Banks, Insurance, and Wealth Management. The Community Banks segment forms the core of Renasant's business, offering traditional banking services like checking and savings accounts, treasury management, and various loan products. The company's lending portfolio is diverse, with significant focus on commercial real estate loans (which represent over 40% of its total loans) and commercial and industrial loans, including specialized offerings like asset-based lending, factoring, and healthcare financing.
Beyond traditional banking, Renasant provides wealth management services through its Trust and Financial Services divisions. The Trust division manages retirement plans, personal trusts, and estates, while the Financial Services division offers investment products like annuities and mutual funds. Through Renasant Insurance, the company also sells commercial and personal insurance policies from major carriers.
Renasant serves both individuals and businesses of all sizes through its branch network, online banking platform, and mobile applications. A business customer might use Renasant for a commercial real estate loan to finance a new retail location, establish treasury management services to handle daily cash flow, and set up retirement plans for employees—all through the same institution. The company generates revenue primarily through interest income on loans, fees from deposit services, and commissions from wealth management and insurance products.
Renasant's operations are subject to oversight by multiple regulatory bodies, including the Federal Reserve, the FDIC, and state banking authorities, which monitor the company's financial health and compliance with consumer protection laws.
4. Regional Banks
Regional banks, financial institutions operating within specific geographic areas, serve as intermediaries between local depositors and borrowers. They benefit from rising interest rates that improve net interest margins (the difference between loan yields and deposit costs), digital transformation reducing operational expenses, and local economic growth driving loan demand. However, these banks face headwinds from fintech competition, deposit outflows to higher-yielding alternatives, credit deterioration (increasing loan defaults) during economic slowdowns, and regulatory compliance costs. Recent concerns about regional bank stability following high-profile failures and significant commercial real estate exposure present additional challenges.
Renasant competes with other regional banks operating in the Southeast such as Regions Financial (NYSE:RF), Truist Financial (NYSE:TFC), First Horizon (NYSE:FHN), and Synovus Financial (NYSE:SNV), as well as national banks with significant presence in the region like Bank of America (NYSE:BAC) and Wells Fargo (NYSE:WFC).
5. Sales Growth
Two primary revenue streams drive bank earnings. While net interest income, which is earned by charging higher rates on loans than paid on deposits, forms the foundation, fee-based services across banking, credit, wealth management, and trading operations provide additional income. Regrettably, Renasant’s revenue grew at a tepid 8% compounded annual growth rate over the last five years. This fell short of our benchmark for the banking sector and is a tough starting point for our analysis.
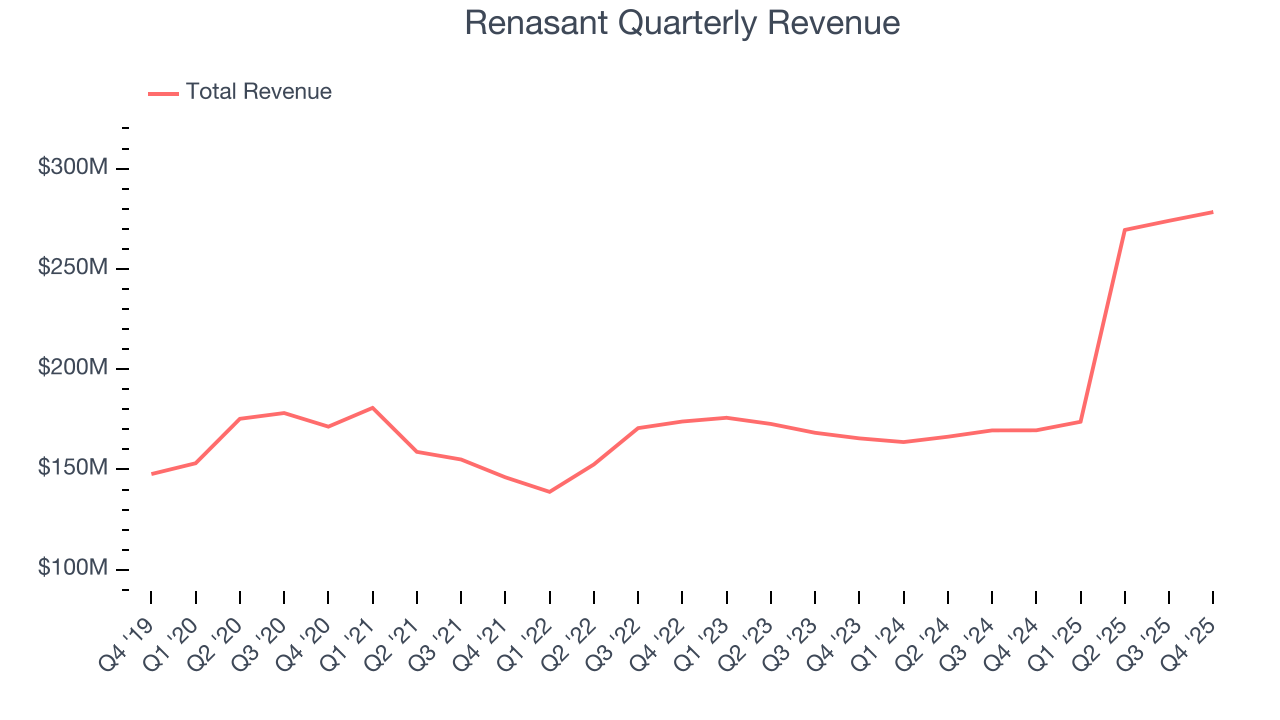
We at StockStory place the most emphasis on long-term growth, but within financials, a half-decade historical view may miss recent interest rate changes, market returns, and industry trends. Renasant’s annualized revenue growth of 20.8% over the last two years is above its five-year trend, suggesting its demand recently accelerated. 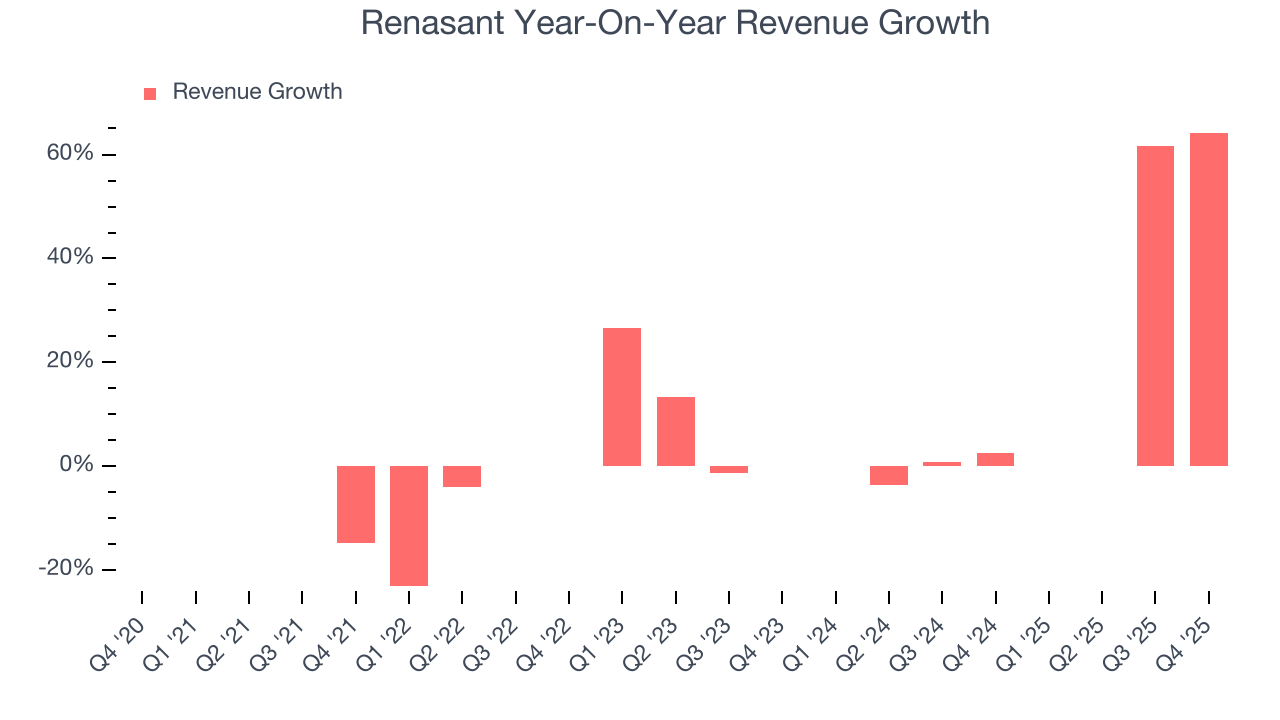 Note: Quarters not shown were determined to be outliers, impacted by outsized investment gains/losses that are not indicative of the recurring fundamentals of the business.
This quarter, Renasant reported magnificent year-on-year revenue growth of 64.3%, and its $278.5 million of revenue beat Wall Street’s estimates by 1.1%.
Net interest income made up 75% of the company’s total revenue during the last five years, meaning lending operations are Renasant’s largest source of revenue.
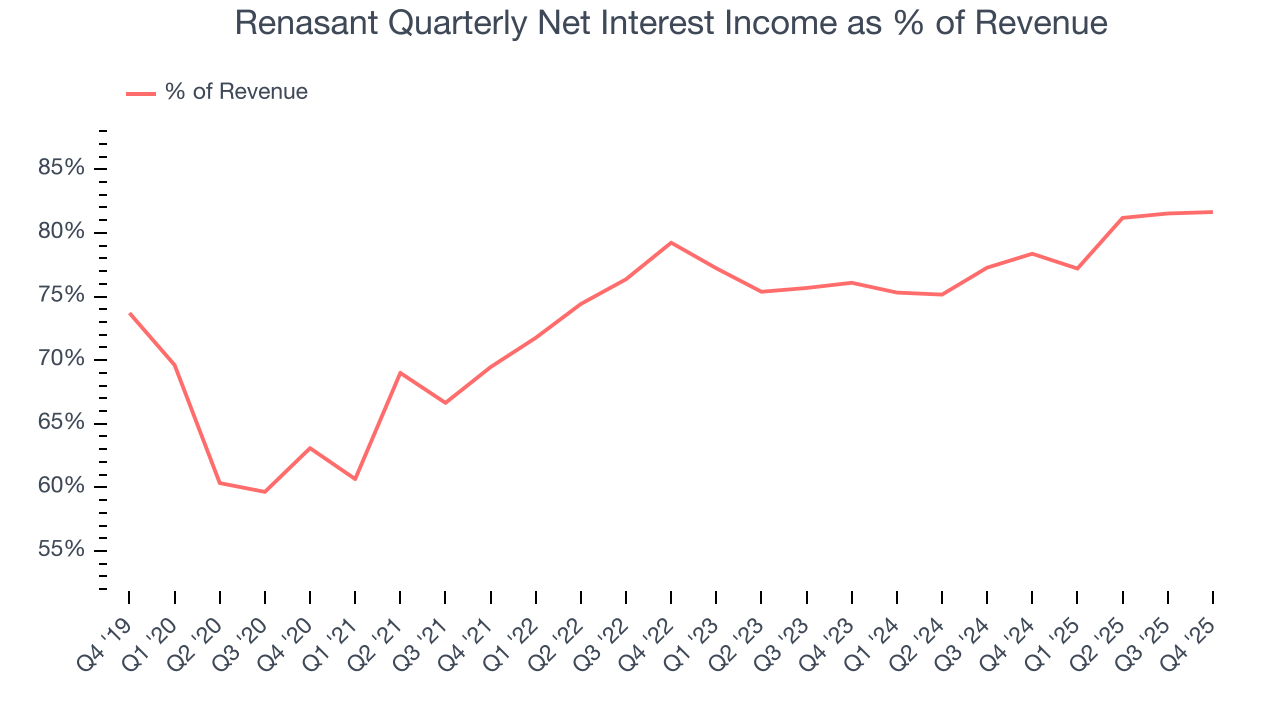
Net interest income commands greater market attention due to its reliability and consistency, whereas non-interest income is often seen as lower-quality revenue that lacks the same dependable characteristics.
6. Efficiency Ratio
Topline growth is certainly important, but the overall profitability of this growth matters for the bottom line. For banks, we look at efficiency ratio, which is non-interest expense (salaries, rent, IT, marketing, excluding interest paid out to depositors) as a percentage of total revenue.
Markets emphasize efficiency ratio trends over static measurements, recognizing that revenue compositions drive different expense bases. Lower efficiency ratios signal superior performance by indicating that banks are controlling costs effectively relative to their income.
Over the last five years, Renasant’s efficiency ratio has increased by 1 percentage points, going from 65.7% to 65.1%. Said differently, the company’s expenses have increased at a faster rate than revenue, which usually raises questions unless the company is in high-growth mode and reinvesting its profits into attractive ventures.
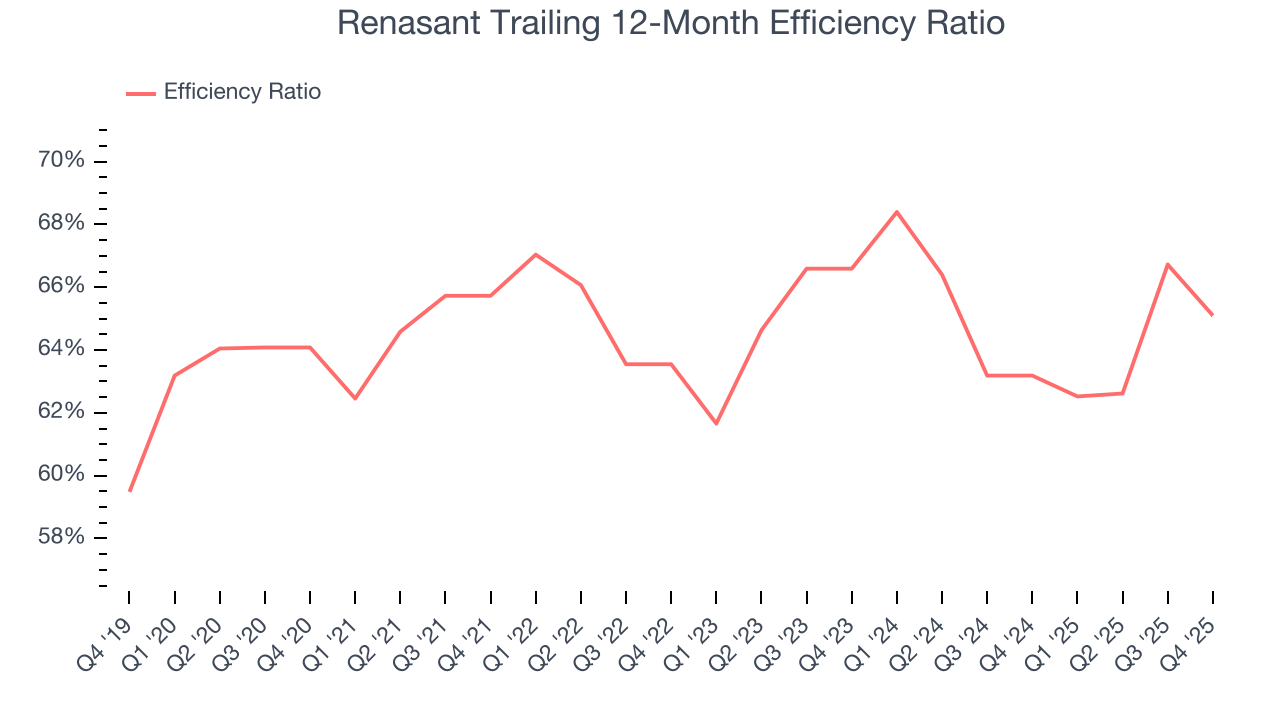
In Q4, Renasant’s efficiency ratio was 60.2%, falling short of analysts’ expectations by 217.6 basis points (100 basis points = 1 percentage point).
For the next 12 months, Wall Street expects Renasant to rein in some of its expenses as it anticipates an efficiency ratio of 55.8%.
7. Earnings Per Share
Revenue trends explain a company’s historical growth, but the long-term change in earnings per share (EPS) points to the profitability of that growth – for example, a company could inflate its sales through excessive spending on advertising and promotions.
Renasant’s unimpressive 9.4% annual EPS growth over the last five years aligns with its revenue performance. On the bright side, this tells us its incremental sales were profitable.
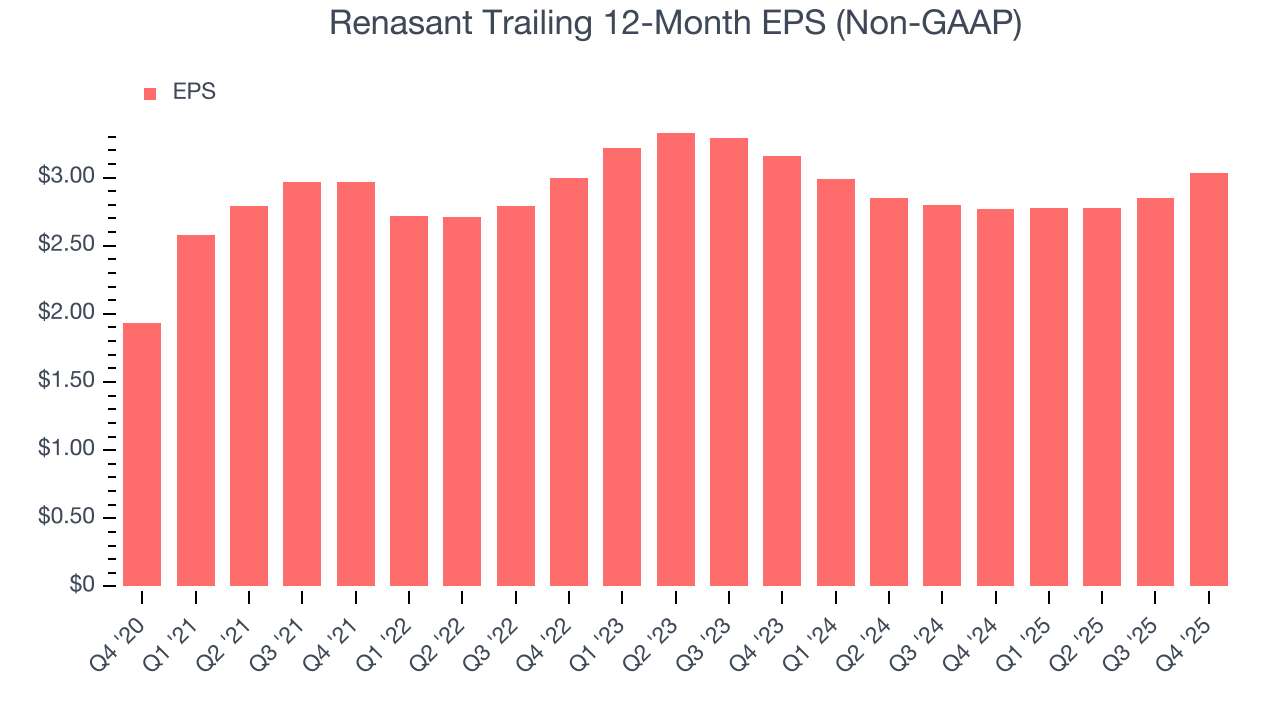
Like with revenue, we analyze EPS over a more recent period because it can provide insight into an emerging theme or development for the business.
Renasant’s two-year annual EPS declines of 2.1% were bad and lower than its 20.8% two-year revenue growth.
Diving into the nuances of Renasant’s earnings can give us a better understanding of its performance. A two-year view shows Renasant has diluted its shareholders, growing its share count by 68.1%. This has led to lower per share earnings. Taxes can also affect EPS but don’t tell us as much about a company’s fundamentals. 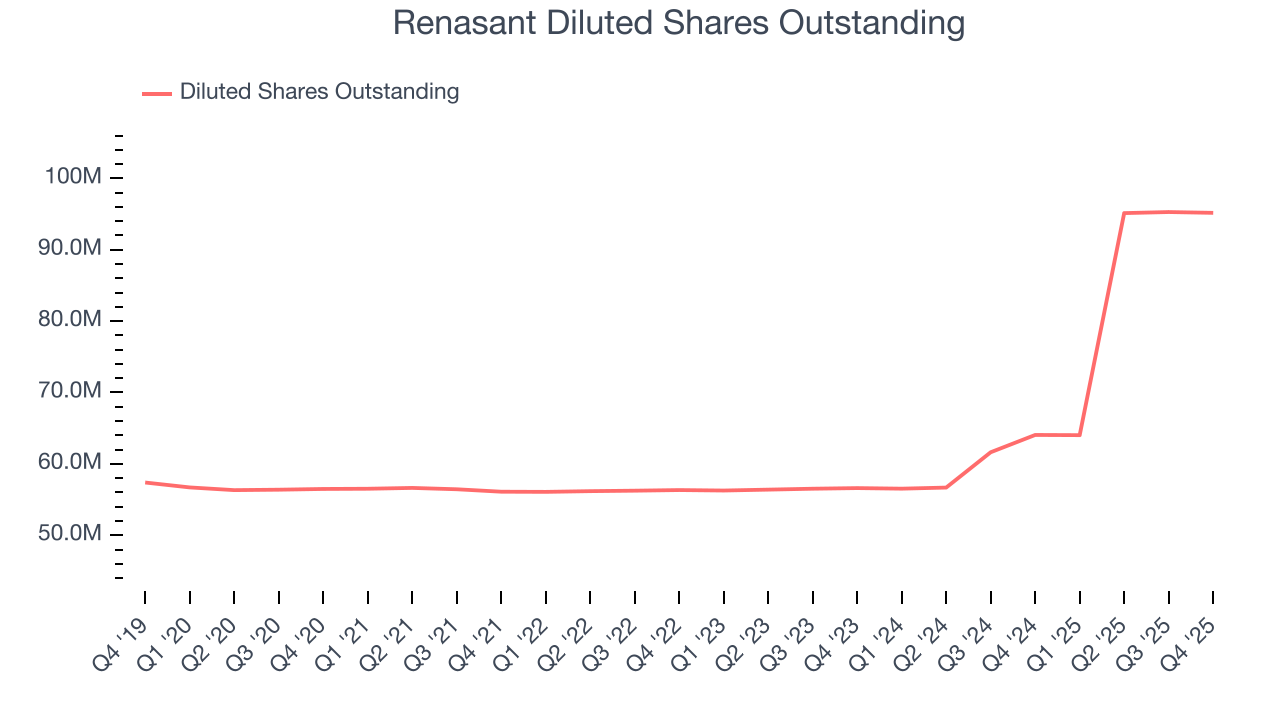
In Q4, Renasant reported adjusted EPS of $0.91, up from $0.73 in the same quarter last year. This print easily cleared analysts’ estimates, and shareholders should be content with the results. Over the next 12 months, Wall Street expects Renasant’s full-year EPS of $3.03 to grow 16%.
8. Tangible Book Value Per Share (TBVPS)
The balance sheet drives banking profitability since earnings flow from the spread between borrowing and lending rates. As such, valuations for these companies concentrate on capital strength and sustainable equity accumulation potential.
This is why we consider tangible book value per share (TBVPS) the most important metric to track for banks. TBVPS represents the real, liquid net worth per share of a bank, excluding intangible assets that have debatable value upon liquidation. On the other hand, EPS is often distorted by mergers and flexible loan loss accounting. TBVPS provides clearer performance insights.
Renasant’s TBVPS grew at a tepid 3.6% annual clip over the last five years. The last two years show a similar trajectory as TBVPS grew by 3.7% annually from $22.92 to $24.65 per share.
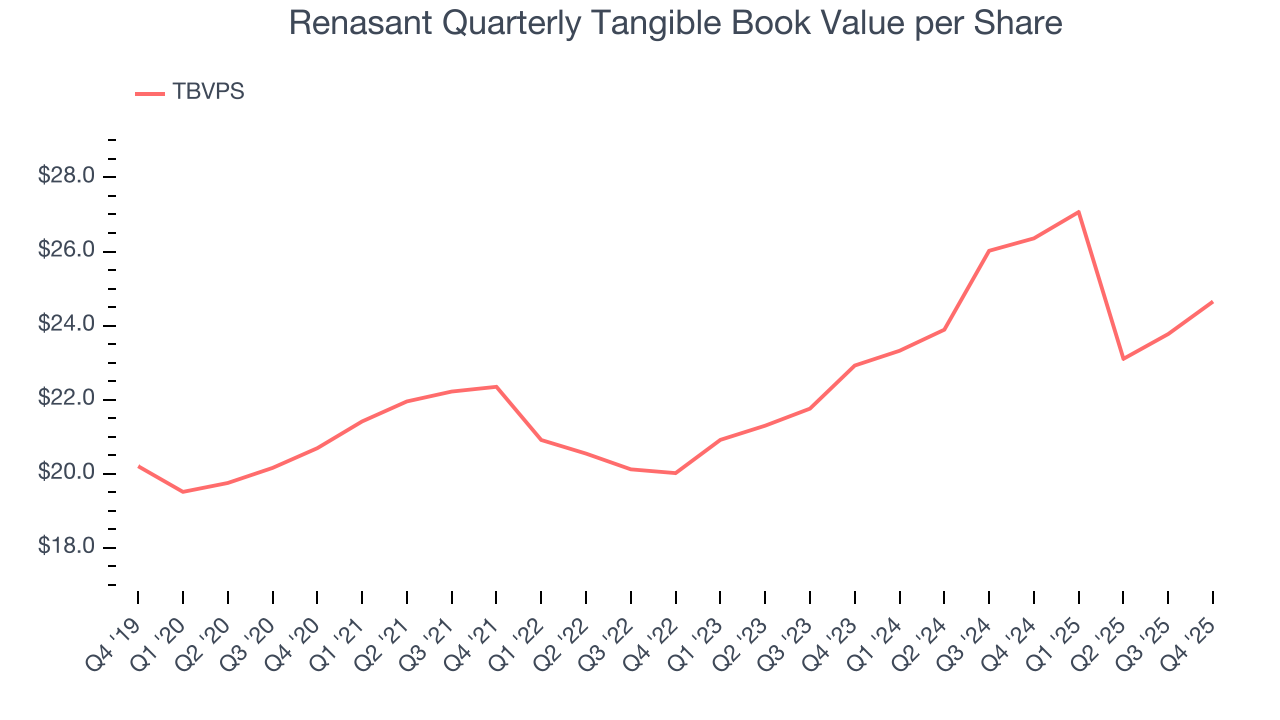
Over the next 12 months, Consensus estimates call for Renasant’s TBVPS to grow by 10.5% to $27.25, mediocre growth rate.
9. Balance Sheet Assessment
Leverage is core to a financial firm’s business model (loans funded by deposits). To ensure economic stability and avoid a repeat of the 2008 GFC, regulators require certain levels of capital and liquidity, focusing on the Tier 1 capital ratio.
Tier 1 capital is the highest-quality capital that a firm holds, consisting primarily of common stock and retained earnings, but also physical gold. It serves as the primary cushion against losses and is the first line of defense in times of financial distress.
This capital is divided by risk-weighted assets to derive the Tier 1 capital ratio. Risk-weighted means that cash and US treasury securities are assigned little risk while unsecured consumer loans and equity investments get much higher risk weights, for example.
New regulation after the 2008 financial crisis requires that all firms must maintain a Tier 1 capital ratio greater than 4.5%. On top of this, there are additional buffers based on scale, risk profile, and other regulatory classifications, so that at the end of the day, firms generally must maintain a 7-10% ratio at minimum.
Over the last two years, Renasant has averaged a Tier 1 capital ratio of 11.6%, which is considered safe and well capitalized in the event that macro or market conditions suddenly deteriorate.
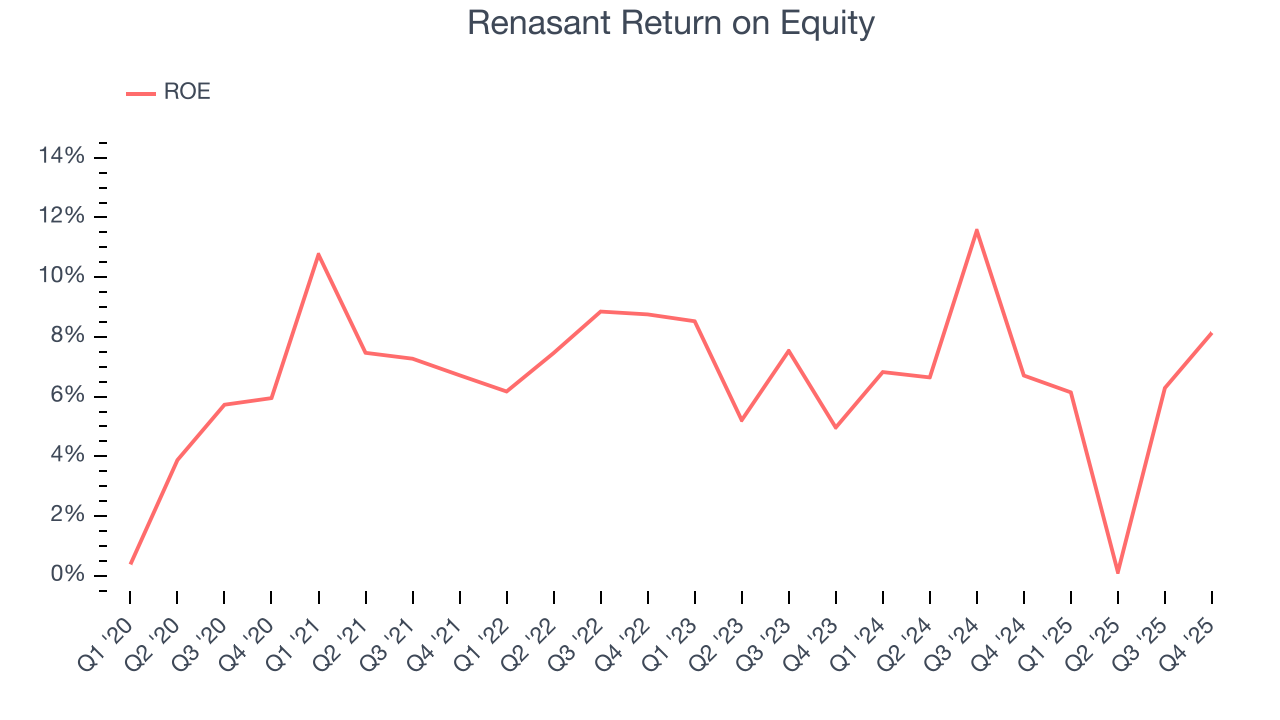
10. Return on Equity
Return on equity (ROE) reveals the profit generated per dollar of shareholder equity, which represents a key source of bank funding. Banks maintaining elevated ROE levels tend to accelerate wealth creation for shareholders via earnings retention, buybacks, and distributions.
Over the last five years, Renasant has averaged an ROE of 7.1%, uninspiring for a company operating in a sector where the average shakes out around 7.5%.
11. Key Takeaways from Renasant’s Q4 Results
It was good to see Renasant beat analysts’ EPS expectations this quarter. We were also happy its revenue narrowly outperformed Wall Street’s estimates. On the other hand, its net interest income slightly missed. Overall, this print had some key positives. The stock traded up 7.1% to $39.88 immediately after reporting.
12. Is Now The Time To Buy Renasant?
Updated: March 28, 2026 at 12:42 AM EDT
We think that the latest earnings result is only one piece of the bigger puzzle. If you’re deciding whether to own Renasant, you should also grasp the company’s longer-term business quality and valuation.
Renasant’s business quality ultimately falls short of our standards. First off, its revenue growth was mediocre over the last five years. While its anticipated efficiency ratio over the next year signals it will gain leverage on its fixed costs, the downside is its mediocre ROE lags the market and is a headwind for its stock price. On top of that, its TBVPS growth was uninspiring over the last five years.
Renasant’s P/B ratio based on the next 12 months is 0.8x. While this valuation is reasonable, we don’t really see a big opportunity at the moment. We're fairly confident there are better investments elsewhere.
Wall Street analysts have a consensus one-year price target of $44.43 on the company (compared to the current share price of $35.19).
Although the price target is bullish, readers should exercise caution because analysts tend to be overly optimistic. The firms they work for, often big banks, have relationships with companies that extend into fundraising, M&A advisory, and other rewarding business lines. As a result, they typically hesitate to say bad things for fear they will lose out. We at StockStory do not suffer from such conflicts of interest, so we’ll always tell it like it is.