
Rogers (ROG)
Rogers is in for a bumpy ride. Its low returns on capital and plummeting sales suggest it struggles to generate demand and profits, a red flag.― StockStory Analyst Team
1. News


2. Summary
Why We Think Rogers Will Underperform
With roots dating back to 1832, making it one of America's oldest continuously operating companies, Rogers (NYSE:ROG) designs and manufactures specialized engineered materials and components used in electric vehicles, telecommunications, renewable energy, and other high-performance applications.
- Products and services are facing significant end-market challenges during this cycle as sales have declined by 5.5% annually over the last two years
- Falling earnings per share over the last five years has some investors worried as stock prices ultimately follow EPS over the long term
- Low returns on capital reflect management’s struggle to allocate funds effectively, and its falling returns suggest its earlier profit pools are drying up


Rogers doesn’t fulfill our quality requirements. There are more promising prospects in the market.
Why There Are Better Opportunities Than Rogers


At $108.97 per share, Rogers trades at 33.7x forward P/E. This multiple is higher than that of business services peers; it’s also rich for the top-line growth of the company. Not a great combination.
We prefer to invest in similarly-priced but higher-quality companies with superior earnings growth.
3. Rogers (ROG) Research Report: Q4 CY2025 Update
Engineered materials manufacturer Rogers (NYSE:ROG) reported Q4 CY2025 results topping the market’s revenue expectations, with sales up 4.8% year on year to $201.5 million. On the other hand, next quarter’s revenue guidance of $200.5 million was less impressive, coming in 2.9% below analysts’ estimates. Its non-GAAP profit of $0.89 per share was 48.3% above analysts’ consensus estimates.
Rogers (ROG) Q4 CY2025 Highlights:
- Revenue: $201.5 million vs analyst estimates of $196.5 million (4.8% year-on-year growth, 2.5% beat)
- Adjusted EPS: $0.89 vs analyst estimates of $0.60 (48.3% beat)
- Adjusted EBITDA: $34.4 million vs analyst estimates of $25.4 million (17.1% margin, 35.4% beat)
- Revenue Guidance for Q1 CY2026 is $200.5 million at the midpoint, below analyst estimates of $206.4 million
- Adjusted EPS guidance for Q1 CY2026 is $0.65 at the midpoint, below analyst estimates of $0.75
- EBITDA guidance for Q1 CY2026 is $31 million at the midpoint
- Operating Margin: 3.5%, up from 1.8% in the same quarter last year
- Free Cash Flow Margin: 20.9%, up from 9.5% in the same quarter last year
- Market Capitalization: $1.94 billion
Company Overview
With roots dating back to 1832, making it one of America's oldest continuously operating companies, Rogers (NYSE:ROG) designs and manufactures specialized engineered materials and components used in electric vehicles, telecommunications, renewable energy, and other high-performance applications.
Rogers operates through two main business segments: Advanced Electronics Solutions (AES) and Elastomeric Material Solutions (EMS). The AES segment produces circuit materials, ceramic substrates, and cooling solutions critical for applications where reliability is paramount. These materials serve as the foundation for components in electric vehicles, advanced driver assistance systems, radar systems, and telecommunications infrastructure.
The EMS segment focuses on engineered material solutions including polyurethane and silicone materials that provide cushioning, sealing, vibration management, and thermal regulation. These materials are found in everything from electric vehicle battery systems to portable electronics and medical devices.
For example, when an automotive manufacturer designs a new electric vehicle, they might use Rogers' circuit materials in the power management systems, their thermal solutions to keep batteries at optimal temperatures, and their elastomeric materials to reduce vibration and noise in the passenger compartment.
Rogers generates revenue by selling its materials and components to approximately 3,200 customers worldwide, including original equipment manufacturers (OEMs) and component suppliers. The company employs a technical sales approach, working collaboratively with customers to design and develop materials that meet specific performance requirements.
Innovation is central to Rogers' strategy, with research and development centers in Massachusetts, Arizona, Germany, and China. These innovation centers focus on developing new high-tech materials that align with emerging market needs, particularly in growth areas like electric vehicles, advanced driver assistance systems, and renewable energy, which collectively account for over half of the company's sales.
Rogers maintains manufacturing facilities across the United States, Europe, and Asia, allowing it to serve global customers with localized support. The company also operates through joint ventures in Japan and China to better serve Asian markets.
4. Electronic Components & Manufacturing
The sector could see higher demand as the prevalence of advanced electronics increases in industries such as automotive, healthcare, aerospace, and computing. The high-performance components and contract manufacturing expertise required for autonomous vehicles and cloud computing datacenters, for instance, will benefit companies in the space. However, headwinds include geopolitical risks, particularly U.S.-China trade tensions that could disrupt component sourcing and production as the Trump administration takes an increasingly antagonizing stance on foreign relations. Additionally, stringent environmental regulations on e-waste and emissions could force the industry to pivot in potentially costly ways.
Rogers competes with other specialty materials manufacturers such as DuPont (NYSE:DD), 3M (NYSE:MMM), Hexcel Corporation (NYSE:HXL), and Victrex plc (LON:VCT), as well as with more specialized private companies in specific product categories.
5. Revenue Growth
A company’s long-term performance is an indicator of its overall quality. Any business can put up a good quarter or two, but many enduring ones grow for years.
With $810.8 million in revenue over the past 12 months, Rogers is a small player in the business services space, which sometimes brings disadvantages compared to larger competitors benefiting from economies of scale and numerous distribution channels.
As you can see below, Rogers struggled to increase demand as its $810.8 million of sales for the trailing 12 months was close to its revenue five years ago. This shows demand was soft, a rough starting point for our analysis.
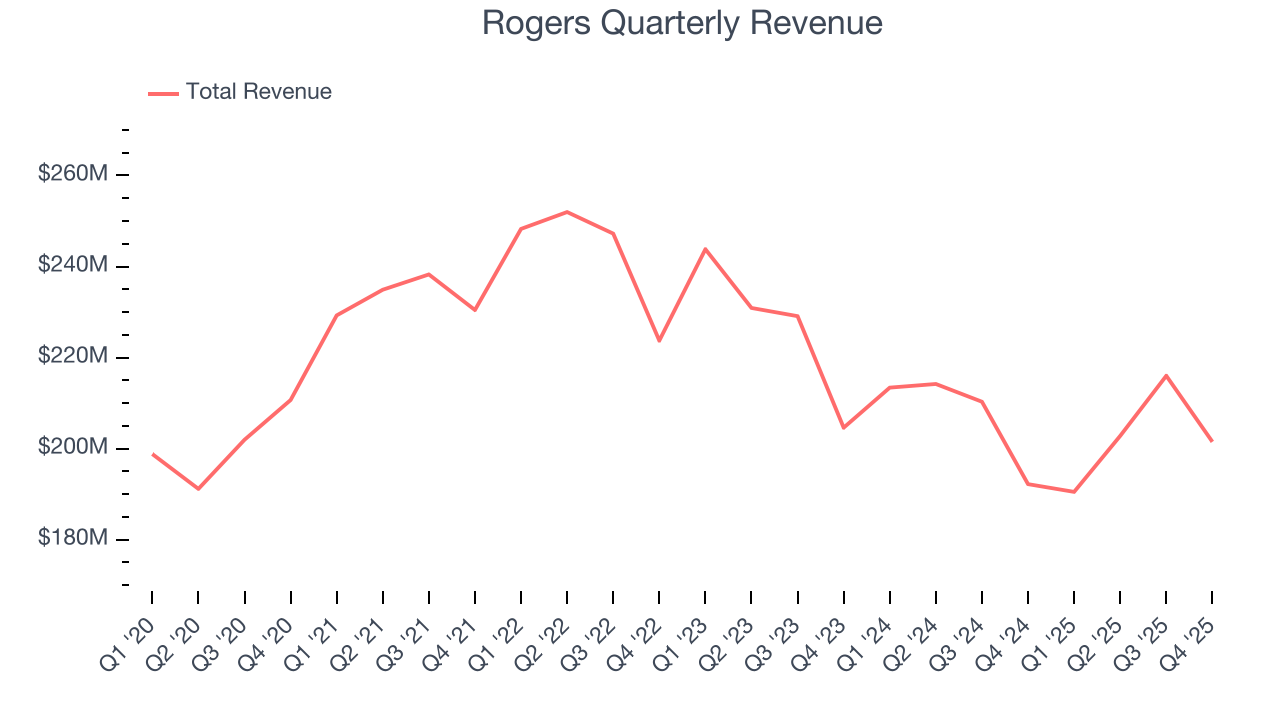
We at StockStory place the most emphasis on long-term growth, but within business services, a half-decade historical view may miss recent innovations or disruptive industry trends. Rogers’s recent performance shows its demand remained suppressed as its revenue has declined by 5.5% annually over the last two years. 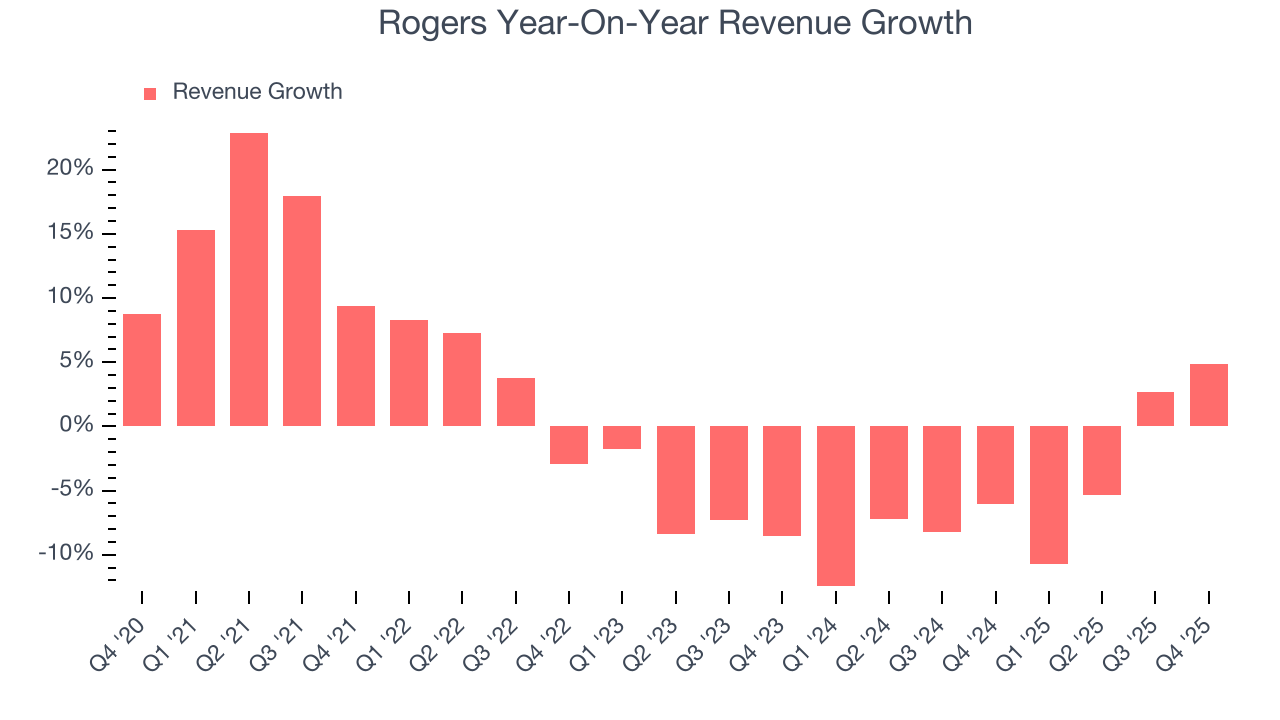
This quarter, Rogers reported modest year-on-year revenue growth of 4.8% but beat Wall Street’s estimates by 2.5%. Company management is currently guiding for a 5.2% year-on-year increase in sales next quarter.
Looking further ahead, sell-side analysts expect revenue to grow 6.8% over the next 12 months, an improvement versus the last two years. This projection is above average for the sector and indicates its newer products and services will catalyze better top-line performance.
6. Operating Margin
Operating margin is an important measure of profitability as it shows the portion of revenue left after accounting for all core expenses – everything from the cost of goods sold to advertising and wages. It’s also useful for comparing profitability across companies with different levels of debt and tax rates because it excludes interest and taxes.
Rogers was profitable over the last five years but held back by its large cost base. Its average operating margin of 8% was weak for a business services business.
Looking at the trend in its profitability, Rogers’s operating margin decreased by 8.1 percentage points over the last five years. Rogers’s performance was poor no matter how you look at it - it shows that costs were rising and it couldn’t pass them onto its customers.
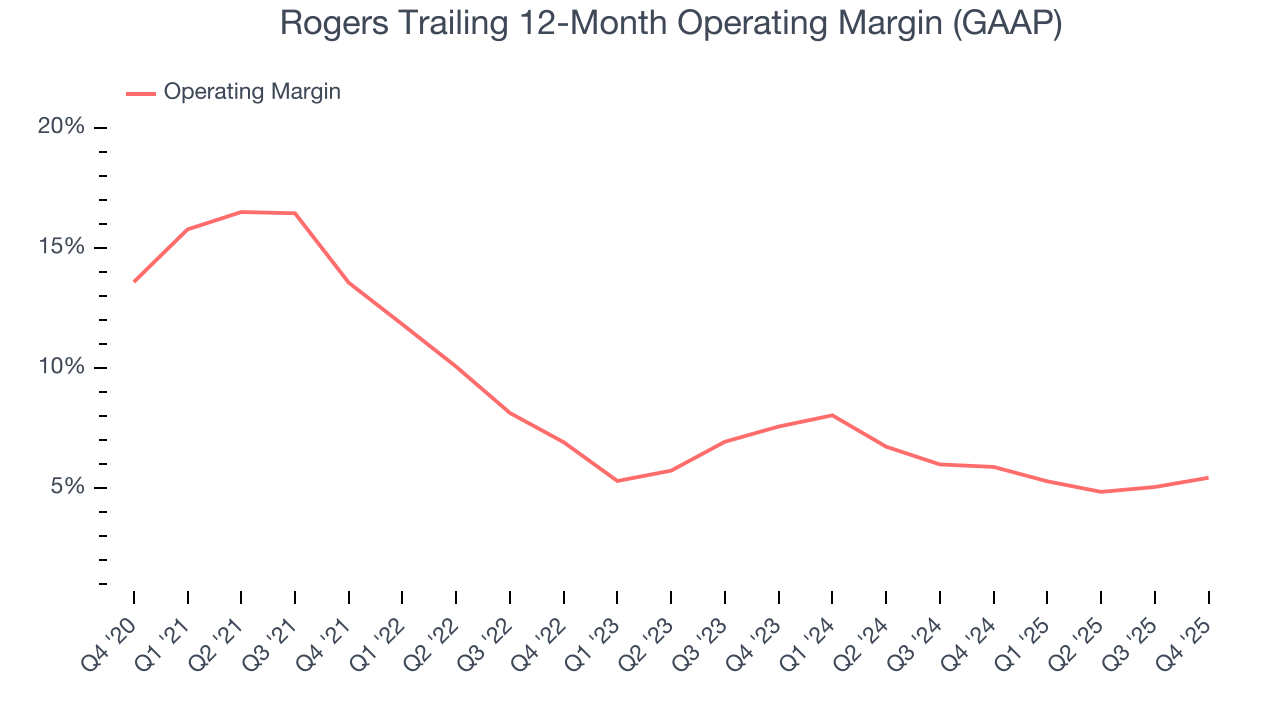
This quarter, Rogers generated an operating margin profit margin of 3.5%, up 1.7 percentage points year on year. This increase was a welcome development and shows it was more efficient.
7. Earnings Per Share
Revenue trends explain a company’s historical growth, but the long-term change in earnings per share (EPS) points to the profitability of that growth – for example, a company could inflate its sales through excessive spending on advertising and promotions.
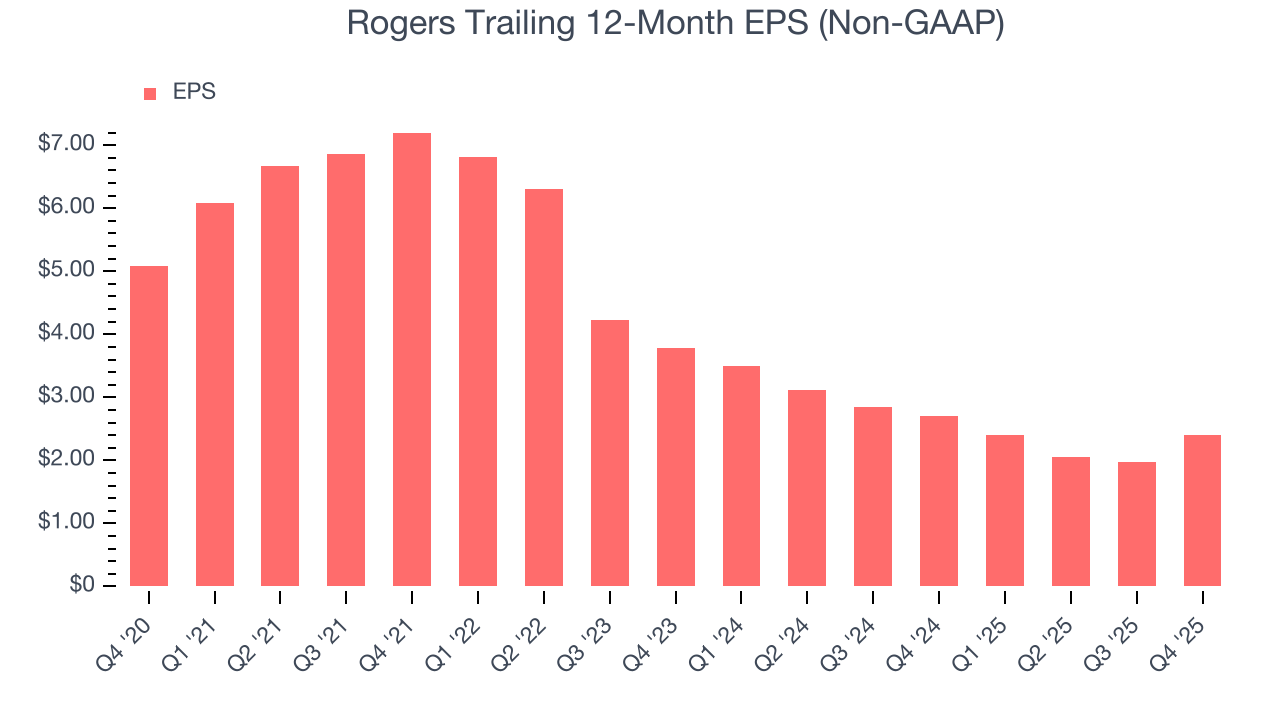
Sadly for Rogers, its EPS declined by 13.9% annually over the last five years while its revenue was flat. This tells us the company struggled because its fixed cost base made it difficult to adjust to choppy demand.
We can take a deeper look into Rogers’s earnings to better understand the drivers of its performance. As we mentioned earlier, Rogers’s operating margin expanded this quarter but declined by 8.1 percentage points over the last five years. This was the most relevant factor (aside from the revenue impact) behind its lower earnings; interest expenses and taxes can also affect EPS but don’t tell us as much about a company’s fundamentals.
Like with revenue, we analyze EPS over a shorter period to see if we are missing a change in the business.
For Rogers, its two-year annual EPS declines of 20.3% show it’s continued to underperform. These results were bad no matter how you slice the data.
In Q4, Rogers reported adjusted EPS of $0.89, up from $0.46 in the same quarter last year. This print easily cleared analysts’ estimates, and shareholders should be content with the results. Over the next 12 months, Wall Street expects Rogers’s full-year EPS of $2.40 to grow 41.3%.
8. Cash Is King
Free cash flow isn't a prominently featured metric in company financials and earnings releases, but we think it's telling because it accounts for all operating and capital expenses, making it tough to manipulate. Cash is king.
Rogers has shown decent cash profitability, giving it some flexibility to reinvest or return capital to investors. The company’s free cash flow margin averaged 6.3% over the last five years, slightly better than the broader business services sector.
Taking a step back, we can see that Rogers’s margin expanded by 3.1 percentage points during that time. This shows the company is heading in the right direction, and we can see it became a less capital-intensive business because its free cash flow profitability rose while its operating profitability fell.
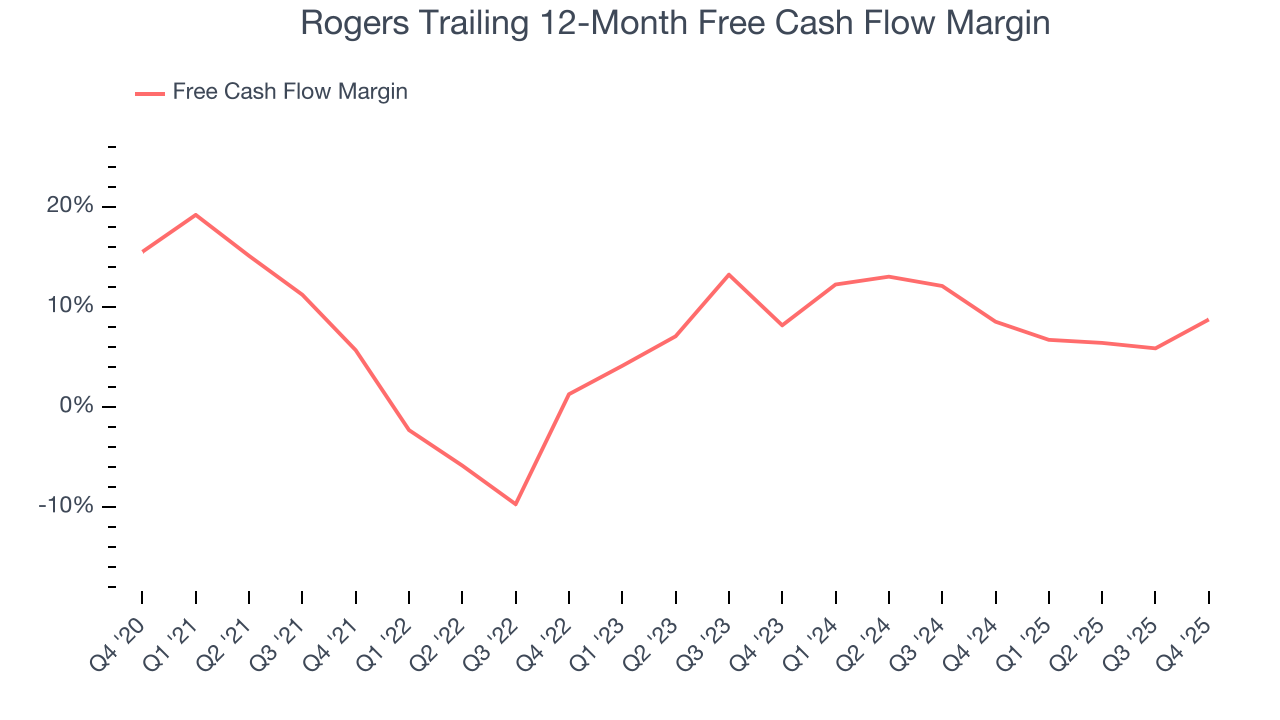
Rogers’s free cash flow clocked in at $42.2 million in Q4, equivalent to a 20.9% margin. This result was good as its margin was 11.4 percentage points higher than in the same quarter last year, building on its favorable historical trend.
9. Return on Invested Capital (ROIC)
EPS and free cash flow tell us whether a company was profitable while growing its revenue. But was it capital-efficient? A company’s ROIC explains this by showing how much operating profit it makes compared to the money it has raised (debt and equity).
Rogers historically did a mediocre job investing in profitable growth initiatives. Its five-year average ROIC was 5.2%, somewhat low compared to the best business services companies that consistently pump out 25%+.
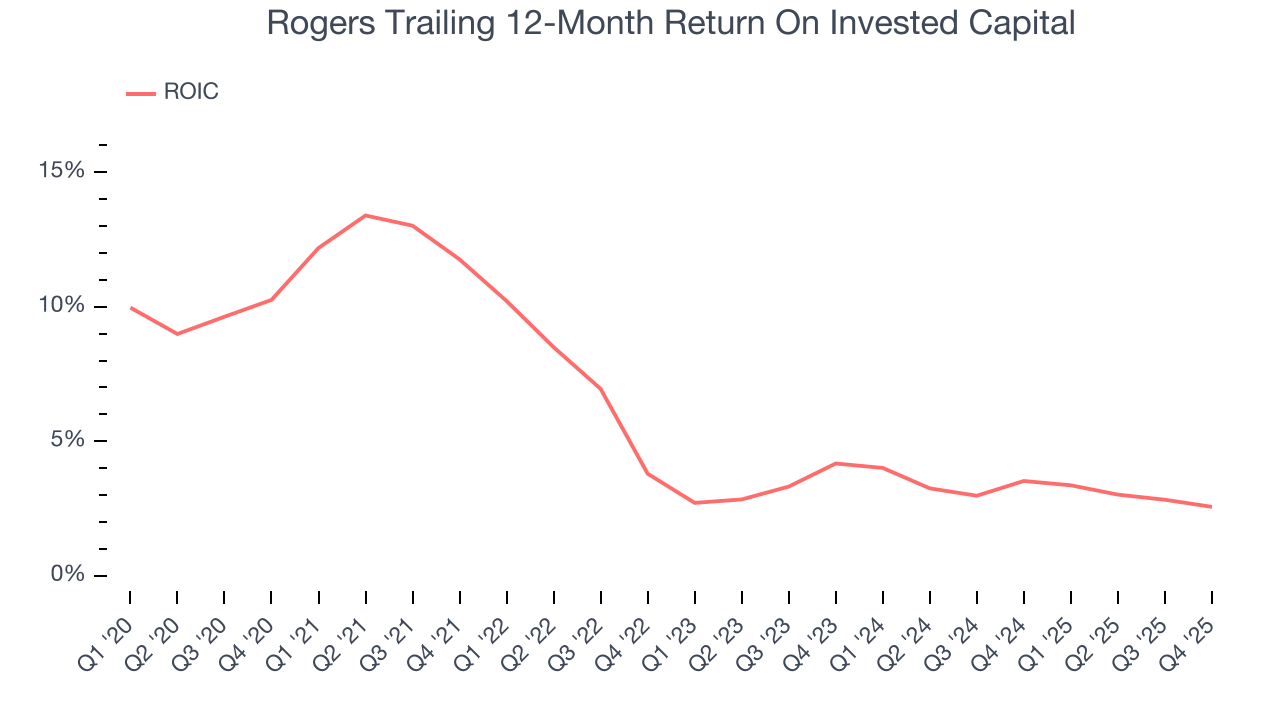
We like to invest in businesses with high returns, but the trend in a company’s ROIC is what often surprises the market and moves the stock price. Unfortunately, Rogers’s ROIC averaged 4.7 percentage point decreases each year over the last few years. Paired with its already low returns, these declines suggest its profitable growth opportunities are few and far between.
10. Balance Sheet Assessment
Companies with more cash than debt have lower bankruptcy risk.
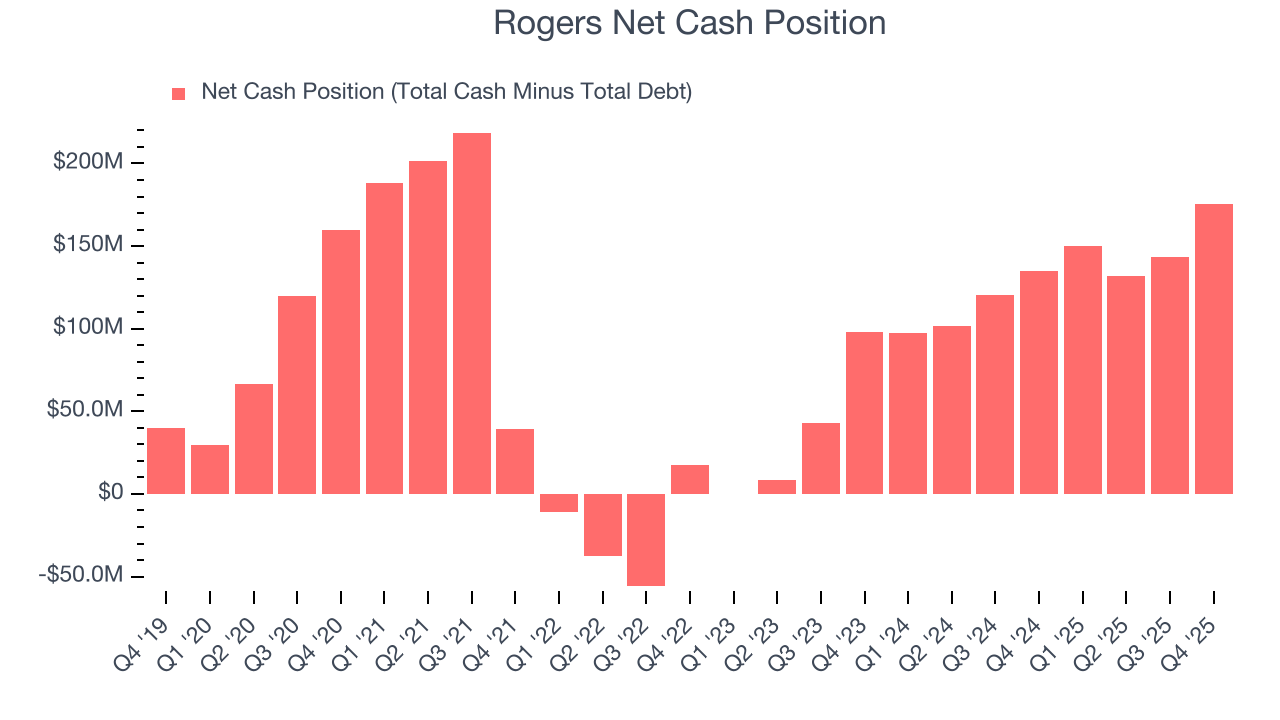
Rogers is a profitable, well-capitalized company with $197 million of cash and $21.8 million of debt on its balance sheet. This $175.2 million net cash position is 9% of its market cap and gives it the freedom to borrow money, return capital to shareholders, or invest in growth initiatives. Leverage is not an issue here.
11. Key Takeaways from Rogers’s Q4 Results
It was good to see Rogers beat analysts’ EPS expectations this quarter. We were also glad its revenue outperformed Wall Street’s estimates. On the other hand, its revenue guidance for next quarter missed and its EPS guidance for next quarter fell short of Wall Street’s estimates. Overall, this was a weaker quarter. The stock traded up 2% to $105.17 immediately following the results.
12. Is Now The Time To Buy Rogers?
Updated: March 29, 2026 at 12:04 AM EDT
When considering an investment in Rogers, investors should account for its valuation and business qualities as well as what’s happened in the latest quarter.
Rogers falls short of our quality standards. To begin with, its revenue growth was weak over the last five years. While its projected EPS for the next year implies the company’s fundamentals will improve, the downside is its declining EPS over the last five years makes it a less attractive asset to the public markets. On top of that, its declining operating margin shows the business has become less efficient.
Rogers’s P/E ratio based on the next 12 months is 33.7x. At this valuation, there’s a lot of good news priced in - we think there are better stocks to buy right now.
Wall Street analysts have a consensus one-year price target of $124.33 on the company (compared to the current share price of $108.97).