Rockwell Automation (ROK)
We’re cautious of Rockwell Automation. Its poor sales growth and falling returns on capital suggest its growth opportunities are shrinking.― StockStory Analyst Team
1. News


2. Summary
Why We Think Rockwell Automation Will Underperform
One of the first companies to address industrial automation, Rockwell Automation (NYSE:ROK) sells products that help customers extract more efficiency from their machinery.
- Core business is underperforming as its organic revenue has disappointed over the past two years, suggesting it might need acquisitions to stimulate growth
- Estimated sales growth of 5.2% for the next 12 months is soft and implies weaker demand
- On the plus side, its ROIC punches in at 19.8%, illustrating management’s expertise in identifying profitable investments


Rockwell Automation is in the penalty box. Better businesses are for sale in the market.
Why There Are Better Opportunities Than Rockwell Automation


Rockwell Automation’s stock price of $372.04 implies a valuation ratio of 30.6x forward P/E. Not only is Rockwell Automation’s multiple richer than most industrials peers, but it’s also expensive for its revenue characteristics.
There are stocks out there similarly priced with better business quality. We prefer owning these.
3. Rockwell Automation (ROK) Research Report: Q4 CY2025 Update
Industrials automation company Rockwell (NYSE:ROK) announced better-than-expected revenue in Q4 CY2025, with sales up 11.9% year on year to $2.11 billion. On the other hand, the company’s full-year revenue guidance of $8.8 billion at the midpoint came in 0.6% below analysts’ estimates. Its non-GAAP profit of $2.75 per share was 10.7% above analysts’ consensus estimates.
Rockwell Automation (ROK) Q4 CY2025 Highlights:
- Revenue: $2.11 billion vs analyst estimates of $2.08 billion (11.9% year-on-year growth, 1.4% beat)
- Adjusted EPS: $2.75 vs analyst estimates of $2.48 (10.7% beat)
- Adjusted EBITDA: $447 million vs analyst estimates of $439.4 million (21.2% margin, 1.7% beat)
- Management slightly raised its full-year Adjusted EPS guidance to $11.80 at the midpoint
- Operating Margin: 20.7%, up from 13.1% in the same quarter last year
- Free Cash Flow Margin: 8.1%, down from 15.6% in the same quarter last year
- Organic Revenue rose 10% year on year (beat)
- Market Capitalization: $48.33 billion
Company Overview
One of the first companies to address industrial automation, Rockwell Automation (NYSE:ROK) sells products that help customers extract more efficiency from their machinery.
The company’s main product offerings include programmable logic controllers (PLC) and human-machine interfaces for controlling machinery, sensors for detecting various physical attributes of the products in assembly lines to ensure quality control and safety, and many other kinds of monitors such as variable frequency drives that help manage the speed, torque, and positioning of electrical motors.
Its additional offerings include software to help the operation and maintenance of industrial operations, as well as to help transfer data between its sophisticated equipment. Lastly, the company offers consulting on best practices for automation, system integrations, and customized solutions based on specific needs.
Rockwell generates revenue through the sale of its hardware products, software products (which run on subscription-based payment models), system installations, and consulting and maintenance services, which include customer training. It sells to companies in the manufacturing, energy, infrastructure, and mining and metals industries through a knowledgeable direct sales team and distributors.
4. Internet of Things
Industrial Internet of Things (IoT) companies are buoyed by the secular trend of a more connected world. They often specialize in nascent areas such as hardware and services for factory automation, fleet tracking, or smart home technologies. Those who play their cards right can generate recurring subscription revenues by providing cloud-based software services, boosting their margins. On the other hand, if the technologies these companies have invested in don’t pan out, they may have to make costly pivots.
Competitors of Rockwell Automation include Siemens (ETR:SIE), Schneider Electric (EPA:SU), and ABB (NYSE:ABB).
5. Revenue Growth
Examining a company’s long-term performance can provide clues about its quality. Any business can have short-term success, but a top-tier one grows for years. Over the last five years, Rockwell Automation grew its sales at a mediocre 6.6% compounded annual growth rate. This was below our standard for the industrials sector and is a rough starting point for our analysis.
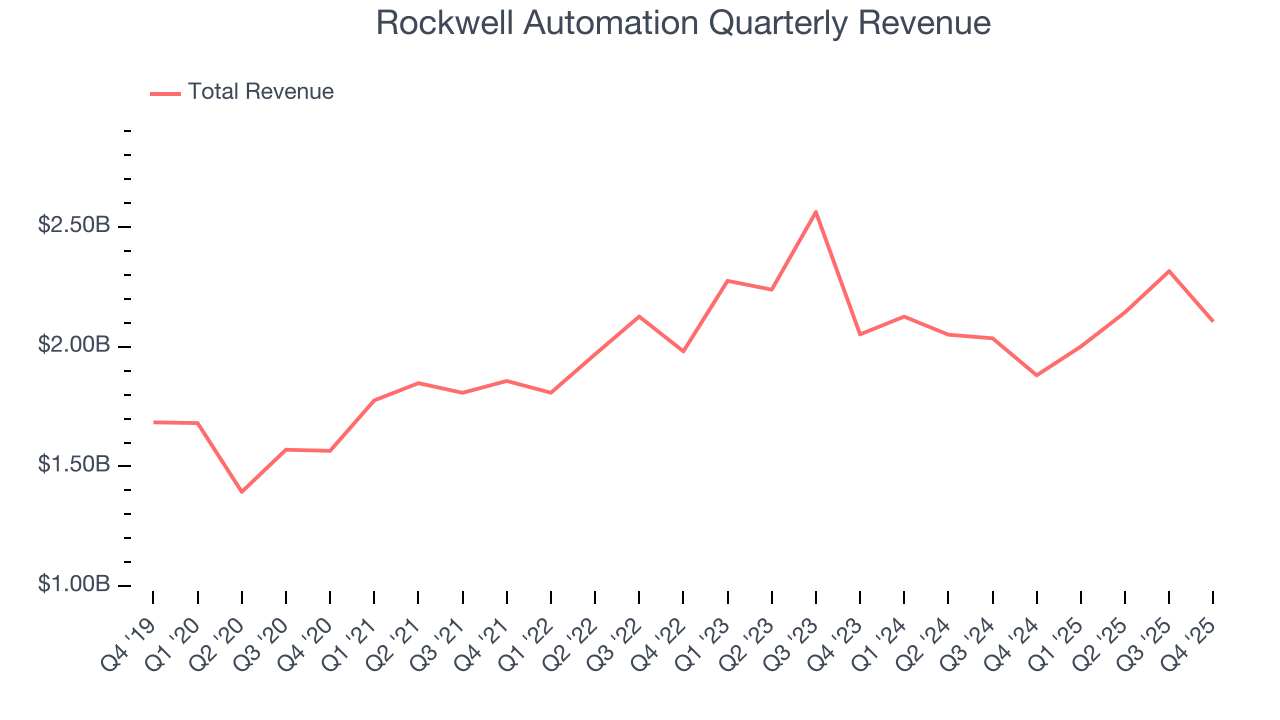
Long-term growth is the most important, but within industrials, a half-decade historical view may miss new industry trends or demand cycles. Rockwell Automation’s performance shows it grew in the past but relinquished its gains over the last two years, as its revenue fell by 3.1% annually. 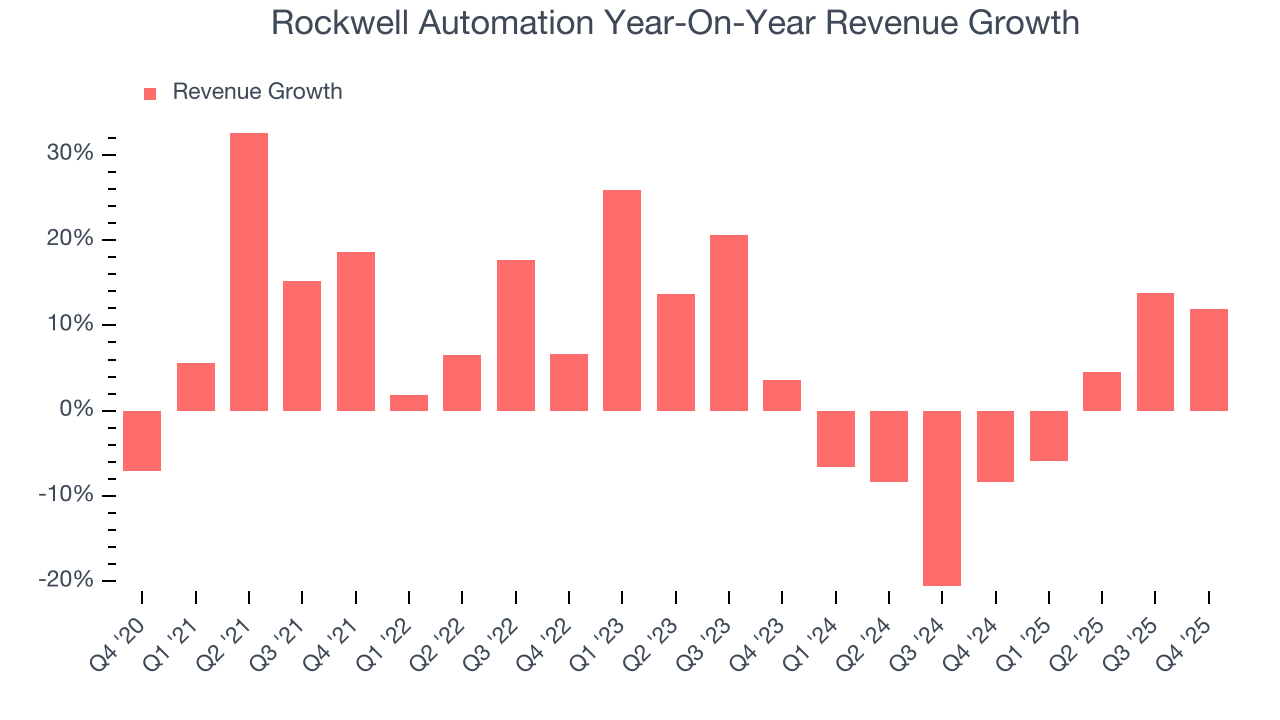
Rockwell Automation also reports organic revenue, which strips out one-time events like acquisitions and currency fluctuations that don’t accurately reflect its fundamentals. Over the last two years, Rockwell Automation’s organic revenue averaged 2.8% year-on-year declines. Because this number aligns with its two-year revenue growth, we can see the company’s core operations (not acquisitions and divestitures) drove most of its results. 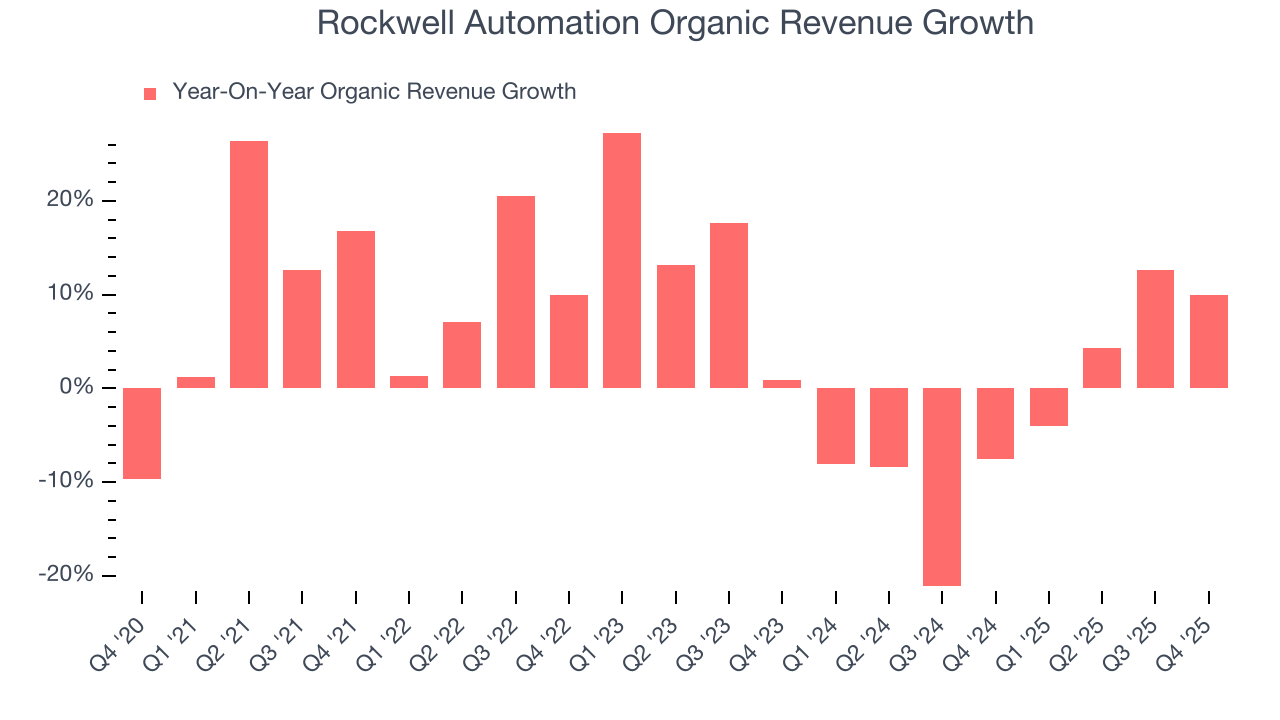
This quarter, Rockwell Automation reported year-on-year revenue growth of 11.9%, and its $2.11 billion of revenue exceeded Wall Street’s estimates by 1.4%.
Looking ahead, sell-side analysts expect revenue to grow 5% over the next 12 months. Although this projection suggests its newer products and services will catalyze better top-line performance, it is still below average for the sector.
6. Gross Margin & Pricing Power
All else equal, we prefer higher gross margins because they usually indicate that a company sells more differentiated products and commands stronger pricing power.
Rockwell Automation has best-in-class unit economics for an industrials company, enabling it to invest in areas such as research and development. Its margin also signals it sells differentiated products, not commodities. As you can see below, it averaged an elite 43.9% gross margin over the last five years. That means Rockwell Automation only paid its suppliers $56.12 for every $100 in revenue. 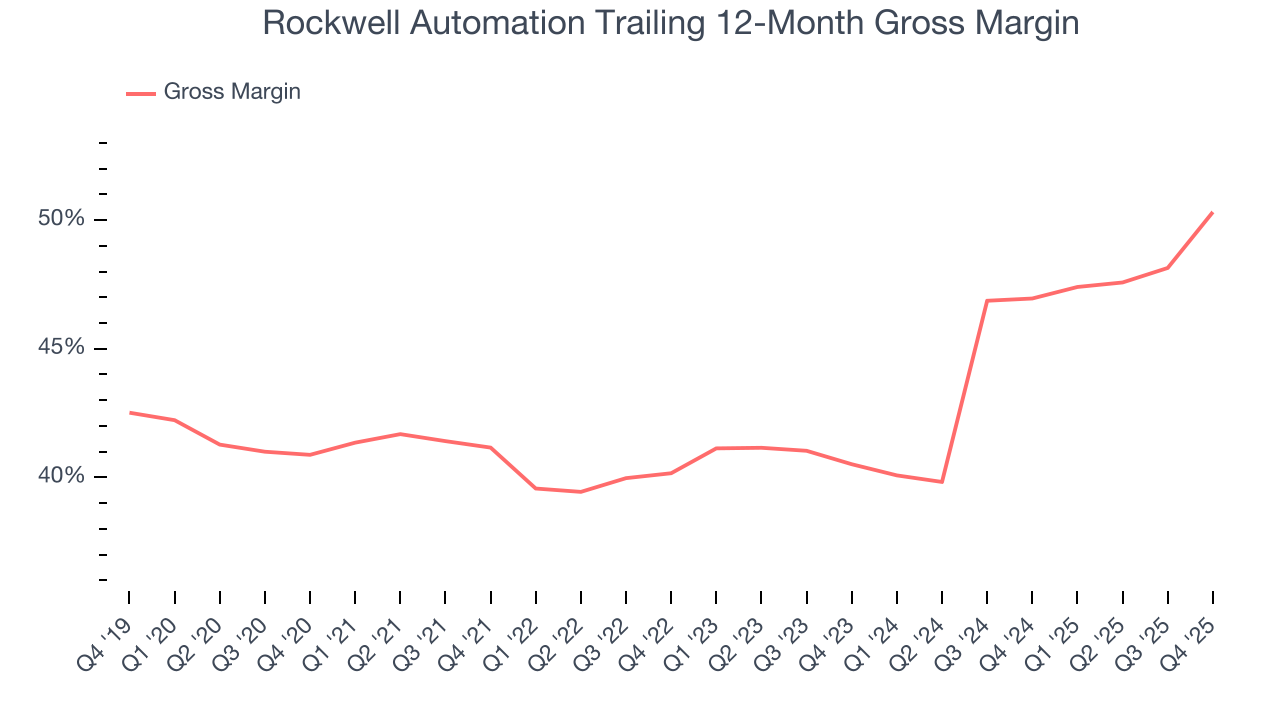
In Q4, Rockwell Automation produced a 48.3% gross profit margin, marking a 9.9 percentage point increase from 38.4% in the same quarter last year. Rockwell Automation’s full-year margin has also been trending up over the past 12 months, increasing by 3.4 percentage points. If this move continues, it could suggest better unit economics due to more leverage from its growing sales on the fixed portion of its cost of goods sold (such as manufacturing expenses).
7. Operating Margin
Rockwell Automation has been a well-oiled machine over the last five years. It demonstrated elite profitability for an industrials business, boasting an average operating margin of 17.1%. This result isn’t surprising as its high gross margin gives it a favorable starting point.
Analyzing the trend in its profitability, Rockwell Automation’s operating margin rose by 1.7 percentage points over the last five years, as its sales growth gave it operating leverage.
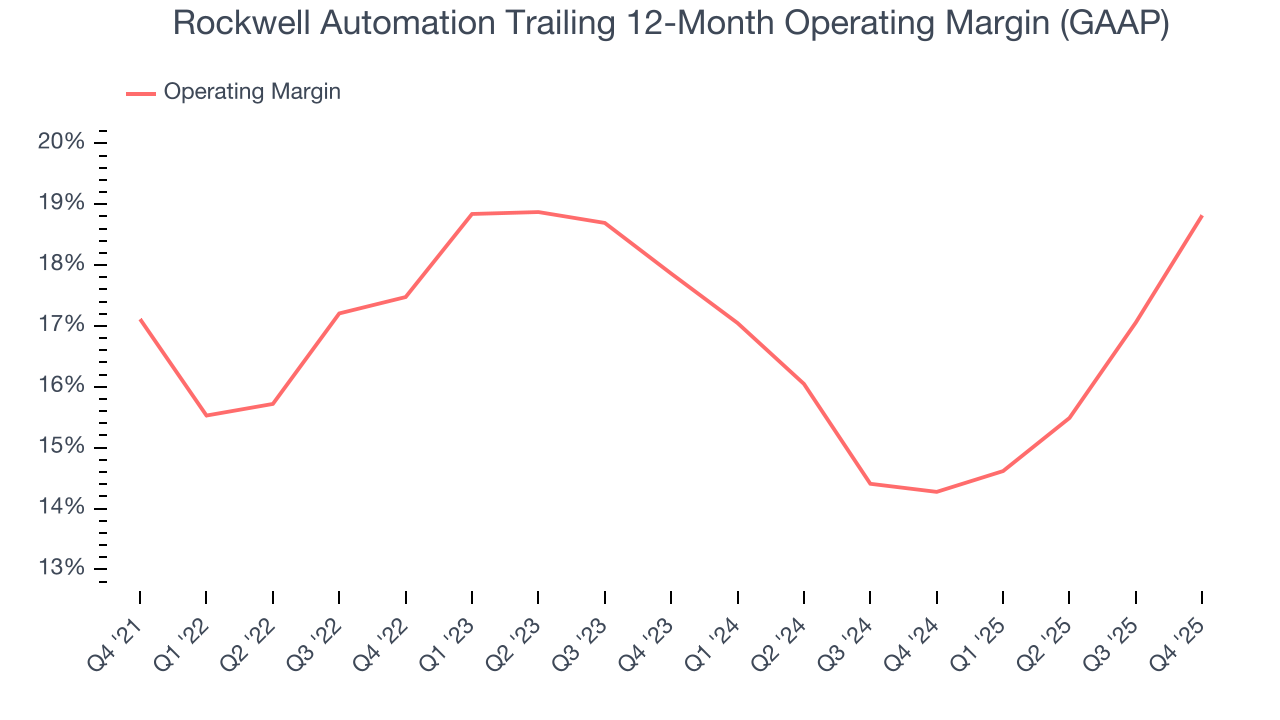
In Q4, Rockwell Automation generated an operating margin profit margin of 20.7%, up 7.6 percentage points year on year. The increase was driven by stronger leverage on its cost of sales (not higher efficiency with its operating expenses), as indicated by its larger rise in gross margin.
8. Earnings Per Share
Revenue trends explain a company’s historical growth, but the long-term change in earnings per share (EPS) points to the profitability of that growth – for example, a company could inflate its sales through excessive spending on advertising and promotions.
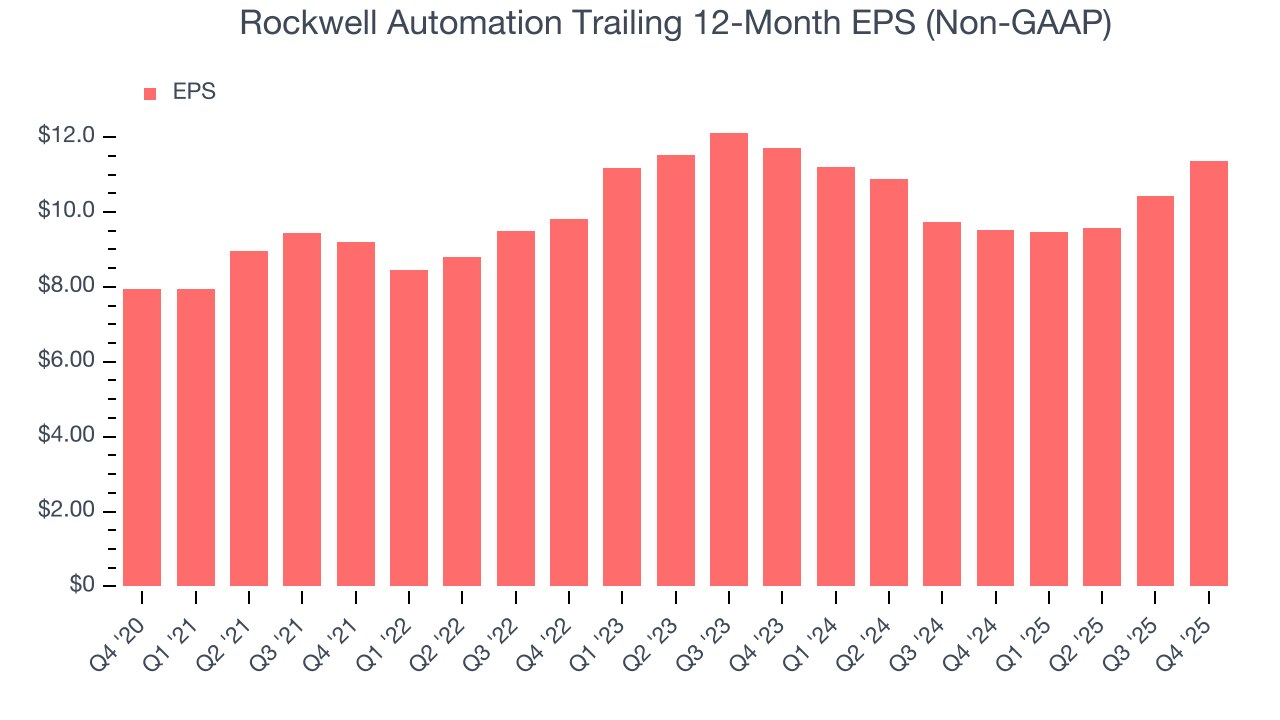
Rockwell Automation’s unimpressive 7.4% annual EPS growth over the last five years aligns with its revenue performance. On the bright side, this tells us its incremental sales were profitable.
Like with revenue, we analyze EPS over a shorter period to see if we are missing a change in the business.
For Rockwell Automation, its two-year annual EPS declines of 1.5% show it’s continued to underperform. These results were bad no matter how you slice the data.
In Q4, Rockwell Automation reported adjusted EPS of $2.75, up from $1.83 in the same quarter last year. This print easily cleared analysts’ estimates, and shareholders should be content with the results. Over the next 12 months, Wall Street expects Rockwell Automation’s full-year EPS of $11.36 to grow 9.2%.
9. Cash Is King
If you’ve followed StockStory for a while, you know we emphasize free cash flow. Why, you ask? We believe that in the end, cash is king, and you can’t use accounting profits to pay the bills.
Rockwell Automation has shown robust cash profitability, enabling it to comfortably ride out cyclical downturns while investing in plenty of new offerings and returning capital to investors. The company’s free cash flow margin averaged 11.9% over the last five years, quite impressive for an industrials business.
Taking a step back, we can see that Rockwell Automation’s margin expanded by 3.8 percentage points during that time. This shows the company is heading in the right direction, and we can see it became a less capital-intensive business because its free cash flow profitability rose more than its operating profitability.
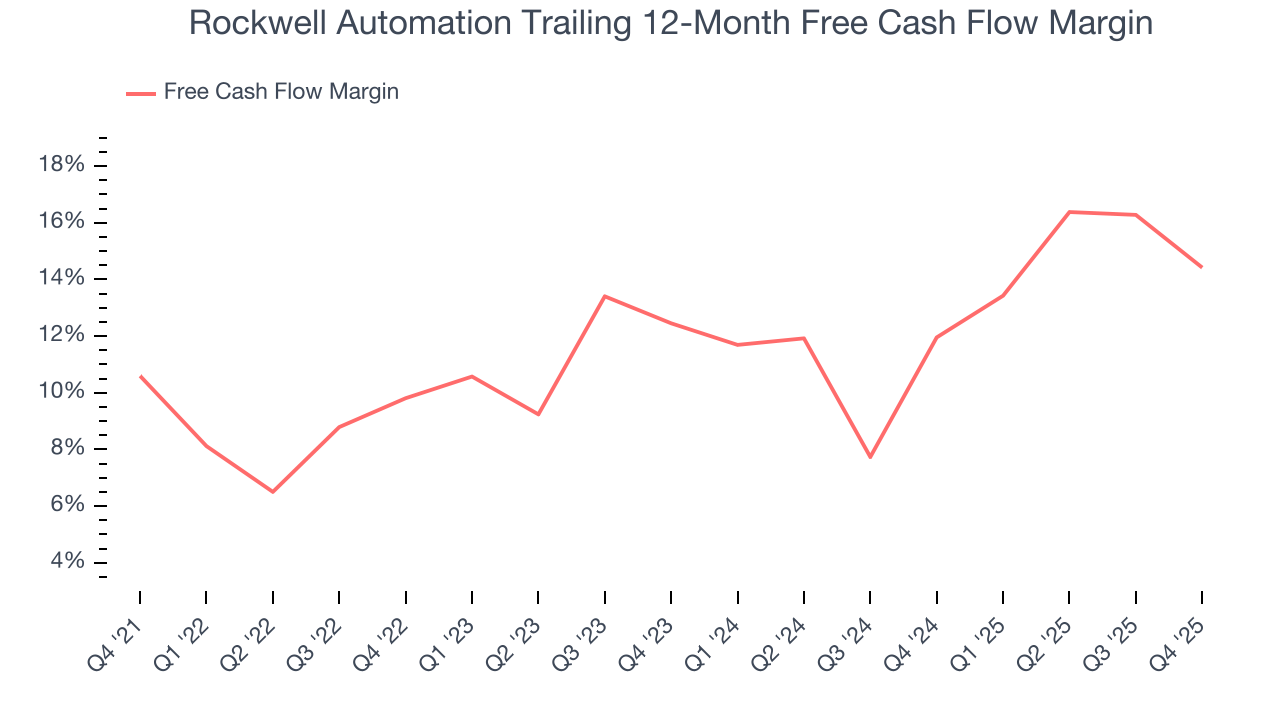
Rockwell Automation’s free cash flow clocked in at $170 million in Q4, equivalent to a 8.1% margin. The company’s cash profitability regressed as it was 7.5 percentage points lower than in the same quarter last year, prompting us to pay closer attention. Short-term fluctuations typically aren’t a big deal because investment needs can be seasonal, but we’ll be watching to see if the trend extrapolates into future quarters.
10. Return on Invested Capital (ROIC)
EPS and free cash flow tell us whether a company was profitable while growing its revenue. But was it capital-efficient? A company’s ROIC explains this by showing how much operating profit it makes compared to the money it has raised (debt and equity).
Although Rockwell Automation hasn’t been the highest-quality company lately, it found a few growth initiatives in the past that worked out wonderfully. Its five-year average ROIC was 20.3%, splendid for an industrials business.
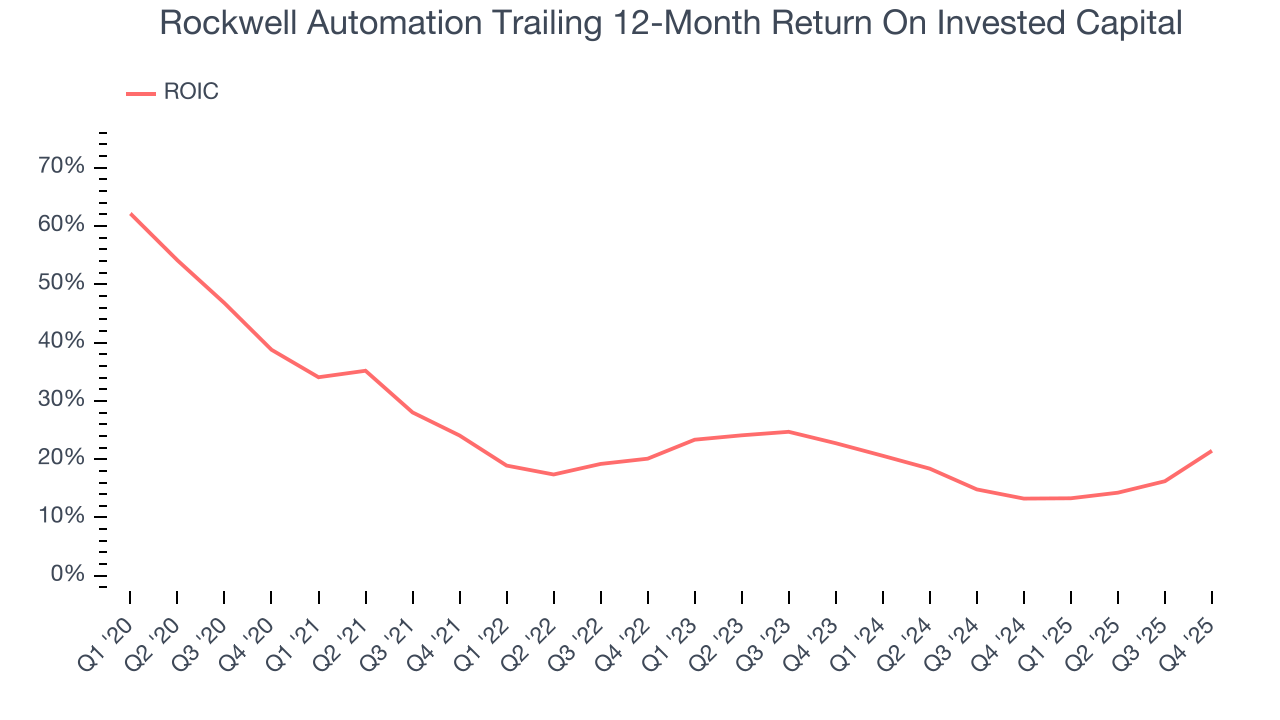
We like to invest in businesses with high returns, but the trend in a company’s ROIC is what often surprises the market and moves the stock price. Unfortunately, Rockwell Automation’s ROIC averaged 4.7 percentage point decreases over the last few years. We like what management has done in the past, but its declining returns are perhaps a symptom of fewer profitable growth opportunities.
11. Balance Sheet Assessment
Rockwell Automation reported $444 million of cash and $3.68 billion of debt on its balance sheet in the most recent quarter. As investors in high-quality companies, we primarily focus on two things: 1) that a company’s debt level isn’t too high and 2) that its interest payments are not excessively burdening the business.
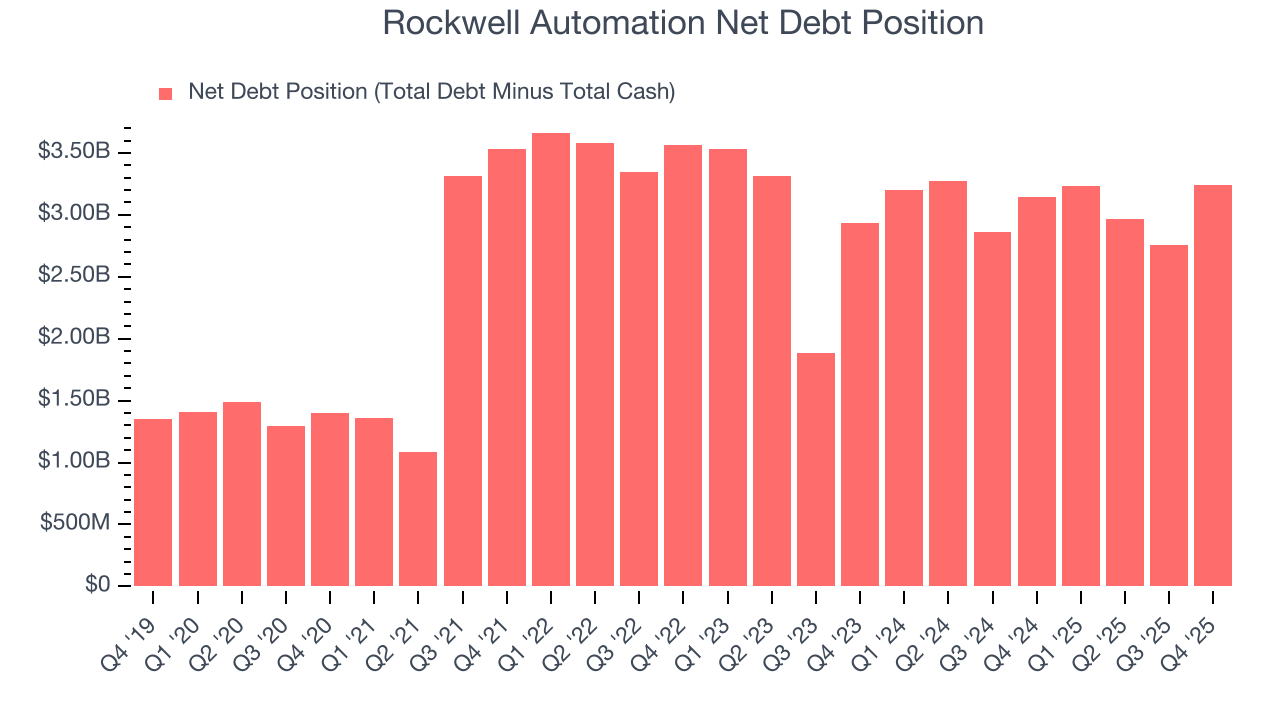
With $1.94 billion of EBITDA over the last 12 months, we view Rockwell Automation’s 1.7× net-debt-to-EBITDA ratio as safe. We also see its $76 million of annual interest expenses as appropriate. The company’s profits give it plenty of breathing room, allowing it to continue investing in growth initiatives.
12. Key Takeaways from Rockwell Automation’s Q4 Results
It was good to see Rockwell Automation narrowly top analysts’ organic revenue expectations this quarter. We were also glad its EPS outperformed Wall Street’s estimates. On the other hand, its full-year EPS guidance missed and its full-year revenue guidance fell slightly short of Wall Street’s estimates. Overall, this print was mixed but still had some key positives. The market seemed to be hoping for more, and the stock traded down 6.2% to $403.25 immediately following the results.
Correction note:
The previous version of this report incorrectly estimated adjusted EBITDA at $513 million. This version has been updated to reflect the correct figure of $447 million
13. Is Now The Time To Buy Rockwell Automation?
Updated: March 8, 2026 at 11:31 PM EDT
The latest quarterly earnings matters, sure, but we actually think longer-term fundamentals and valuation matter more. Investors should consider all these pieces before deciding whether or not to invest in Rockwell Automation.
Rockwell Automation’s business quality ultimately falls short of our standards. First off, its revenue growth was mediocre over the last five years, and analysts expect its demand to deteriorate over the next 12 months. While its stellar ROIC suggests it has been a well-run company historically, the downside is its diminishing returns show management's prior bets haven't worked out. On top of that, its organic revenue declined.
Rockwell Automation’s P/E ratio based on the next 12 months is 30.6x. At this valuation, there’s a lot of good news priced in - we think there are better stocks to buy right now.
Wall Street analysts have a consensus one-year price target of $428.66 on the company (compared to the current share price of $372.04).
Although the price target is bullish, readers should exercise caution because analysts tend to be overly optimistic. The firms they work for, often big banks, have relationships with companies that extend into fundraising, M&A advisory, and other rewarding business lines. As a result, they typically hesitate to say bad things for fear they will lose out. We at StockStory do not suffer from such conflicts of interest, so we’ll always tell it like it is.