
RXO (RXO)
We aren’t fans of RXO. It not only barely produces cash but also has been less efficient lately, as seen by its falling margins.― StockStory Analyst Team
1. News
2. Summary
Why We Think RXO Will Underperform
With access to millions of trucks, RXO (NYSE:RXO) offers full-truckload, less-than-truckload, and last-mile deliveries.
- Forecasted revenue decline of 2.5% for the upcoming 12 months implies demand will fall off a cliff
- Growth came at the expense of profits over the last five years as its substandard operating margin deteriorated even further
- On the plus side, its earnings per share have outperformed its peers over the last five years, increasing by 38.4% annually


RXO’s quality is lacking. We see more attractive opportunities in the market.
Why There Are Better Opportunities Than RXO


RXO’s stock price of $15.29 implies a valuation ratio of 35.8x forward EV-to-EBITDA. This valuation multiple seems a bit much considering the quality you get.
There are stocks out there similarly priced with better business quality. We prefer owning these.
3. RXO (RXO) Research Report: Q4 CY2025 Update
Freight Delivery Company RXO (NYSE:RXO) missed Wall Street’s revenue expectations in Q4 CY2025, with sales falling 11.9% year on year to $1.47 billion. Its non-GAAP loss of $0.07 per share was 67.7% below analysts’ consensus estimates.
RXO (RXO) Q4 CY2025 Highlights:
- Revenue: $1.47 billion vs analyst estimates of $1.48 billion (11.9% year-on-year decline, 0.7% miss)
- Adjusted EPS: -$0.07 vs analyst expectations of -$0.04 (67.7% miss)
- Adjusted EBITDA: $17 million vs analyst estimates of $18.68 million (1.2% margin, 9% miss)
- EBITDA guidance for Q1 CY2026 is $8.5 million at the midpoint, below analyst estimates of $12.67 million
- Operating Margin: -2.9%, down from -1.4% in the same quarter last year
- Free Cash Flow was -$9 million compared to -$19 million in the same quarter last year
- Sales Volumes fell 4% year on year (-6% in the same quarter last year)
- Market Capitalization: $2.72 billion
Company Overview
With access to millions of trucks, RXO (NYSE:RXO) offers full-truckload, less-than-truckload, and last-mile deliveries.
RXO originated as a spin-off from XPO, a transportation and logistics service company offering similar services, in 2022 to become an independent company offering freight delivery services.
RXO connects shippers with third-party carriers who own and operate vehicles to make full-truckload and less-than-truckload deliveries. Its full-truckload freight deliveries are made by dedicating an entire truck to a single customer’s shipment, adhering to specific needs like temperature control for perishable items. On the other hand, the company consolidates smaller shipments from multiple customers for its less-than-truckload deliveries. RXO coordinates the pickups, manages the logistics, and ensures that each shipment is delivered to its final destination.
The company’s last-mile delivery service focuses on transporting goods from distribution centers or warehouses directly to their final destinations. RXO coordinates the logistics of last mile delivery, managing everything from scheduling and route planning to final delivery confirmation. It does not actually make the deliveries, instead, it connects shippers with third-party carriers.
RXO engages in contracts that range from short-term agreements for specific shipments to long-term partnerships that span multiple years. Its pricing is based on the volume and frequency of shipments, often providing volume discounts to incentivize higher shipping volumes.
4. Ground Transportation
The growth of e-commerce and global trade continues to drive demand for shipping services, especially last-mile delivery, presenting opportunities for ground transportation companies. The industry continues to invest in data, analytics, and autonomous fleets to optimize efficiency and find the most cost-effective routes. Despite the essential services this industry provides, ground transportation companies are still at the whim of economic cycles. Consumer spending, for example, can greatly impact the demand for these companies’ offerings while fuel costs can influence profit margins.
Competitors offering similar products include C.H. Robinson (NASDAQ:CHRW), XPO (NYSE:XPO), and J.B. Hunt (NASDAQ:JBHT).
5. Revenue Growth
A company’s long-term sales performance is one signal of its overall quality. Any business can have short-term success, but a top-tier one grows for years. Over the last five years, RXO grew its sales at an impressive 11.3% compounded annual growth rate. Its growth beat the average industrials company and shows its offerings resonate with customers.
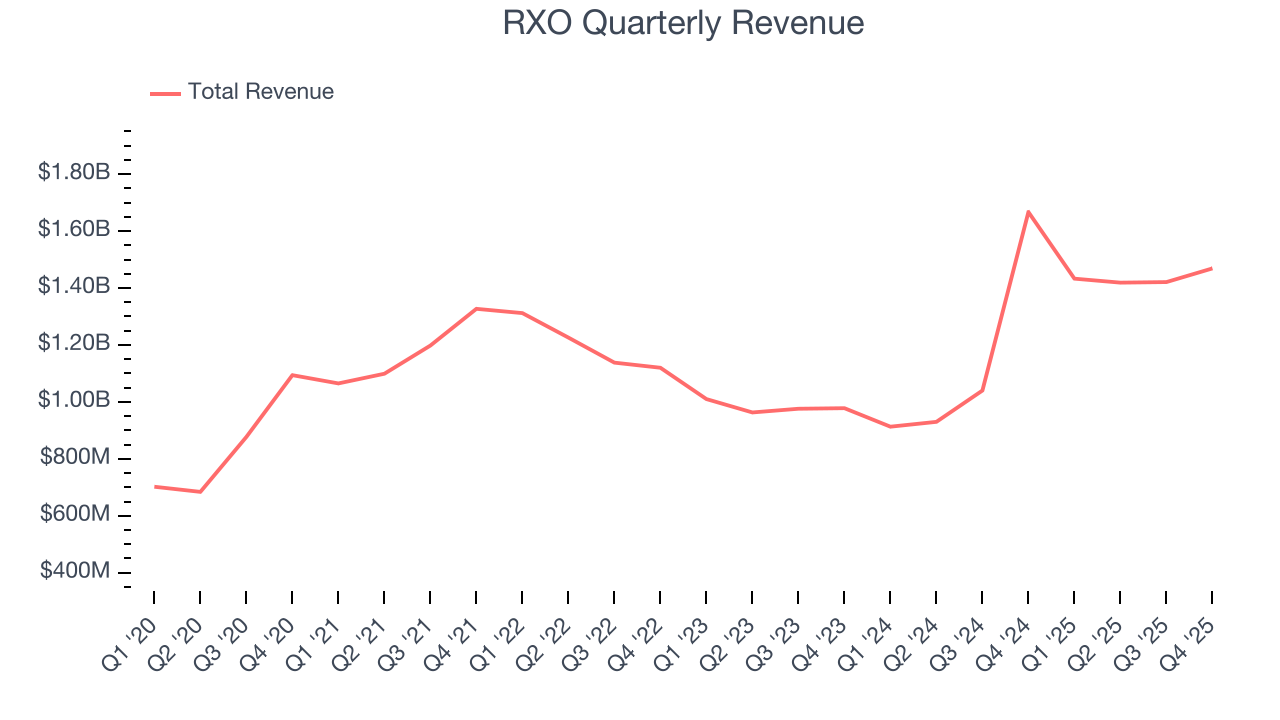
We at StockStory place the most emphasis on long-term growth, but within industrials, a half-decade historical view may miss cycles, industry trends, or a company capitalizing on catalysts such as a new contract win or a successful product line. RXO’s annualized revenue growth of 20.9% over the last two years is above its five-year trend, suggesting its demand was strong and recently accelerated. 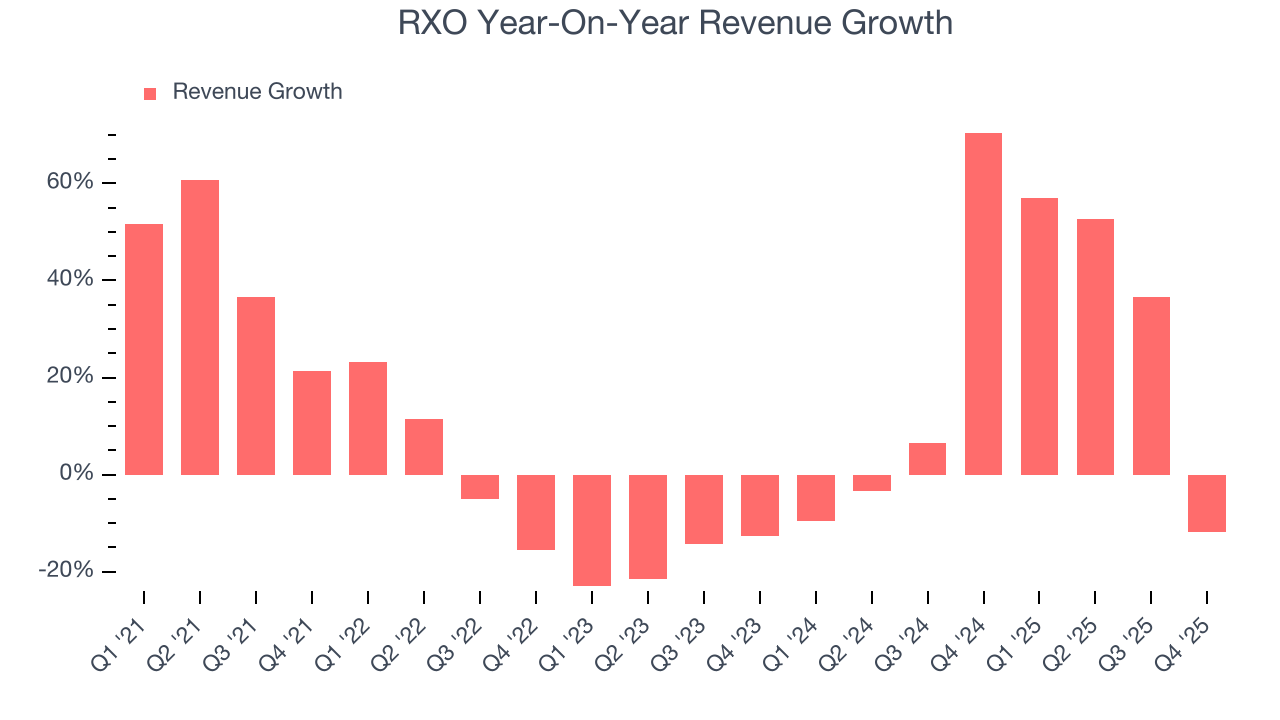
RXO also reports its number of units sold. Over the last two years, RXO’s units sold were flat. Because this number is lower than its revenue growth, we can see the company benefited from price increases. 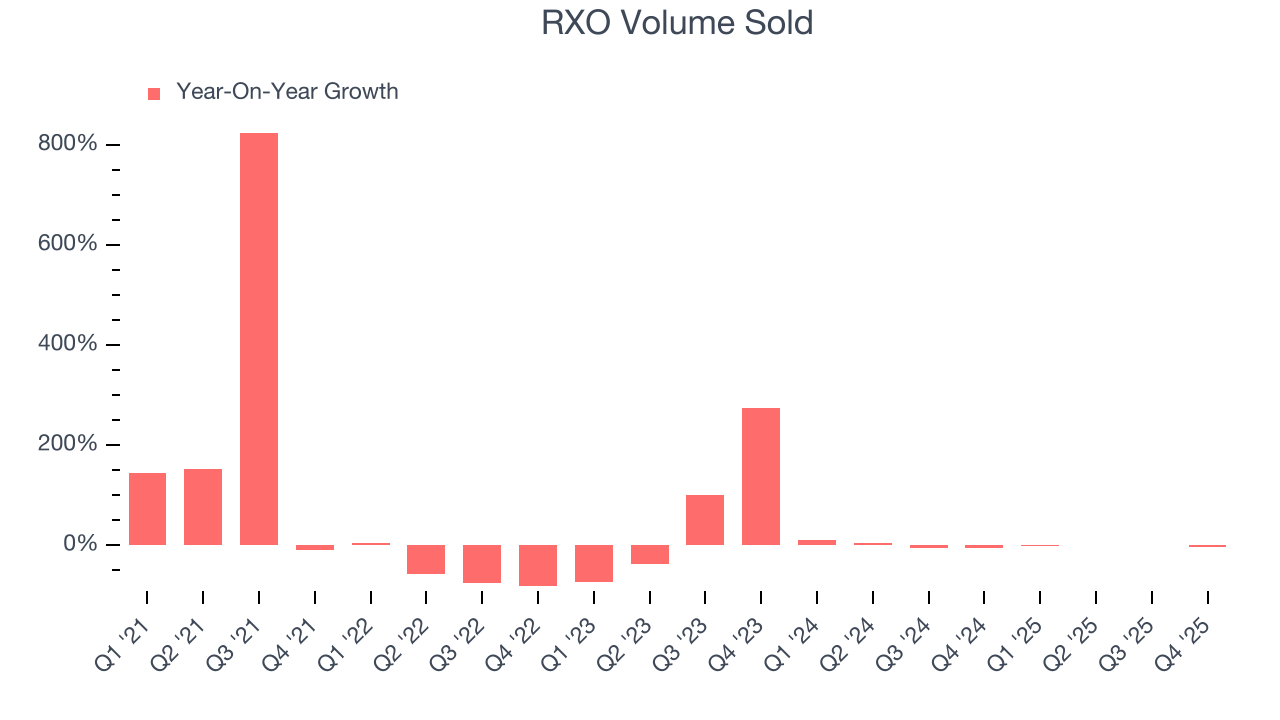
This quarter, RXO missed Wall Street’s estimates and reported a rather uninspiring 11.9% year-on-year revenue decline, generating $1.47 billion of revenue.
Looking ahead, sell-side analysts expect revenue to grow 2.7% over the next 12 months, a deceleration versus the last two years. This projection doesn't excite us and indicates its products and services will face some demand challenges.
6. Gross Margin & Pricing Power
Gross profit margin is a critical metric to track because it sheds light on its pricing power, complexity of products, and ability to procure raw materials, equipment, and labor.
RXO has bad unit economics for an industrials business, signaling it operates in a competitive market. As you can see below, it averaged a 17.8% gross margin over the last five years. Said differently, RXO had to pay a chunky $82.24 to its suppliers for every $100 in revenue. 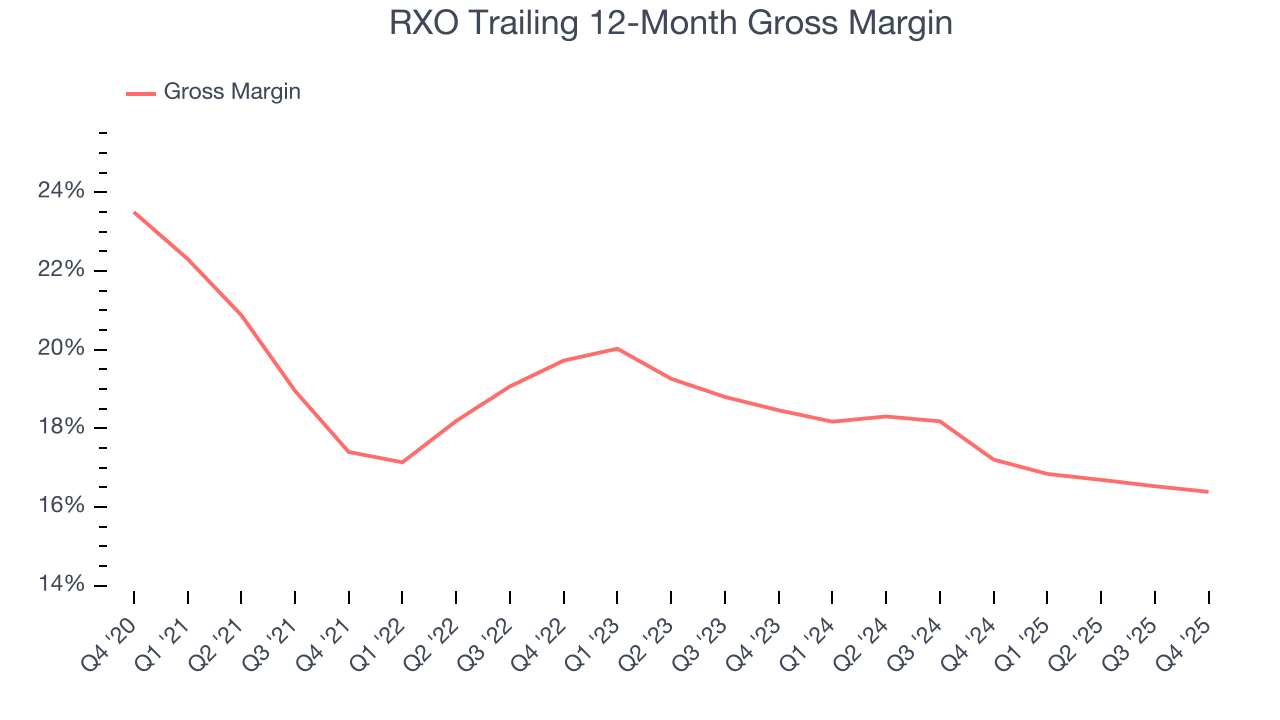
RXO’s gross profit margin came in at 14.9% this quarter, in line with the same quarter last year. On a wider time horizon, the company’s full-year margin has remained steady over the past four quarters, suggesting its input costs (such as raw materials and manufacturing expenses) have been stable and it isn’t under pressure to lower prices.
7. Operating Margin
Operating margin is a key measure of profitability. Think of it as net income - the bottom line - excluding the impact of taxes and interest on debt, which are less connected to business fundamentals.
RXO was roughly breakeven when averaging the last five years of quarterly operating profits, inadequate for an industrials business. This result isn’t too surprising given its low gross margin as a starting point.
Looking at the trend in its profitability, RXO’s operating margin decreased by 5.3 percentage points over the last five years. This raises questions about the company’s expense base because its revenue growth should have given it leverage on its fixed costs, resulting in better economies of scale and profitability. RXO’s performance was poor no matter how you look at it - it shows that costs were rising and it couldn’t pass them onto its customers.
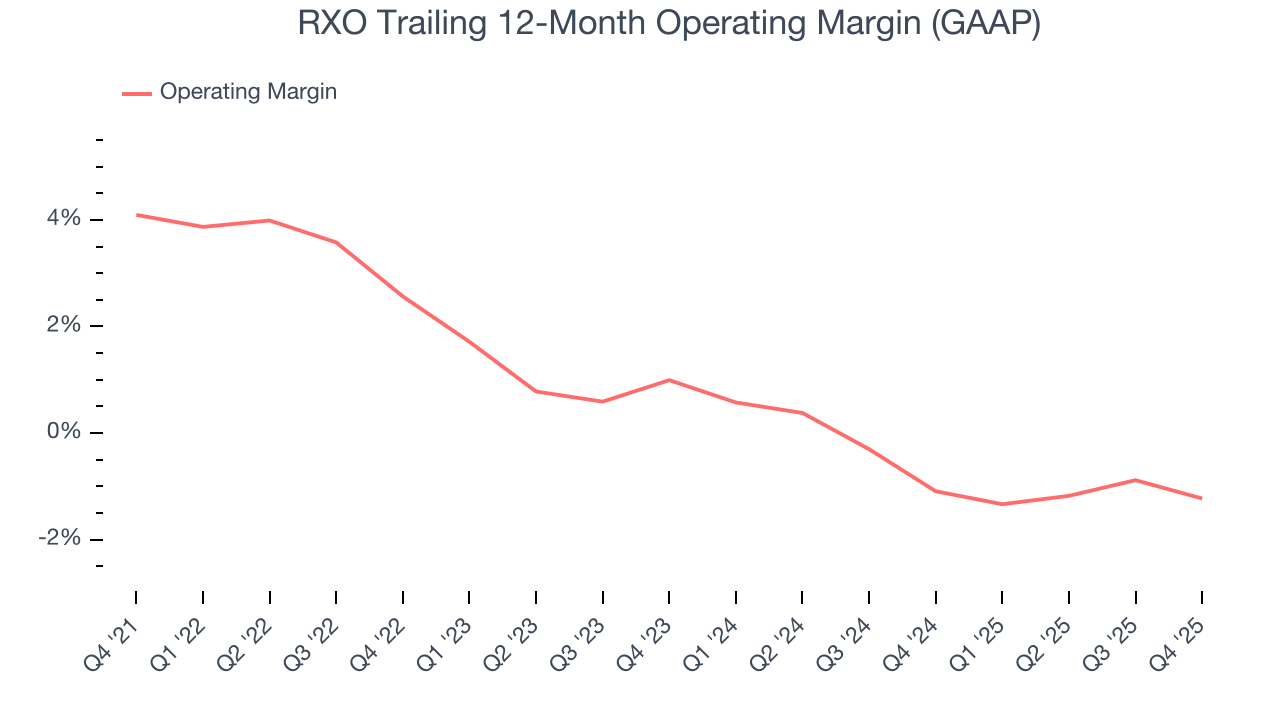
In Q4, RXO generated an operating margin profit margin of negative 2.9%, down 1.4 percentage points year on year. Since RXO’s operating margin decreased more than its gross margin, we can assume it was less efficient because expenses such as marketing, R&D, and administrative overhead increased.
8. Earnings Per Share
Revenue trends explain a company’s historical growth, but the long-term change in earnings per share (EPS) points to the profitability of that growth – for example, a company could inflate its sales through excessive spending on advertising and promotions.
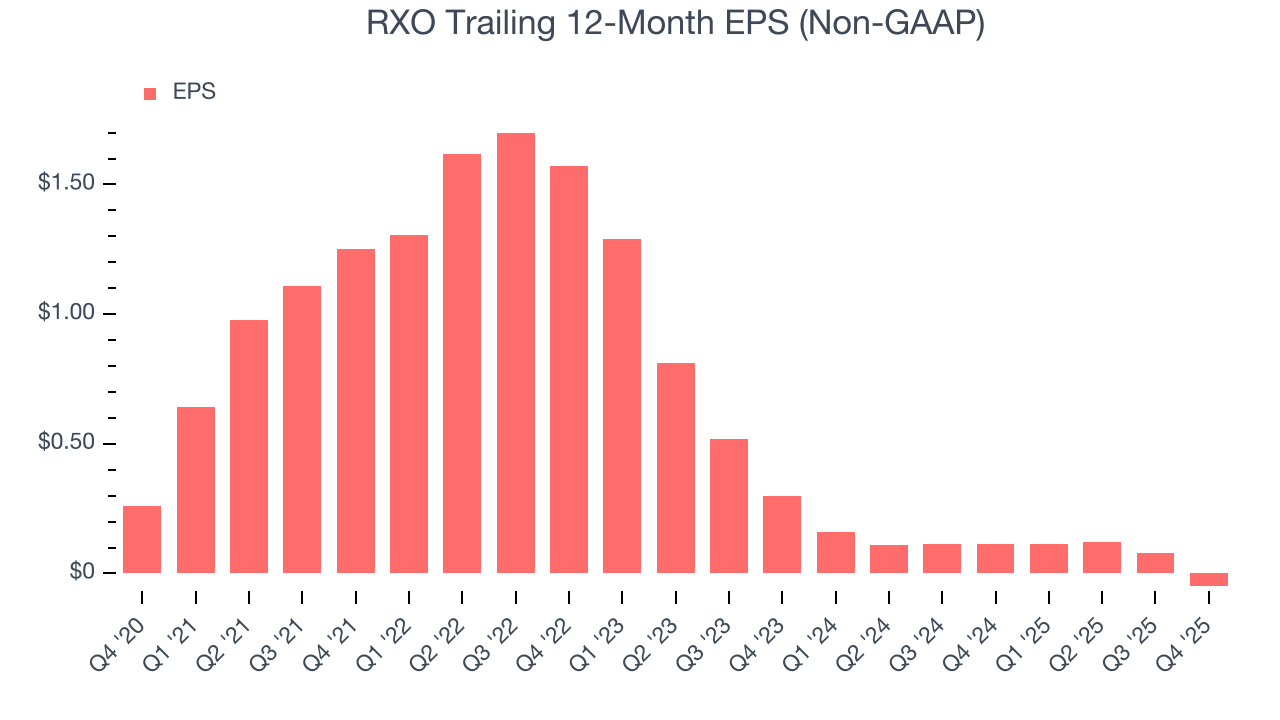
Sadly for RXO, its EPS declined by 17% annually over the last five years while its revenue grew by 11.3%. This tells us the company became less profitable on a per-share basis as it expanded.
Diving into the nuances of RXO’s earnings can give us a better understanding of its performance. As we mentioned earlier, RXO’s operating margin declined by 5.3 percentage points over the last five years. This was the most relevant factor (aside from the revenue impact) behind its lower earnings; interest expenses and taxes can also affect EPS but don’t tell us as much about a company’s fundamentals.
Like with revenue, we analyze EPS over a shorter period to see if we are missing a change in the business.
For RXO, its two-year annual EPS declines of 47.2% show it’s continued to underperform. These results were bad no matter how you slice the data.
In Q4, RXO reported adjusted EPS of negative $0.07, down from $0.06 in the same quarter last year. This print missed analysts’ estimates. Over the next 12 months, Wall Street is optimistic. Analysts forecast RXO’s full-year EPS of negative $0.05 will flip to positive $0.08.
9. Cash Is King
If you’ve followed StockStory for a while, you know we emphasize free cash flow. Why, you ask? We believe that in the end, cash is king, and you can’t use accounting profits to pay the bills.
RXO has shown poor cash profitability over the last five years, giving the company limited opportunities to return capital to shareholders. Its free cash flow margin averaged 1.4%, lousy for an industrials business.
Taking a step back, we can see that RXO’s margin dropped by 2.4 percentage points during that time. Almost any movement in the wrong direction is undesirable because of its already low cash conversion. If the trend continues, it could signal it’s in the middle of an investment cycle.
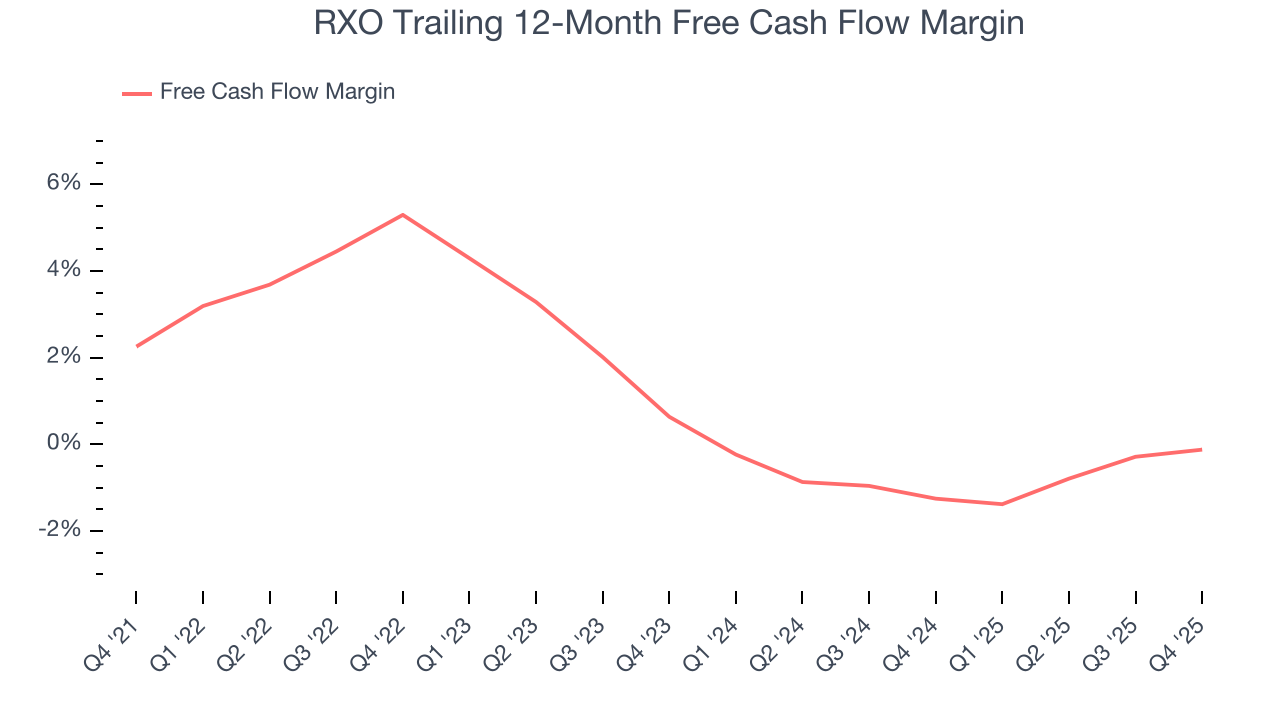
RXO broke even from a free cash flow perspective in Q4. This cash profitability was in line with the comparable period last year but below its five-year average. In a silo, this isn’t a big deal because investment needs can be seasonal, but we’ll be watching to see if the trend extrapolates into future quarters.
10. Return on Invested Capital (ROIC)
EPS and free cash flow tell us whether a company was profitable while growing its revenue. But was it capital-efficient? A company’s ROIC explains this by showing how much operating profit it makes compared to the money it has raised (debt and equity).
RXO historically did a mediocre job investing in profitable growth initiatives. Its four-year average ROIC was 6.2%, somewhat low compared to the best industrials companies that consistently pump out 20%+.
We like to invest in businesses with high returns, but the trend in a company’s ROIC is what often surprises the market and moves the stock price. Unfortunately, RXO’s ROIC has decreased significantly over the last few years. Paired with its already low returns, these declines suggest its profitable growth opportunities are few and far between.
11. Balance Sheet Risk
As long-term investors, the risk we care about most is the permanent loss of capital, which can happen when a company goes bankrupt or raises money from a disadvantaged position. This is separate from short-term stock price volatility, something we are much less bothered by.
RXO’s $670 million of debt exceeds the $17 million of cash on its balance sheet. Furthermore, its 6× net-debt-to-EBITDA ratio (based on its EBITDA of $109 million over the last 12 months) shows the company is overleveraged.
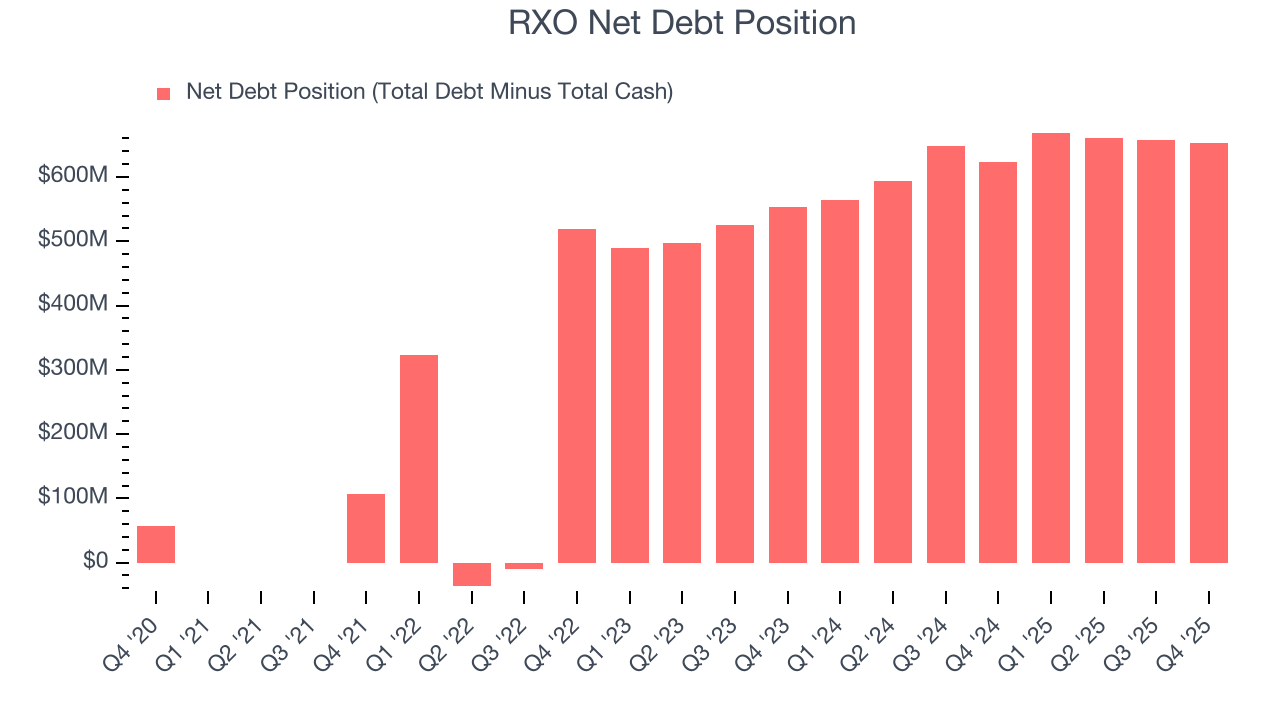
At this level of debt, incremental borrowing becomes increasingly expensive and credit agencies could downgrade the company’s rating if profitability falls. RXO could also be backed into a corner if the market turns unexpectedly – a situation we seek to avoid as investors in high-quality companies.
We hope RXO can improve its balance sheet and remain cautious until it increases its profitability or pays down its debt.
12. Key Takeaways from RXO’s Q4 Results
We struggled to find many positives in these results. Its EBITDA missed and its EPS fell short of Wall Street’s estimates. Overall, this was a weaker quarter. The stock traded down 9% to $15.09 immediately following the results.
13. Is Now The Time To Buy RXO?
When considering an investment in RXO, investors should account for its valuation and business qualities as well as what’s happened in the latest quarter.
RXO doesn’t pass our quality test. Although its revenue growth was impressive over the last five years, it’s expected to deteriorate over the next 12 months and its diminishing returns show management's prior bets haven't worked out. And while the company’s projected EPS for the next year implies the company’s fundamentals will improve, the downside is its declining EPS over the last five years makes it a less attractive asset to the public markets.
RXO’s P/E ratio based on the next 12 months is 219.3x. At this valuation, there’s a lot of good news priced in - we think there are better stocks to buy right now.
Wall Street analysts have a consensus one-year price target of $15.44 on the company (compared to the current share price of $15.09).