
Somnigroup (SGI)
Somnigroup is up against the odds. Its sales have underperformed and its low returns on capital show it has few growth opportunities.― StockStory Analyst Team
1. News


2. Summary
Why We Think Somnigroup Will Underperform
Established through the merger of Tempur-Pedic and Sealy in 2012, Somnigroup (NYSE:SGI) is a bedding manufacturer known for its innovative memory foam mattresses and sleep products
- Annual revenue growth of 15.3% over the last five years was below our standards for the consumer discretionary sector
- Annual earnings per share growth of 7.1% underperformed its revenue over the last five years, showing its incremental sales were less profitable
- Subpar operating margin constrains its ability to invest in process improvements or effectively respond to new competitive threats


Somnigroup doesn’t fulfill our quality requirements. Better stocks can be found in the market.
Why There Are Better Opportunities Than Somnigroup


Somnigroup’s stock price of $73.86 implies a valuation ratio of 22.7x forward P/E. Not only does Somnigroup trade at a premium to companies in the consumer discretionary space, but this multiple is also high for its top-line growth.
There are stocks out there featuring similar valuation multiples with better fundamentals. We prefer to invest in those.
3. Somnigroup (SGI) Research Report: Q4 CY2025 Update
Bedding manufacturer Somnigroup (NYSE:SGI) fell short of the market’s revenue expectations in Q4 CY2025, but sales rose 54.7% year on year to $1.87 billion. Its non-GAAP profit of $0.72 per share was in line with analysts’ consensus estimates.
Somnigroup (SGI) Q4 CY2025 Highlights:
- Revenue: $1.87 billion vs analyst estimates of $1.93 billion (54.7% year-on-year growth, 3.2% miss)
- Adjusted EPS: $0.72 vs analyst estimates of $0.72 (in line)
- Adjusted EBITDA: $348.5 million vs analyst estimates of $351.6 million (18.7% margin, 0.9% miss)
- Adjusted EPS guidance for the upcoming financial year 2026 is $3.20 at the midpoint, missing analyst estimates by 3.9%
- Operating Margin: 13.2%, up from 10.6% in the same quarter last year
- Free Cash Flow Margin: 2.2%, down from 9% in the same quarter last year
- Market Capitalization: $20.16 billion
Company Overview
Established through the merger of Tempur-Pedic and Sealy in 2012, Somnigroup (NYSE:SGI) is a bedding manufacturer known for its innovative memory foam mattresses and sleep products
This company offers a wide range of mattresses, adjustable bases, pillows, and other sleep and relaxation products. As one of the largest bedding manufacturers in the world, Somnigroup has a presence in over 80 countries, with its products sold through various channels including third-party retailers, company-owned stores, and direct-to-consumer online platforms.
At the core of Tempur Sealy’s Tempur-Pedic product line is its innovative TEMPUR material, a proprietary, pressure-relieving memory foam. The TEMPUR material, originally developed by NASA to cushion astronauts during lift-off, provides exceptional support and comfort, adapting to the user’s body shape, weight, and temperature.
Sealy, on the other hand, is known for its innerspring mattresses. These products use spring coils, cooling technology, and hybrid foam/spring designs. The Tempur-Pedic and Sealy brands synergize to cater to a wide range of customer preferences.
4. Consumer Discretionary - Home Furnishings
The Consumer Discretionary sector, by definition, is made up of companies selling non-essential goods and services. When economic conditions deteriorate or tastes shift, consumers can easily cut back or eliminate these purchases. For long-term investors with five-year holding periods, this creates a structural challenge: the sector is inherently hit-driven, with low switching costs and fickle customers. As a result, only a handful of companies can reliably grow demand and compound earnings over long periods, which is why our bar is high and High Quality ratings are rare.
Home furnishings companies design, manufacture, and sell furniture, décor, bedding, and related household products for residential and commercial spaces. Tailwinds include e-commerce expansion enabling broader distribution, continued remote-work trends sustaining home improvement interest, and premiumization as consumers invest in living spaces. However, headwinds are considerable: demand is closely tied to housing market activity, and rising mortgage rates have slowed home sales—a key purchase trigger. Bulky products carry high shipping costs and complex logistics. Intense competition from low-cost imports and mass-market retailers compresses margins, while consumer spending on furnishings is among the first categories deferred during economic downturns.
Somnigroup's primary competitors include Sleep Number (NASDAQ:SNBR), Purple (NASDAQ:PRPL), and private company Casper Sleep.
5. Revenue Growth
A company’s long-term performance is an indicator of its overall quality. Any business can put up a good quarter or two, but many enduring ones grow for years. Over the last five years, Somnigroup grew its sales at a 15.3% compounded annual growth rate. Though this growth is acceptable on an absolute basis, we need to see more than just topline growth for the consumer discretionary sector, which can display significant earnings volatility. This means our bar for the sector is particularly high, reflecting the non-essential and hit-driven nature of the products and services offered. Additionally, five-year CAGR starts around Covid, when revenue was depressed then rebounded.
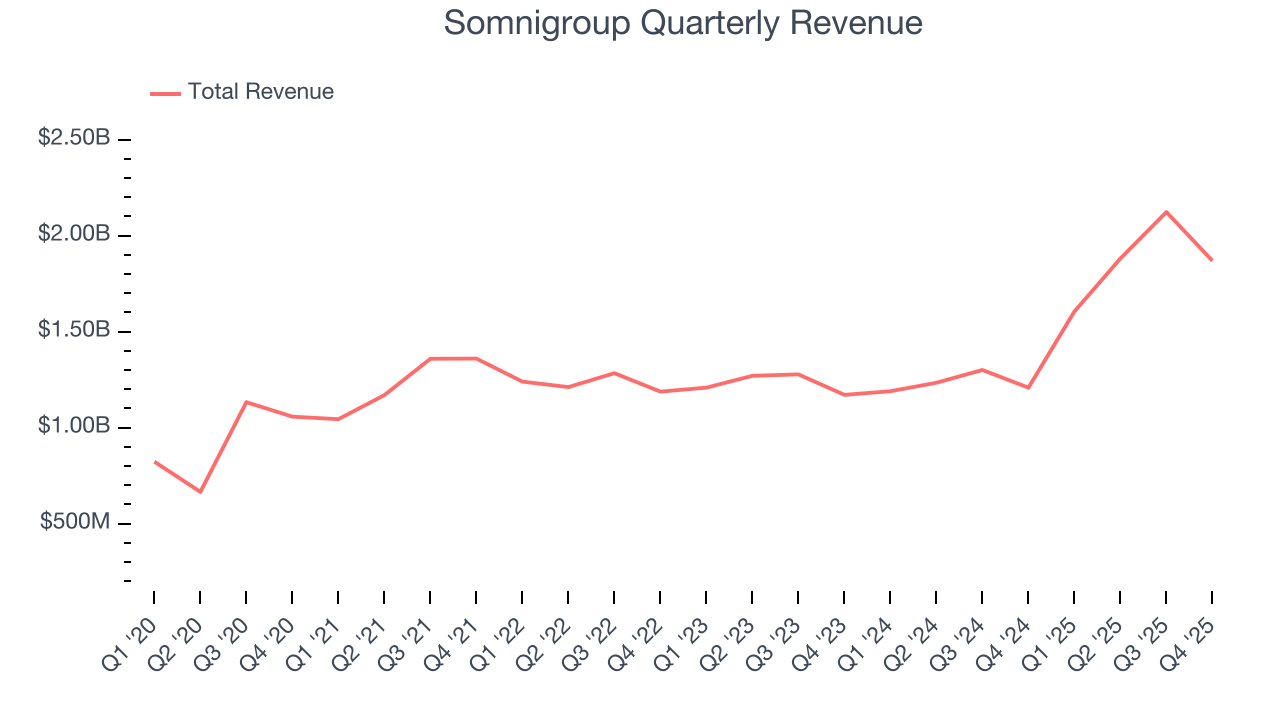
Long-term growth is the most important, but within consumer discretionary, product cycles are short and revenue can be hit-driven due to rapidly changing trends and consumer preferences. Somnigroup’s annualized revenue growth of 23.2% over the last two years is above its five-year trend, which is encouraging. 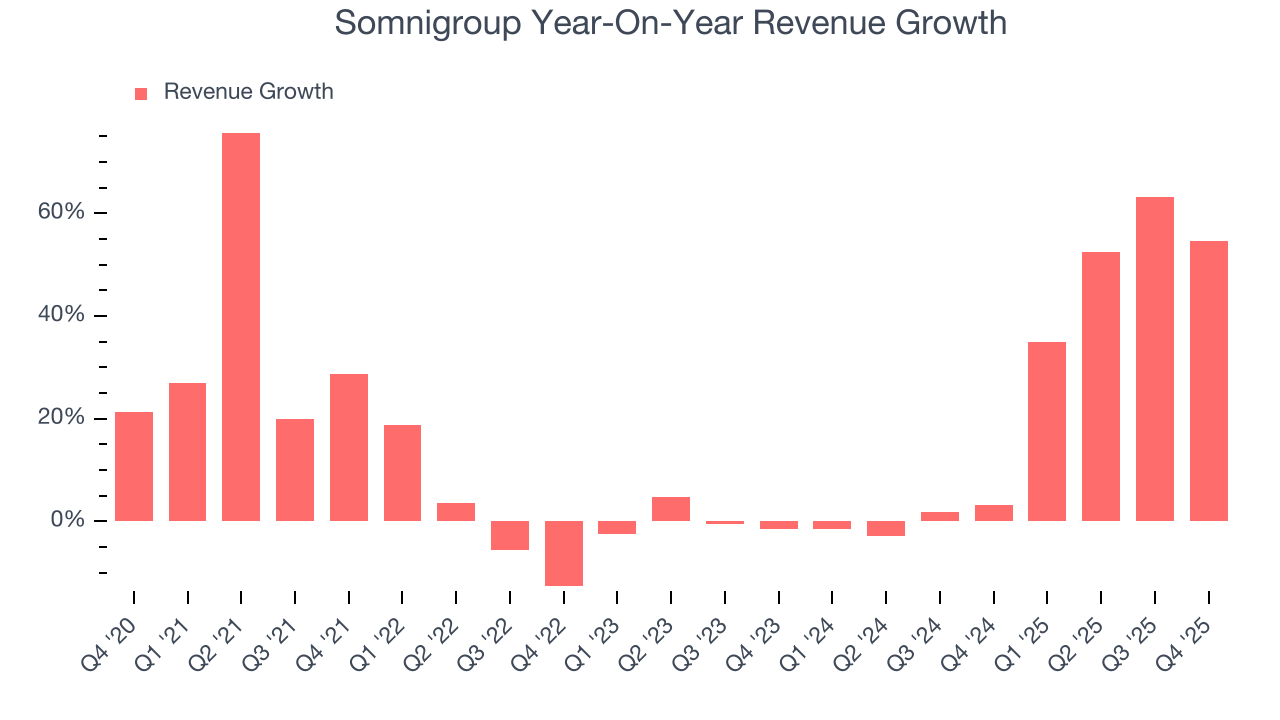
Somnigroup also breaks out the revenue for its most important segments, Wholesale and Direct, which are 34.8% and 65.2% of revenue. Over the last two years, Somnigroup’s Wholesale revenue (sales to retailers) averaged 17.1% year-on-year declines. On the other hand, its Direct revenue (sales made directly to consumers) averaged 193% growth. 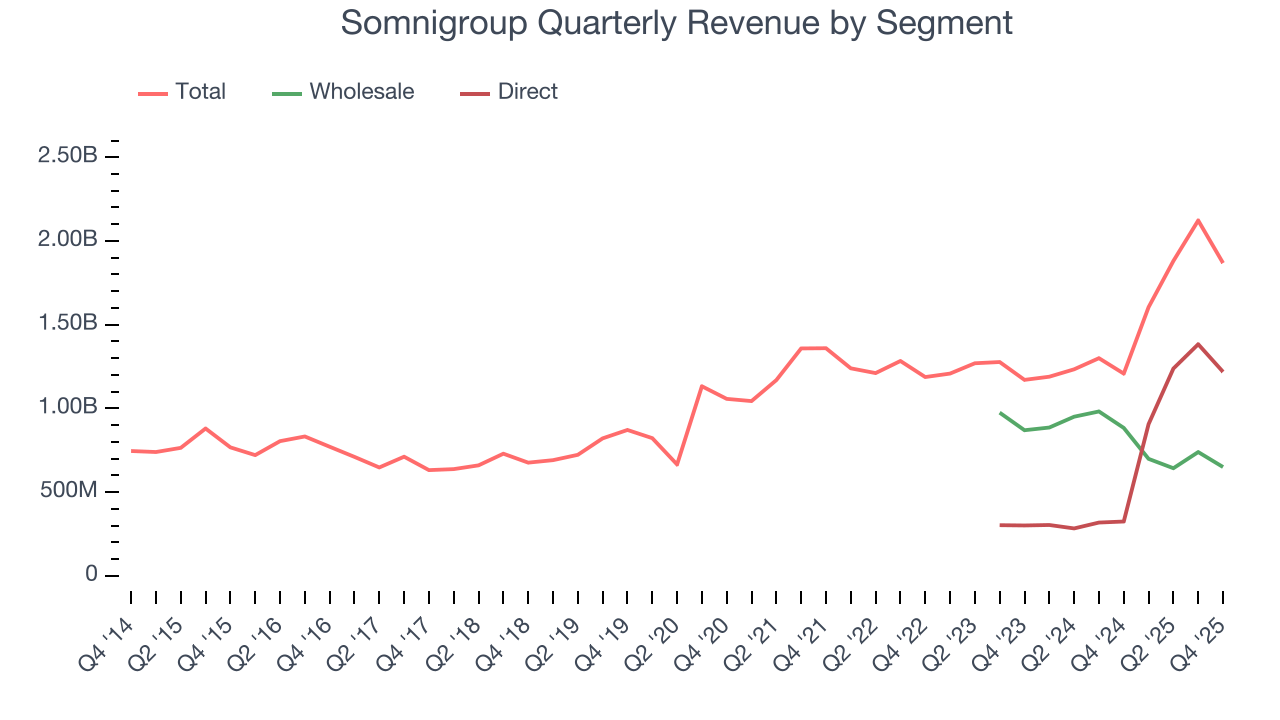
This quarter, Somnigroup achieved a magnificent 54.7% year-on-year revenue growth rate, but its $1.87 billion of revenue fell short of Wall Street’s lofty estimates.
Looking ahead, sell-side analysts expect revenue to grow 7.8% over the next 12 months, a deceleration versus the last two years. This projection doesn't excite us and implies its products and services will face some demand challenges.
6. Operating Margin
Somnigroup’s operating margin has shrunk over the last 12 months and averaged 11.2% over the last two years. The company’s profitability was mediocre for a consumer discretionary business and shows it couldn’t pass its higher operating expenses onto its customers.
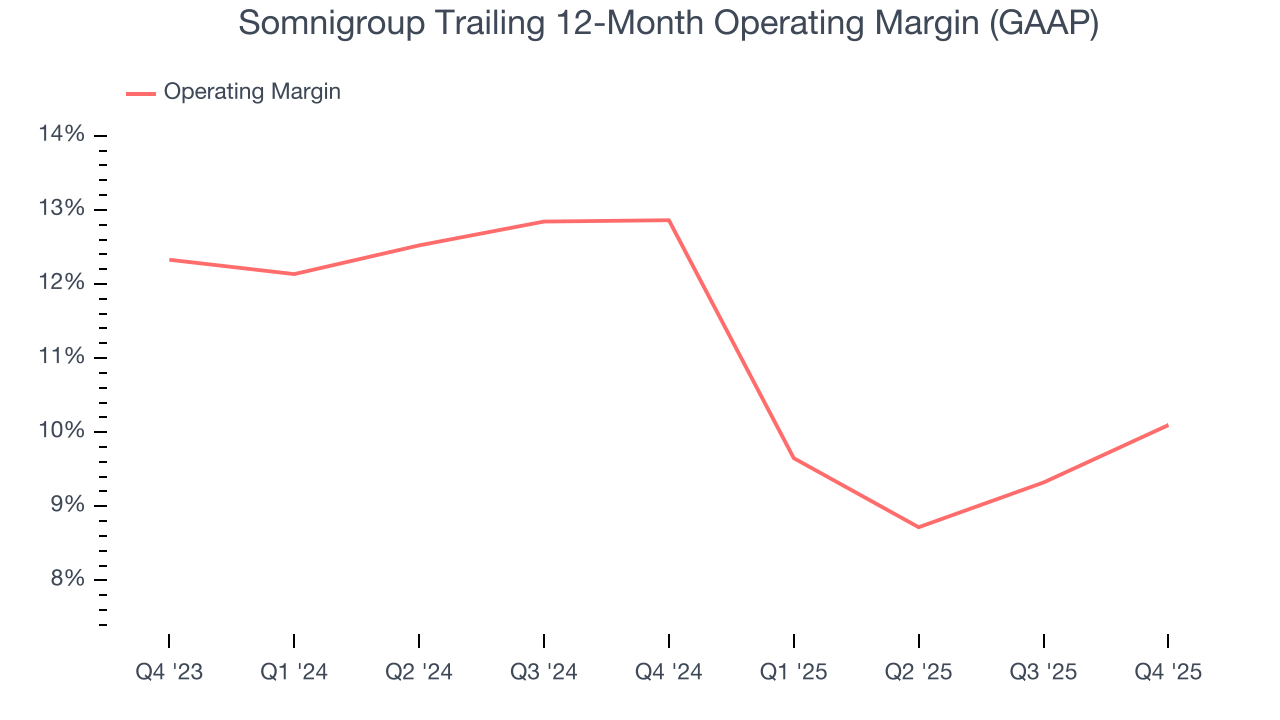
This quarter, Somnigroup generated an operating margin profit margin of 13.2%, up 2.7 percentage points year on year. This increase was a welcome development and shows it was more efficient.
7. Earnings Per Share
We track the long-term change in earnings per share (EPS) for the same reason as long-term revenue growth. Compared to revenue, however, EPS highlights whether a company’s growth is profitable.
Somnigroup’s EPS grew at a weak 7.1% compounded annual growth rate over the last five years, lower than its 15.3% annualized revenue growth. This tells us the company became less profitable on a per-share basis as it expanded.
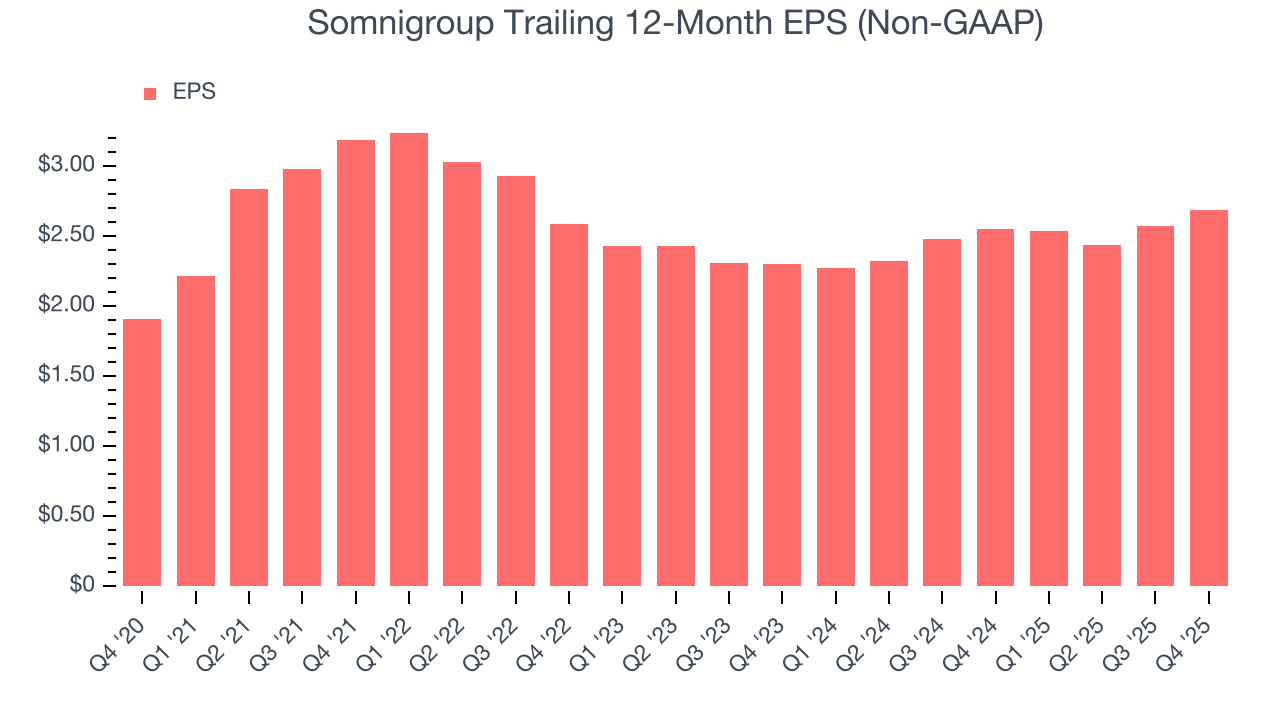
In Q4, Somnigroup reported adjusted EPS of $0.72, up from $0.60 in the same quarter last year. This print was close to analysts’ estimates. Over the next 12 months, Wall Street expects Somnigroup’s full-year EPS of $2.69 to grow 23%.
8. Cash Is King
Free cash flow isn't a prominently featured metric in company financials and earnings releases, but we think it's telling because it accounts for all operating and capital expenses, making it tough to manipulate. Cash is king.
Somnigroup has shown poor cash profitability over the last two years, giving the company limited opportunities to return capital to shareholders. Its free cash flow margin averaged 9.7%, lousy for a consumer discretionary business.
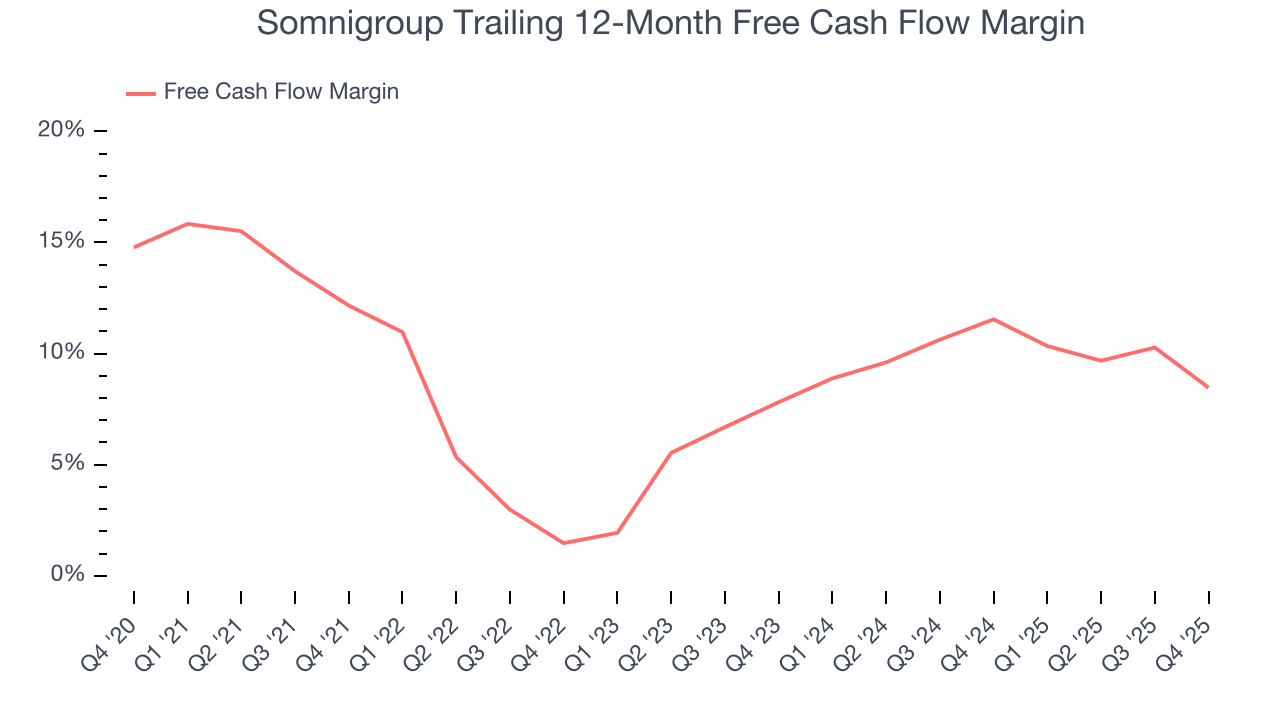
Somnigroup’s free cash flow clocked in at $41.1 million in Q4, equivalent to a 2.2% margin. The company’s cash profitability regressed as it was 6.8 percentage points lower than in the same quarter last year, prompting us to pay closer attention. Short-term fluctuations typically aren’t a big deal because investment needs can be seasonal, but we’ll be watching to see if the trend extrapolates into future quarters.
Over the next year, analysts predict Somnigroup’s cash conversion will slightly improve. Their consensus estimates imply its free cash flow margin of 8.5% for the last 12 months will increase to 10.4%, giving it more flexibility for investments, share buybacks, and dividends.
9. Return on Invested Capital (ROIC)
EPS and free cash flow tell us whether a company was profitable while growing its revenue. But was it capital-efficient? A company’s ROIC explains this by showing how much operating profit it makes compared to the money it has raised (debt and equity).
Somnigroup historically did a mediocre job investing in profitable growth initiatives. Its five-year average ROIC was 16.3%, somewhat low compared to the best consumer discretionary companies that consistently pump out 25%+.
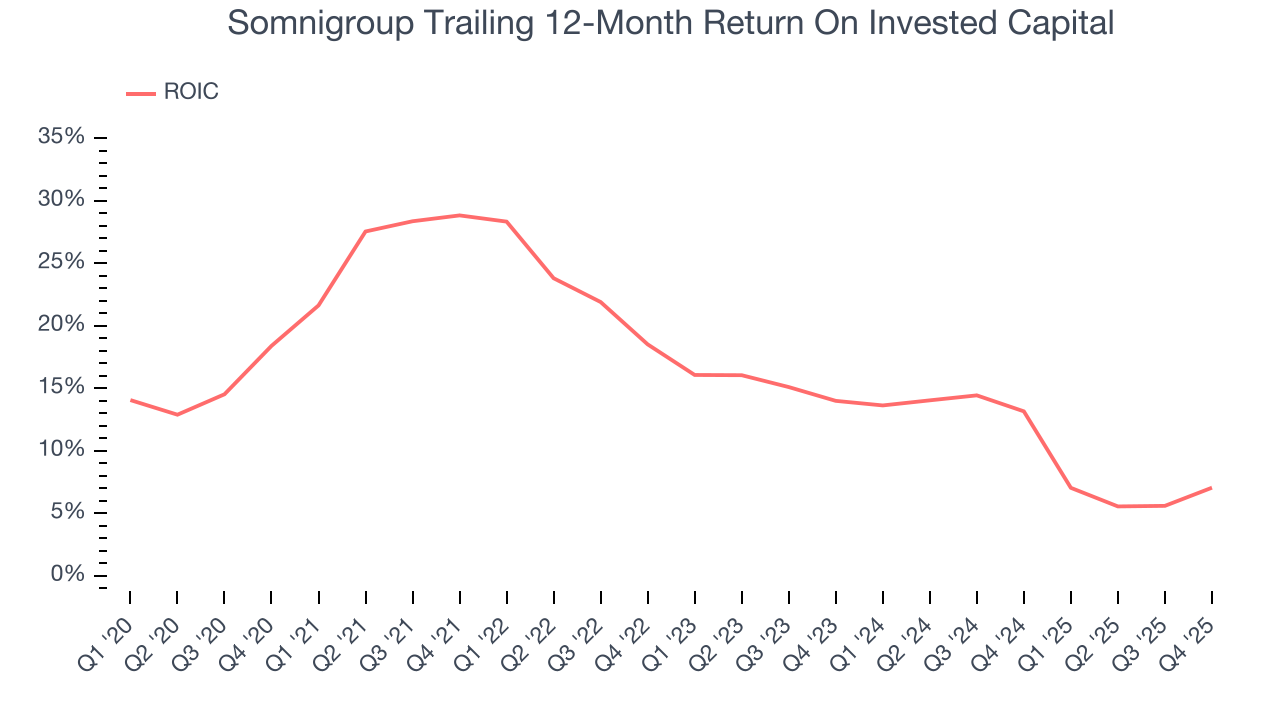
We like to invest in businesses with high returns, but the trend in a company’s ROIC is what often surprises the market and moves the stock price. Over the last few years, Somnigroup’s ROIC has unfortunately decreased significantly. Paired with its already low returns, these declines suggest its profitable growth opportunities are few and far between.
10. Balance Sheet Risk
As long-term investors, the risk we care about most is the permanent loss of capital, which can happen when a company goes bankrupt or raises money from a disadvantaged position. This is separate from short-term stock price volatility, something we are much less bothered by.
Somnigroup’s $6.68 billion of debt exceeds the $134.9 million of cash on its balance sheet. Furthermore, its 5× net-debt-to-EBITDA ratio (based on its EBITDA of $1.31 billion over the last 12 months) shows the company is overleveraged.
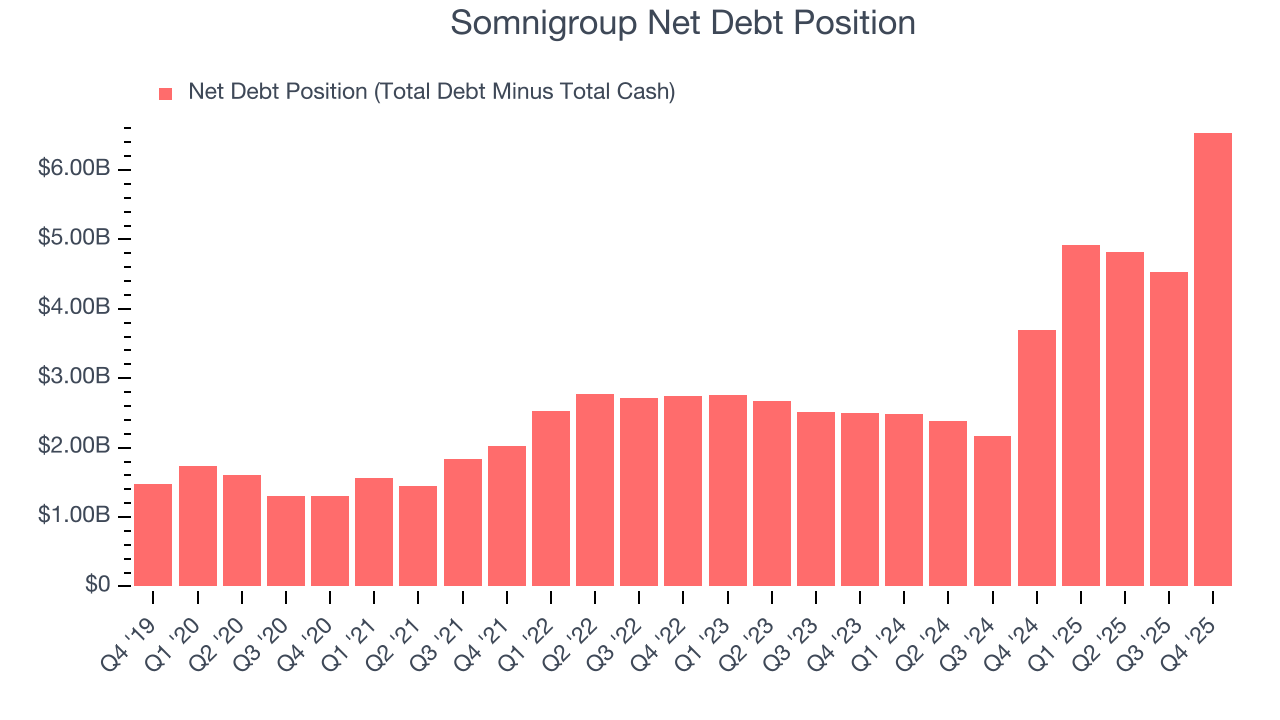
At this level of debt, incremental borrowing becomes increasingly expensive and credit agencies could downgrade the company’s rating if profitability falls. Somnigroup could also be backed into a corner if the market turns unexpectedly – a situation we seek to avoid as investors in high-quality companies.
We hope Somnigroup can improve its balance sheet and remain cautious until it increases its profitability or pays down its debt.
11. Key Takeaways from Somnigroup’s Q4 Results
We struggled to find many positives in these results. Its revenue missed and its full-year EPS guidance fell short of Wall Street’s estimates. Overall, this was a softer quarter. The stock remained flat at $95.74 immediately following the results.
12. Is Now The Time To Buy Somnigroup?
Updated: March 27, 2026 at 10:55 PM EDT
Before deciding whether to buy Somnigroup or pass, we urge investors to consider business quality, valuation, and the latest quarterly results.
Somnigroup falls short of our quality standards. On top of that, Somnigroup’s Forecasted free cash flow margin for next year suggests the company will fail to improve its cash conversion, and its weak EPS growth over the last five years shows it’s failed to produce meaningful profits for shareholders.
Somnigroup’s P/E ratio based on the next 12 months is 22.5x. This multiple tells us a lot of good news is priced in - we think other companies feature superior fundamentals at the moment.
Wall Street analysts have a consensus one-year price target of $103.38 on the company (compared to the current share price of $70.84).
Although the price target is bullish, readers should exercise caution because analysts tend to be overly optimistic. The firms they work for, often big banks, have relationships with companies that extend into fundraising, M&A advisory, and other rewarding business lines. As a result, they typically hesitate to say bad things for fear they will lose out. We at StockStory do not suffer from such conflicts of interest, so we’ll always tell it like it is.