
Sherwin-Williams (SHW)
We’re wary of Sherwin-Williams. Its growth has been lacking and its free cash flow margin has caved, suggesting it’s struggling to adapt.― StockStory Analyst Team
1. News


2. Summary
Why We Think Sherwin-Williams Will Underperform
Widely known for its success in the paint industry, Sherwin-Williams (NYSE:SHW) is a manufacturer of paints, coatings, and related products.
- Absence of organic revenue growth over the past two years suggests it may have to lean into acquisitions to drive its expansion
- Projected sales growth of 5% for the next 12 months suggests sluggish demand
- A silver lining is that its offerings are difficult to replicate at scale and lead to a best-in-class gross margin of 45.8%


Sherwin-Williams doesn’t meet our quality standards. We’re hunting for superior stocks elsewhere.
Why There Are Better Opportunities Than Sherwin-Williams


Sherwin-Williams’s stock price of $348.44 implies a valuation ratio of 29.2x forward P/E. This multiple is higher than that of industrials peers; it’s also rich for the top-line growth of the company. Not a great combination.
There are stocks out there similarly priced with better business quality. We prefer owning these.
3. Sherwin-Williams (SHW) Research Report: Q3 CY2025 Update
Paint and coating manufacturer Sherwin-Williams (NYSE:SHW) announced better-than-expected revenue in Q3 CY2025, with sales up 3.2% year on year to $6.36 billion. The company expects next quarter’s revenue to be around $5.43 billion, close to analysts’ estimates. Its non-GAAP profit of $3.59 per share was 4.4% above analysts’ consensus estimates.
Sherwin-Williams (SHW) Q3 CY2025 Highlights:
- Revenue: $6.36 billion vs analyst estimates of $6.2 billion (3.2% year-on-year growth, 2.6% beat)
- Adjusted EPS: $3.59 vs analyst estimates of $3.44 (4.4% beat)
- Adjusted EBITDA: $1.36 billion vs analyst estimates of $1.33 billion (21.4% margin, 2.2% beat)
- Revenue Guidance for Q4 CY2025 is $5.43 billion at the midpoint, roughly in line with what analysts were expecting
- Management reiterated its full-year Adjusted EPS guidance of $11.35 at the midpoint
- Operating Margin: 18.4%, in line with the same quarter last year
- Market Capitalization: $83.56 billion
Company Overview
Widely known for its success in the paint industry, Sherwin-Williams (NYSE:SHW) is a manufacturer of paints, coatings, and related products.
Sherwin-Williams began its journey as a small partnership selling raw materials to paint manufacturers. Over the years, it transformed into a globally recognized manufacturer of coatings and related products. The company expanded its market presence and product lines through numerous acquisitions, one of the most significant being the acquisition of Valspar in March 2016, for $11.3 billion. The merger integrated Valspar’s extensive offerings into Sherwin-Williams's portfolio, enhancing its presence in architectural paint and industrial coatings.
Today, Sherwin-Williams offers a comprehensive range of paint, coatings, and related products tailored to a variety of markets, from residential DIY enthusiasts to industrial professionals across the globe. The company operates specialty paint stores under its Paint Stores Group in North America and the Caribbean, catering primarily to architectural and industrial paint contractors. These stores distribute Sherwin-Williams and other controlled brands, including architectural paints, coatings, protective and marine products, and OEM product finishes. The company also sells advanced industrial coatings used in a variety of applications from wood finishing to automotive refinish and marine coatings worldwide.
Sherwin-Williams generates revenue through a multifaceted approach that includes sales from its own retail stores, direct sales to large-scale projects, and distribution through third-party retailers and distributors. Its stores serve as a primary sales channel, offering a wide range of products directly to consumers. Beyond retail, the company extends its reach into commercial and industrial markets by partnering with third-party vendors, which helps distribute specialized products for professional use. Additionally, Sherwin-Williams secures steady revenue streams through contracts and partnerships for large-scale industrial sales and government projects, further broadening its market presence.
The company typically experiences the majority of its sales during the second and third quarters, aligning with the warmer months when painting and construction activities are most prevalent. To prepare for this peak season, the company builds its inventories in the first quarter to meet the heightened demand.
4. Building Materials
Traditionally, building materials companies have built competitive advantages with economies of scale, brand recognition, and strong relationships with builders and contractors. More recently, advances to address labor availability and job site productivity have spurred innovation. Additionally, companies in the space that can produce more energy-efficient materials have opportunities to take share. However, these companies are at the whim of construction volumes, which tend to be cyclical and can be impacted heavily by economic factors such as interest rates. Additionally, the costs of raw materials can be driven by a myriad of worldwide factors and greatly influence the profitability of building materials companies.
Competitors offering similar products include PPG Industries (NYSE:PPG), RPM International (NYSE:RPM), and Axalta Coating Systems (NYSE:AXTA).
5. Revenue Growth
Examining a company’s long-term performance can provide clues about its quality. Any business can experience short-term success, but top-performing ones enjoy sustained growth for years. Over the last five years, Sherwin-Williams grew its sales at a tepid 5.3% compounded annual growth rate. This fell short of our benchmark for the industrials sector and is a tough starting point for our analysis.
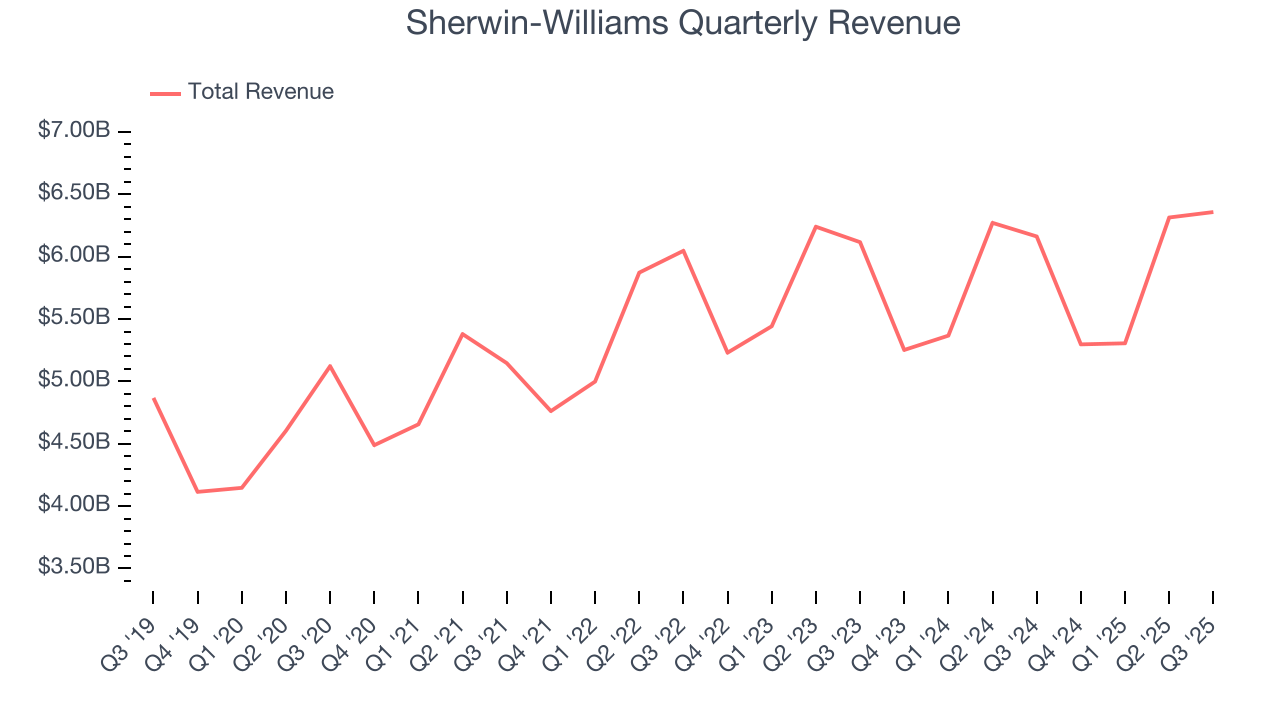
We at StockStory place the most emphasis on long-term growth, but within industrials, a half-decade historical view may miss cycles, industry trends, or a company capitalizing on catalysts such as a new contract win or a successful product line. Sherwin-Williams’s recent performance shows its demand has slowed as its revenue was flat over the last two years. 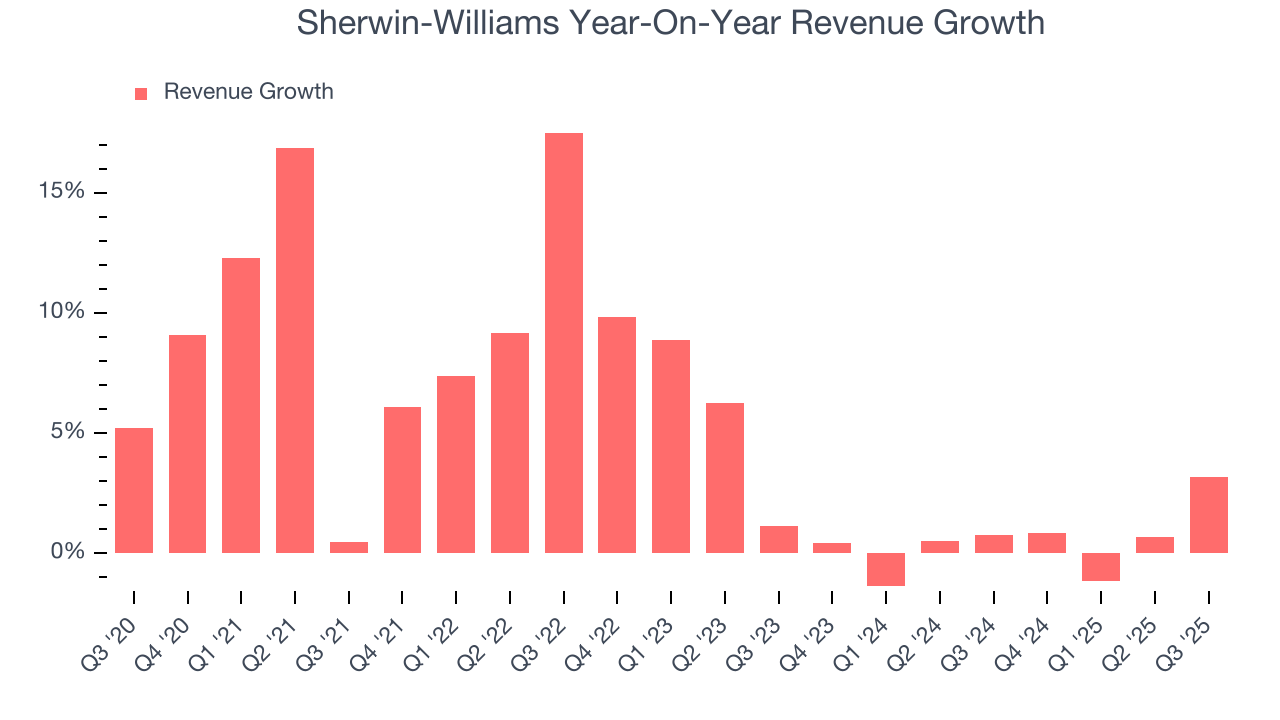
This quarter, Sherwin-Williams reported modest year-on-year revenue growth of 3.2% but beat Wall Street’s estimates by 2.6%. Company management is currently guiding for a 2.5% year-on-year increase in sales next quarter.
Looking further ahead, sell-side analysts expect revenue to grow 3.1% over the next 12 months. Although this projection indicates its newer products and services will fuel better top-line performance, it is still below average for the sector.
6. Gross Margin & Pricing Power
Sherwin-Williams has best-in-class unit economics for an industrials company, enabling it to invest in areas such as research and development. Its margin also signals it sells differentiated products, not commodities. As you can see below, it averaged an elite 45.8% gross margin over the last five years. Said differently, roughly $45.84 was left to spend on selling, marketing, R&D, and general administrative overhead for every $100 in revenue. 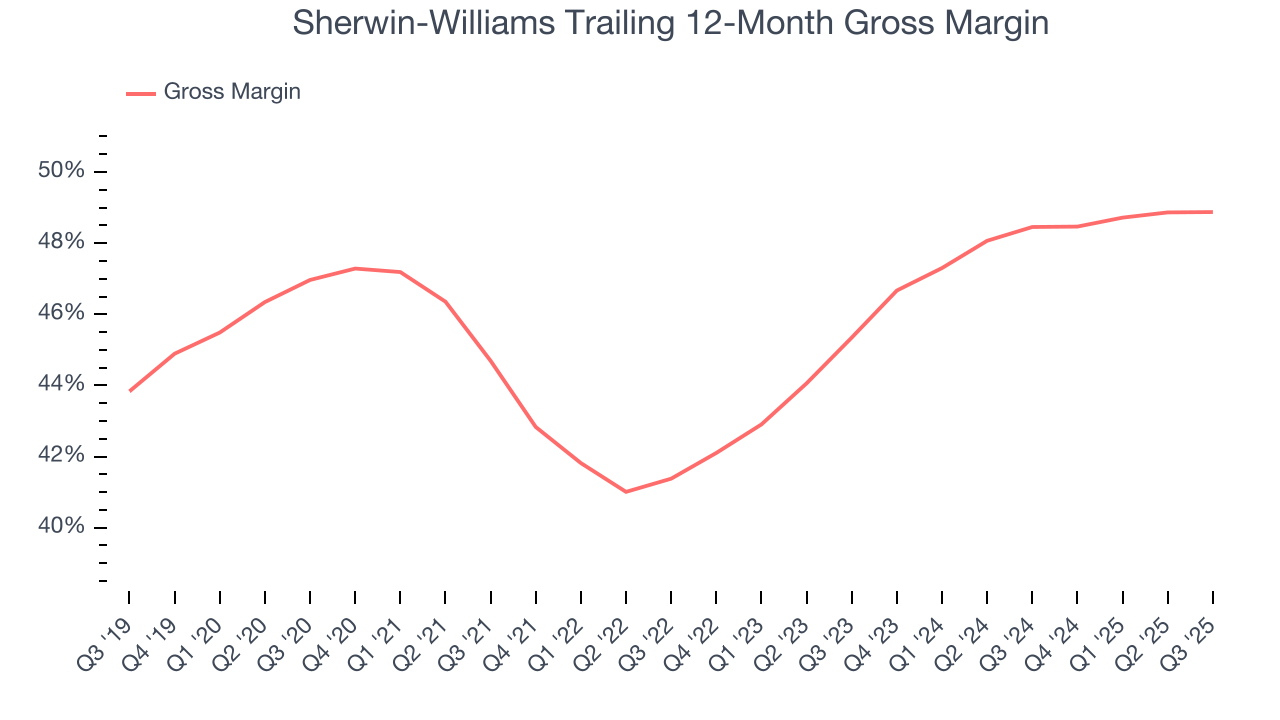
This quarter, Sherwin-Williams’s gross profit margin was 49.2%, in line with the same quarter last year. On a wider time horizon, the company’s full-year margin has remained steady over the past four quarters, suggesting its input costs (such as raw materials and manufacturing expenses) have been stable and it isn’t under pressure to lower prices.
7. Operating Margin
Operating margin is one of the best measures of profitability because it tells us how much money a company takes home after procuring and manufacturing its products, marketing and selling those products, and most importantly, keeping them relevant through research and development.
Sherwin-Williams has been an efficient company over the last five years. It was one of the more profitable businesses in the industrials sector, boasting an average operating margin of 14.9%. This result isn’t surprising as its high gross margin gives it a favorable starting point.
Looking at the trend in its profitability, Sherwin-Williams’s operating margin rose by 2.1 percentage points over the last five years, as its sales growth gave it operating leverage.
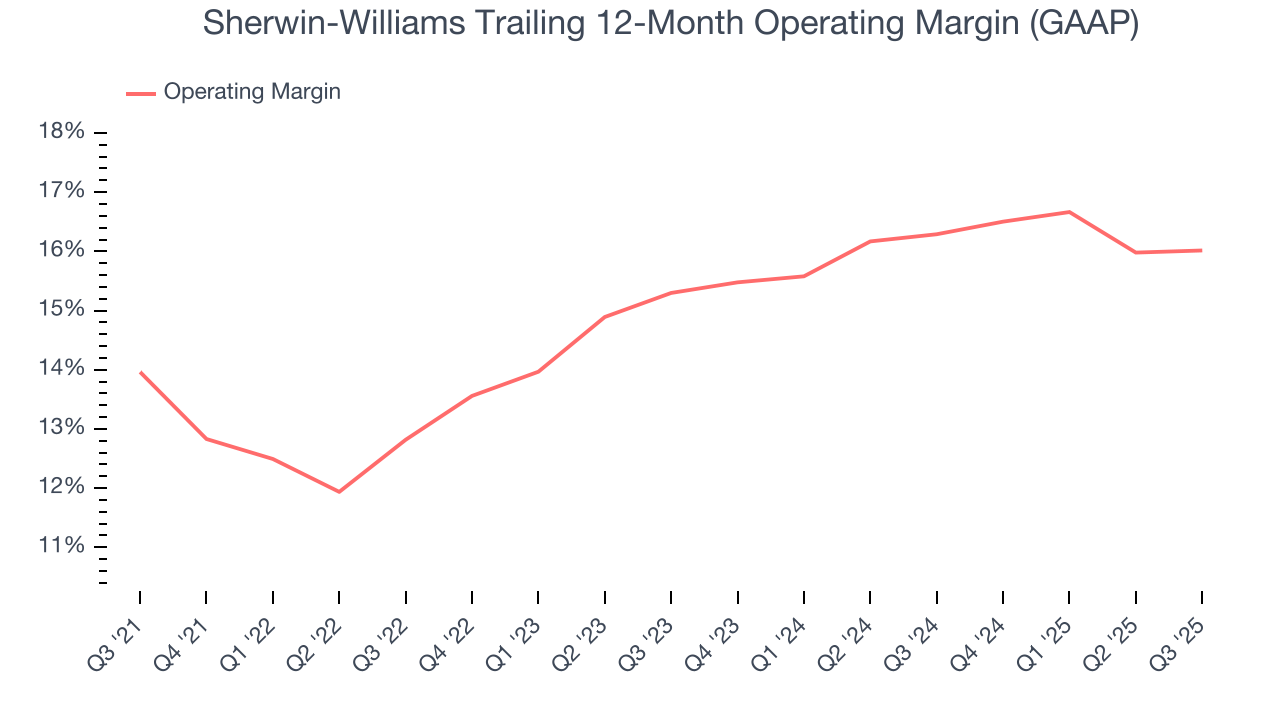
In Q3, Sherwin-Williams generated an operating margin profit margin of 18.4%, in line with the same quarter last year. This indicates the company’s cost structure has recently been stable.
8. Earnings Per Share
Revenue trends explain a company’s historical growth, but the long-term change in earnings per share (EPS) points to the profitability of that growth – for example, a company could inflate its sales through excessive spending on advertising and promotions.
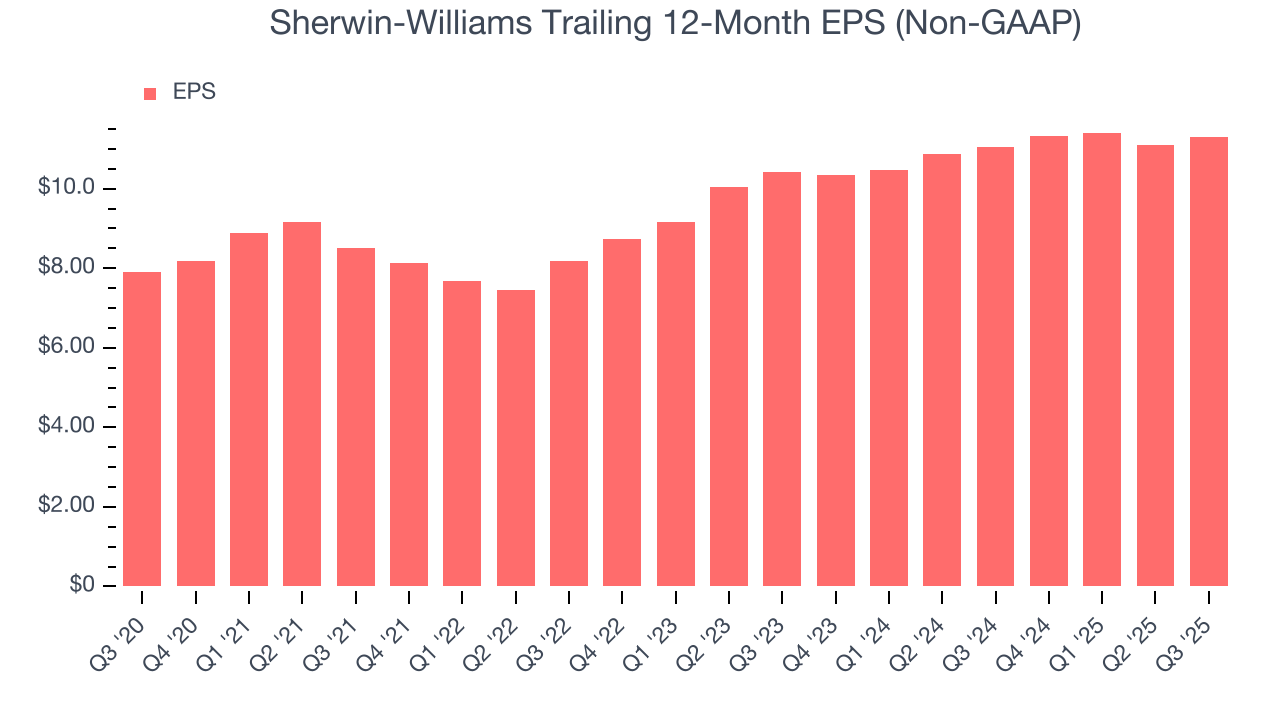
Sherwin-Williams’s EPS grew at an unimpressive 7.4% compounded annual growth rate over the last five years. On the bright side, this performance was better than its 5.3% annualized revenue growth and tells us the company became more profitable on a per-share basis as it expanded.
Diving into the nuances of Sherwin-Williams’s earnings can give us a better understanding of its performance. As we mentioned earlier, Sherwin-Williams’s operating margin was flat this quarter but expanded by 2.1 percentage points over the last five years. On top of that, its share count shrank by 9.9%. These are positive signs for shareholders because improving profitability and share buybacks turbocharge EPS growth relative to revenue growth. 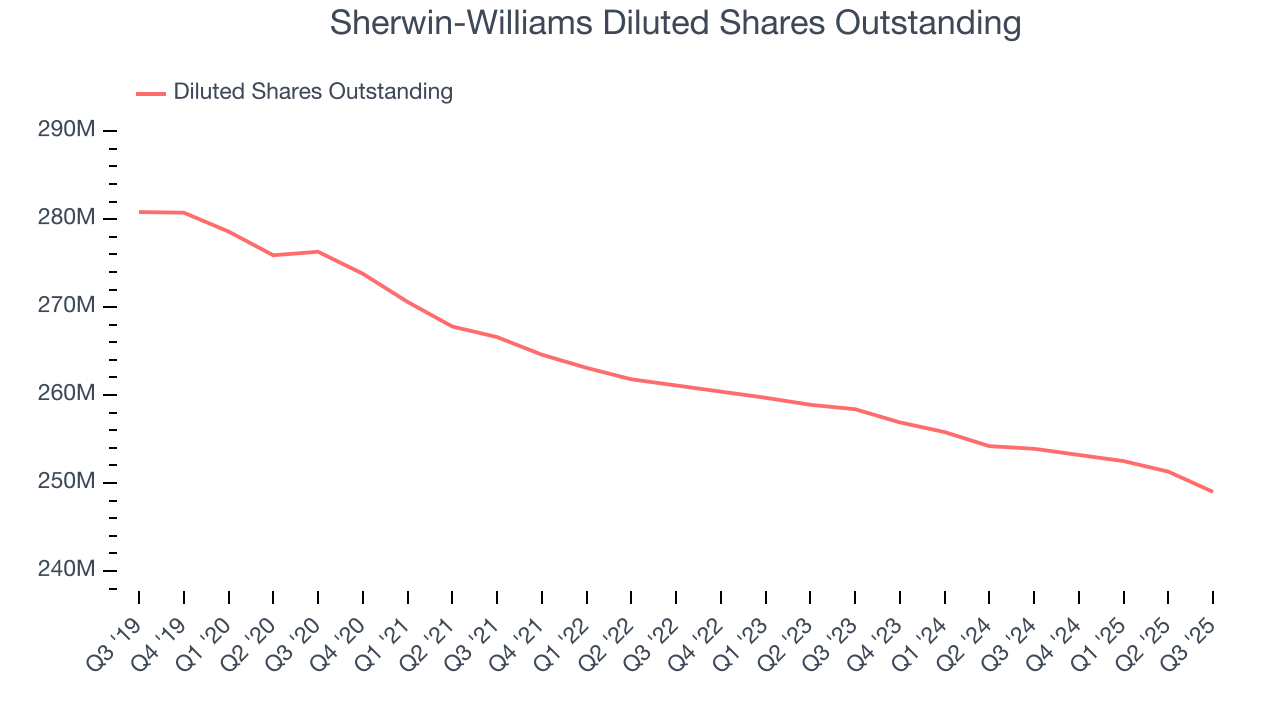
Like with revenue, we analyze EPS over a shorter period to see if we are missing a change in the business.
For Sherwin-Williams, its two-year annual EPS growth of 4.2% was lower than its five-year trend. We hope its growth can accelerate in the future.
In Q3, Sherwin-Williams reported adjusted EPS of $3.59, up from $3.37 in the same quarter last year. This print beat analysts’ estimates by 4.4%. Over the next 12 months, Wall Street expects Sherwin-Williams’s full-year EPS of $11.31 to grow 8.1%.
9. Cash Is King
Although earnings are undoubtedly valuable for assessing company performance, we believe cash is king because you can’t use accounting profits to pay the bills.
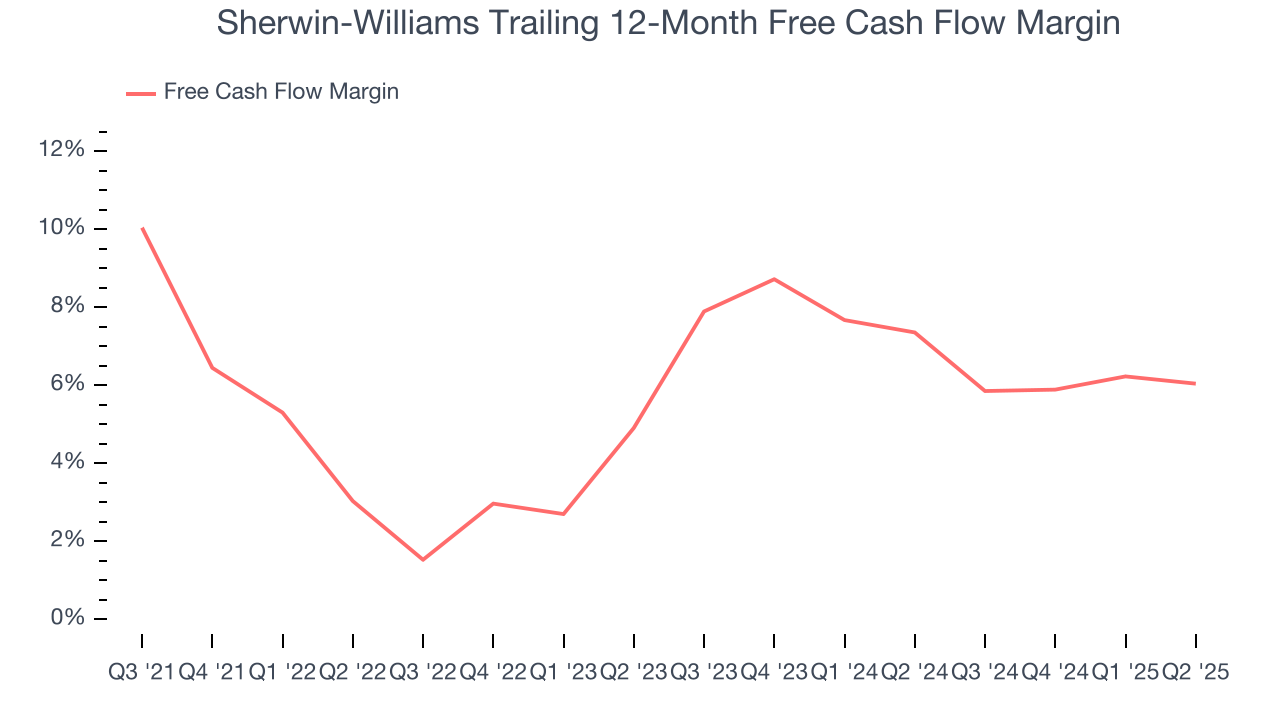
Sherwin-Williams has shown mediocre cash profitability over the last five years, giving the company limited opportunities to return capital to shareholders. Its free cash flow margin averaged 5.9%, subpar for an industrials business. The divergence from its good operating margin stems from its capital-intensive business model, which requires Sherwin-Williams to make large cash investments in working capital and capital expenditures.
Taking a step back, we can see that Sherwin-Williams’s margin dropped by 5.1 percentage points during that time. This along with its unexciting margin put the company in a tough spot, and shareholders are likely hoping it can reverse course. If the trend continues, it could signal it’s becoming a more capital-intensive business.
10. Return on Invested Capital (ROIC)
EPS and free cash flow tell us whether a company was profitable while growing its revenue. But was it capital-efficient? Enter ROIC, a metric showing how much operating profit a company generates relative to the money it has raised (debt and equity).
Although Sherwin-Williams hasn’t been the highest-quality company lately, it found a few growth initiatives in the past that worked out wonderfully. Its five-year average ROIC was 19%, splendid for an industrials business.
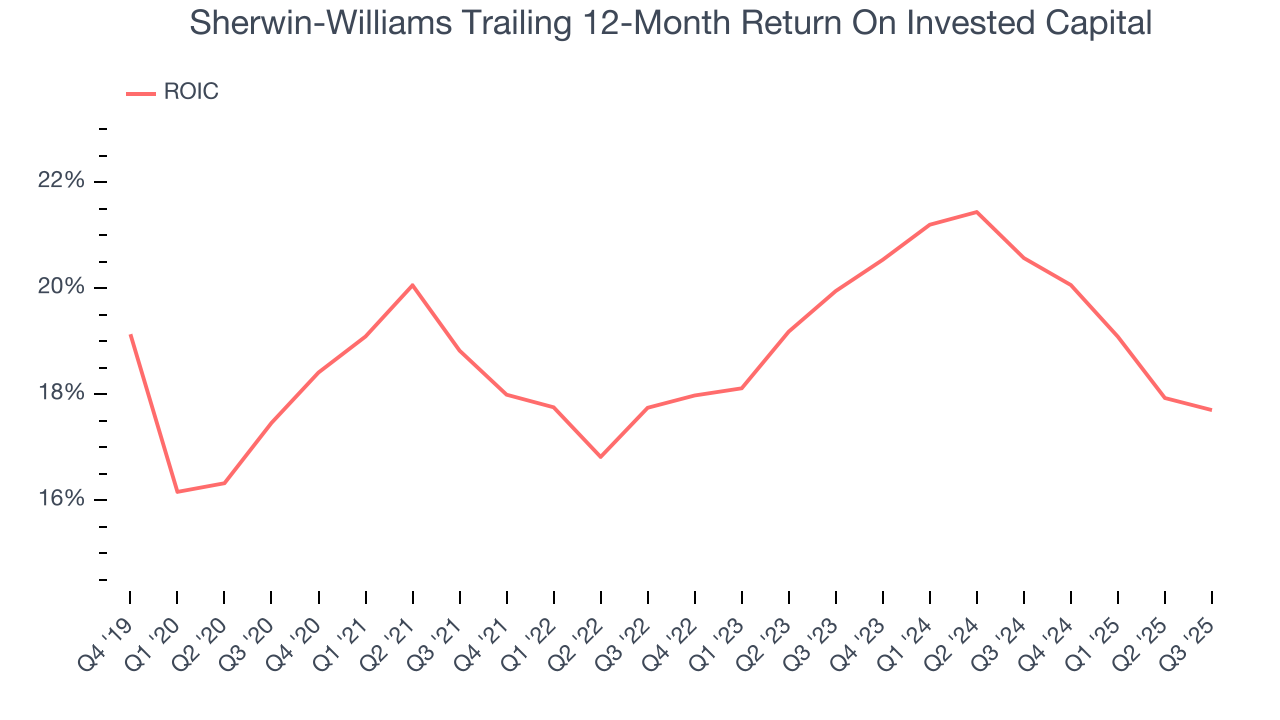
We like to invest in businesses with high returns, but the trend in a company’s ROIC is what often surprises the market and moves the stock price. Uneventfully, Sherwin-Williams’s ROIC has stayed the same over the last few years. Given the company’s underwhelming financial performance in other areas, we’d like to see its returns improve before recommending the stock.
11. Balance Sheet Assessment
Sherwin-Williams reported $241.5 million of cash and $13.58 billion of debt on its balance sheet in the most recent quarter. As investors in high-quality companies, we primarily focus on two things: 1) that a company’s debt level isn’t too high and 2) that its interest payments are not excessively burdening the business.
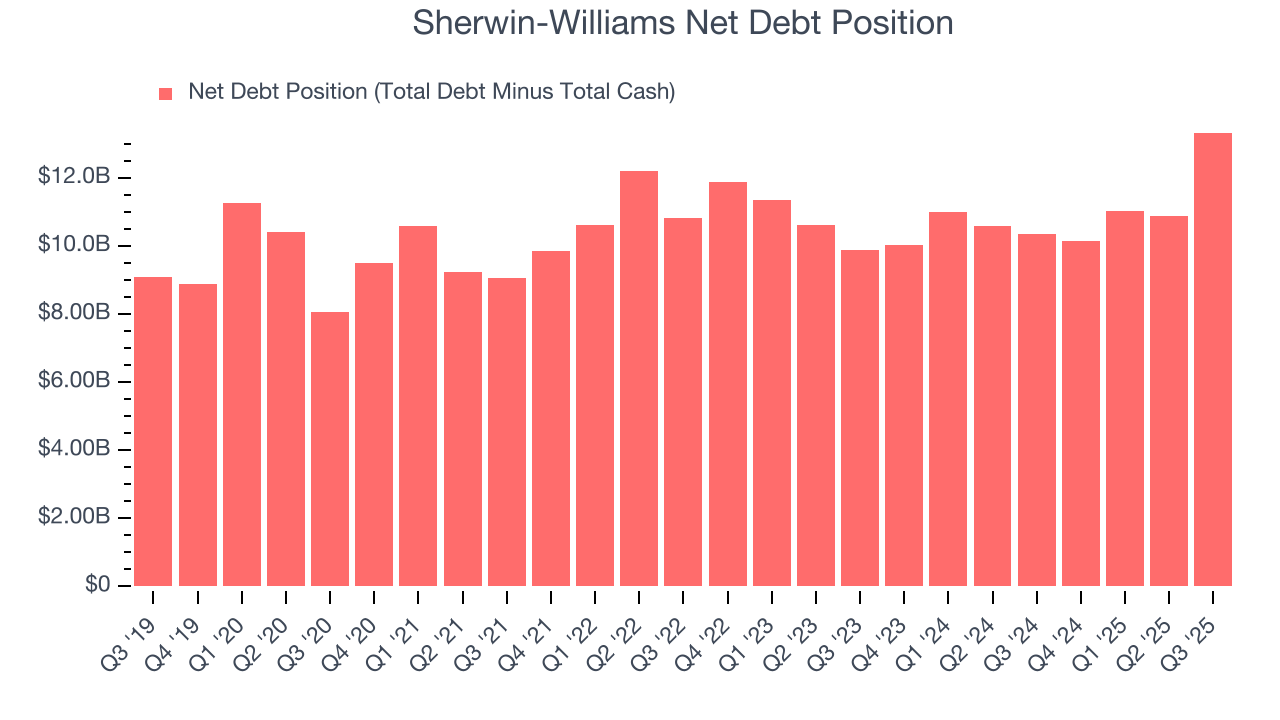
With $4.49 billion of EBITDA over the last 12 months, we view Sherwin-Williams’s 3.0× net-debt-to-EBITDA ratio as safe. We also see its $193 million of annual interest expenses as appropriate. The company’s profits give it plenty of breathing room, allowing it to continue investing in growth initiatives.
12. Key Takeaways from Sherwin-Williams’s Q3 Results
We enjoyed seeing Sherwin-Williams beat analysts’ revenue expectations this quarter. We were also happy its EBITDA outperformed Wall Street’s estimates. Overall, this print had some key positives. The stock traded up 5.3% to $354.03 immediately after reporting.
13. Is Now The Time To Buy Sherwin-Williams?
Updated: January 24, 2026 at 10:37 PM EST
The latest quarterly earnings matters, sure, but we actually think longer-term fundamentals and valuation matter more. Investors should consider all these pieces before deciding whether or not to invest in Sherwin-Williams.
Sherwin-Williams isn’t a terrible business, but it isn’t one of our picks. To kick things off, its revenue growth was uninspiring over the last five years, and analysts don’t see anything changing over the next 12 months. And while its admirable gross margins indicate the mission-critical nature of its offerings, the downside is its flat organic revenue disappointed. On top of that, its cash profitability fell over the last five years.
Sherwin-Williams’s P/E ratio based on the next 12 months is 29.2x. Investors with a higher risk tolerance might like the company, but we don’t really see a big opportunity at the moment. We're fairly confident there are better stocks to buy right now.
Wall Street analysts have a consensus one-year price target of $386.29 on the company (compared to the current share price of $348.44).