
J. M. Smucker (SJM)
J. M. Smucker is up against the odds. Its weak sales growth and low returns on capital show it struggled to generate demand and profits.― StockStory Analyst Team
1. News


2. Summary
Why We Think J. M. Smucker Will Underperform
Best known for its fruit jams and spreads, J.M Smucker (NYSE:SJM) is a packaged foods company whose products span from peanut butter and coffee to pet food.
- ROIC of 0.8% reflects management’s challenges in identifying attractive investment opportunities, and its falling returns suggest its earlier profit pools are drying up
- Historical operating margin losses point to an inefficient cost structure
- Sales trends were unexciting over the last three years as its 2.3% annual growth was below the typical consumer staples company


J. M. Smucker doesn’t live up to our standards. There’s a wealth of better opportunities.
Why There Are Better Opportunities Than J. M. Smucker


J. M. Smucker’s stock price of $95.12 implies a valuation ratio of 9.4x forward P/E. This is a cheap valuation multiple, but for good reason. You get what you pay for.
We’d rather pay up for companies with elite fundamentals than get a bargain on weak ones. Cheap stocks can be value traps, and as their performance deteriorates, they will stay cheap or get even cheaper.
3. J. M. Smucker (SJM) Research Report: Q4 CY2025 Update
Packaged foods company J.M Smucker (NYSE:SJM) reported revenue ahead of Wall Street’s expectations in Q4 CY2025, with sales up 7% year on year to $2.34 billion. Its non-GAAP profit of $2.38 per share was 5.2% above analysts’ consensus estimates.
J. M. Smucker (SJM) Q4 CY2025 Highlights:
- Revenue: $2.34 billion vs analyst estimates of $2.33 billion (7% year-on-year growth, 0.5% beat)
- Adjusted EPS: $2.38 vs analyst estimates of $2.26 (5.2% beat)
- Management reiterated its full-year Adjusted EPS guidance of $9 at the midpoint
- Operating Margin: -23.4%, up from -27.2% in the same quarter last year
- Free Cash Flow Margin: 20.8%, up from 6.9% in the same quarter last year
- Sales Volumes fell 2% year on year (-5% in the same quarter last year)
- Market Capitalization: $11.37 billion
Company Overview
Best known for its fruit jams and spreads, J.M Smucker (NYSE:SJM) is a packaged foods company whose products span from peanut butter and coffee to pet food.
The company traces its roots back to 1897 when Ohio farmer Jerome Monroe Smucker began selling apple butter made in his family's orchard. From there, the company innovated around its core fruit spreads, introduced new products, and made strategic acquisitions of brands such as Jif (peanut butter), Folgers (coffee), and Big Heart Brands (pet food brands like Milk-Bone and Meow Mix).
J.M. Smucker caters mostly to middle-income households seeking convenience from trusted brands. Customers who rely on these brands are usually busy and don’t have the time to cook meals or prepare snacks from scratch for themselves and their families. Furthermore, these brands are ones that many customers have been familiar with since childhood, adding an element of comfort.
J.M. Smucker products are widely available in grocery stores, supermarkets, general merchandise retailers that carry food and snacks, convenience stores, and restaurants globally. The company is able to leverage its iconic brands for strong distribution and prominent placement on retailer shelves. For example, if a grocery store or discount food retailer could only carry two or three peanut butter brands, there’s a high likelihood that one of them would be Jif.
4. Shelf-Stable Food
As America industrialized and moved away from an agricultural economy, people faced more demands on their time. Packaged foods emerged as a solution offering convenience to the evolving American family, whether it be canned goods or snacks. Today, Americans seek brands that are high in quality, reliable, and reasonably priced. Furthermore, there's a growing emphasis on health-conscious and sustainable food options. Packaged food stocks are considered resilient investments. People always need to eat, so these companies can enjoy consistent demand as long as they stay on top of changing consumer preferences. The industry spans from multinational corporations to smaller specialized firms and is subject to food safety and labeling regulations.
Competitors in packaged food with diverse brand portfolios include Mondelez (NASDAQ:MDLZ), Campbell Soup (NYSE:CPB), General Mills (NYSE:GIS), and Nestle (SWX:NESN).
5. Revenue Growth
Reviewing a company’s long-term sales performance reveals insights into its quality. Any business can put up a good quarter or two, but many enduring ones grow for years.
With $8.93 billion in revenue over the past 12 months, J. M. Smucker is one of the larger consumer staples companies and benefits from a well-known brand that influences purchasing decisions. However, its scale is a double-edged sword because there are only a finite number of major retail partners, placing a ceiling on its growth. To accelerate sales, J. M. Smucker likely needs to optimize its pricing or lean into new products and international expansion.
As you can see below, J. M. Smucker grew its sales at a sluggish 2.3% compounded annual growth rate over the last three years as it failed to grow its volumes. We’ll explore what this means in the "Volume Growth" section.
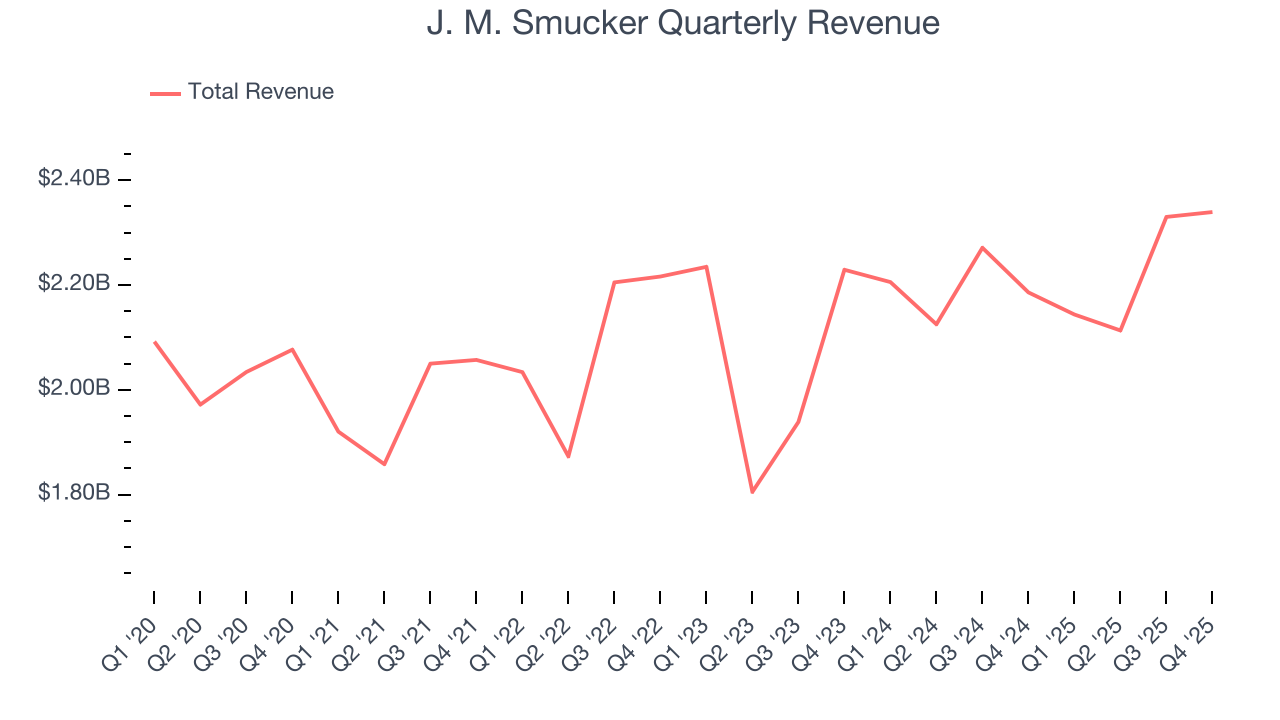
This quarter, J. M. Smucker reported year-on-year revenue growth of 7%, and its $2.34 billion of revenue exceeded Wall Street’s estimates by 0.5%.
Looking ahead, sell-side analysts expect revenue to grow 4% over the next 12 months. Although this projection indicates its newer products will spur better top-line performance, it is still below average for the sector.
6. Volume Growth
Revenue growth can be broken down into changes in price and volume (the number of units sold). While both are important, volume is the lifeblood of a successful staples business as there’s a ceiling to what consumers will pay for everyday goods; they can always trade down to non-branded products if the branded versions are too expensive.
J. M. Smucker’s quarterly sales volumes have, on average, stayed about the same over the last two years. This stability is normal because the quantity demanded for consumer staples products typically doesn’t see much volatility. 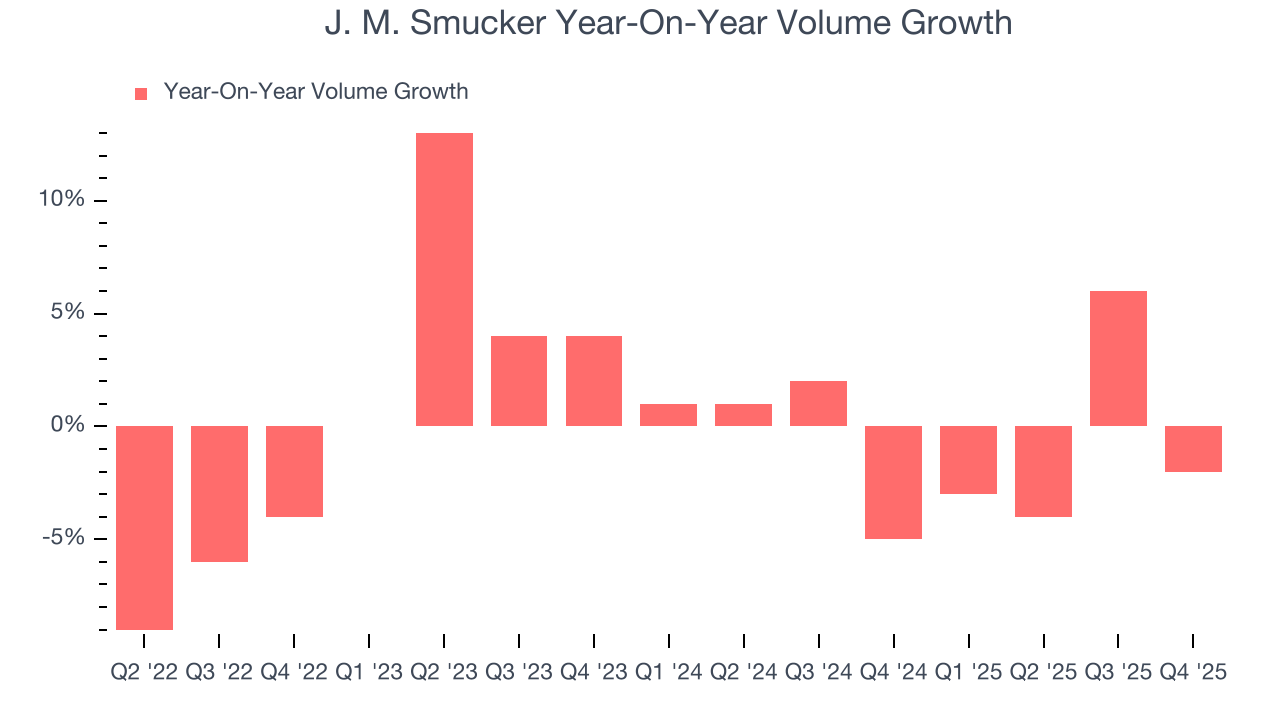
In J. M. Smucker’s Q4 2026, sales volumes dropped 2% year on year. This result represents a further deceleration from its historical levels, showing the business is struggling to move its products.
7. Gross Margin & Pricing Power
All else equal, we prefer higher gross margins because they make it easier to generate more operating profits and indicate that a company commands pricing power by offering more differentiated products.
J. M. Smucker has good unit economics for a consumer staples company, giving it the opportunity to invest in areas such as marketing and talent to stay competitive. As you can see below, it averaged an impressive 36.8% gross margin over the last two years. That means for every $100 in revenue, $63.19 went towards paying for raw materials, production of goods, transportation, and distribution. 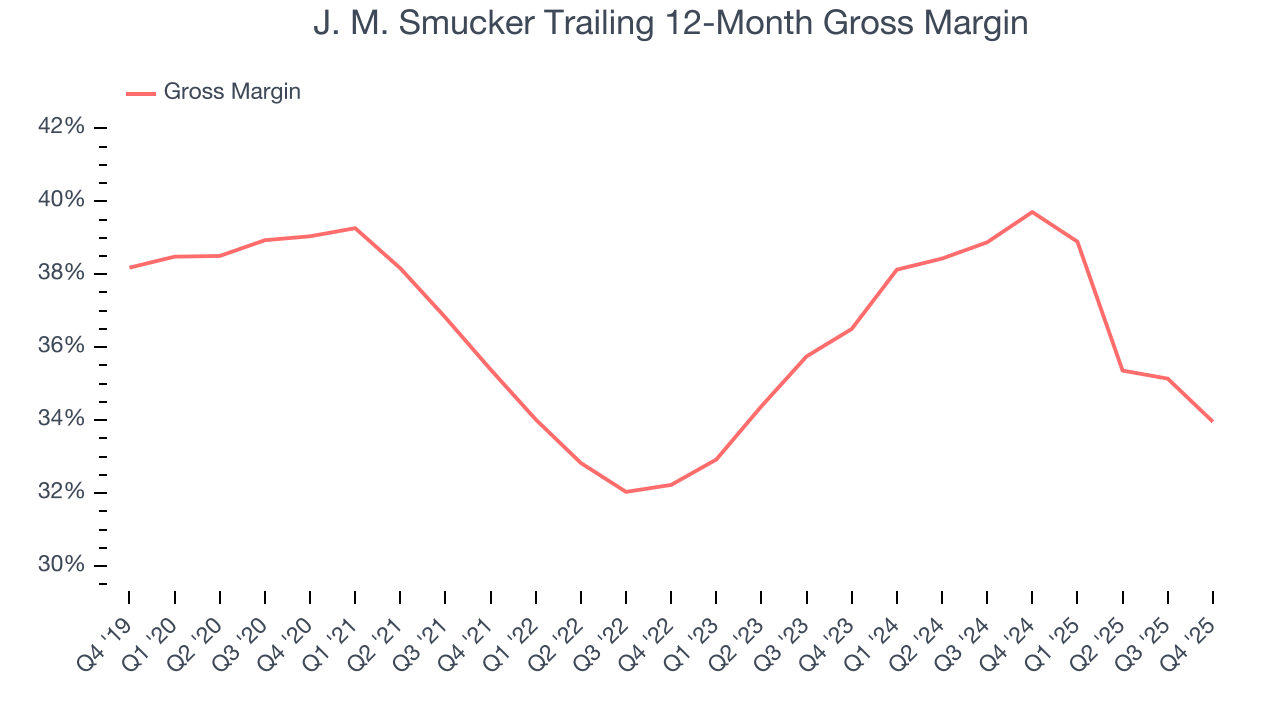
J. M. Smucker’s gross profit margin came in at 35.4% this quarter, down 4.8 percentage points year on year. J. M. Smucker’s full-year margin has also been trending down over the past 12 months, decreasing by 5.7 percentage points. If this move continues, it could suggest deteriorating pricing power and higher input costs (such as raw materials and manufacturing expenses).
8. Operating Margin
Operating margin is a key measure of profitability. Think of it as net income - the bottom line - excluding the impact of taxes and interest on debt, which are less connected to business fundamentals.
Unprofitable public companies are rare in the defensive consumer staples industry. Unfortunately, J. M. Smucker was one of them over the last two years as its high expenses contributed to an average operating margin of negative 2%.
Analyzing the trend in its profitability, J. M. Smucker’s operating margin decreased by 11.4 percentage points over the last year. This raises questions about the company’s expense base because its revenue growth should have given it leverage on its fixed costs, resulting in better economies of scale and profitability. J. M. Smucker’s performance was poor no matter how you look at it - it shows that costs were rising and it couldn’t pass them onto its customers.
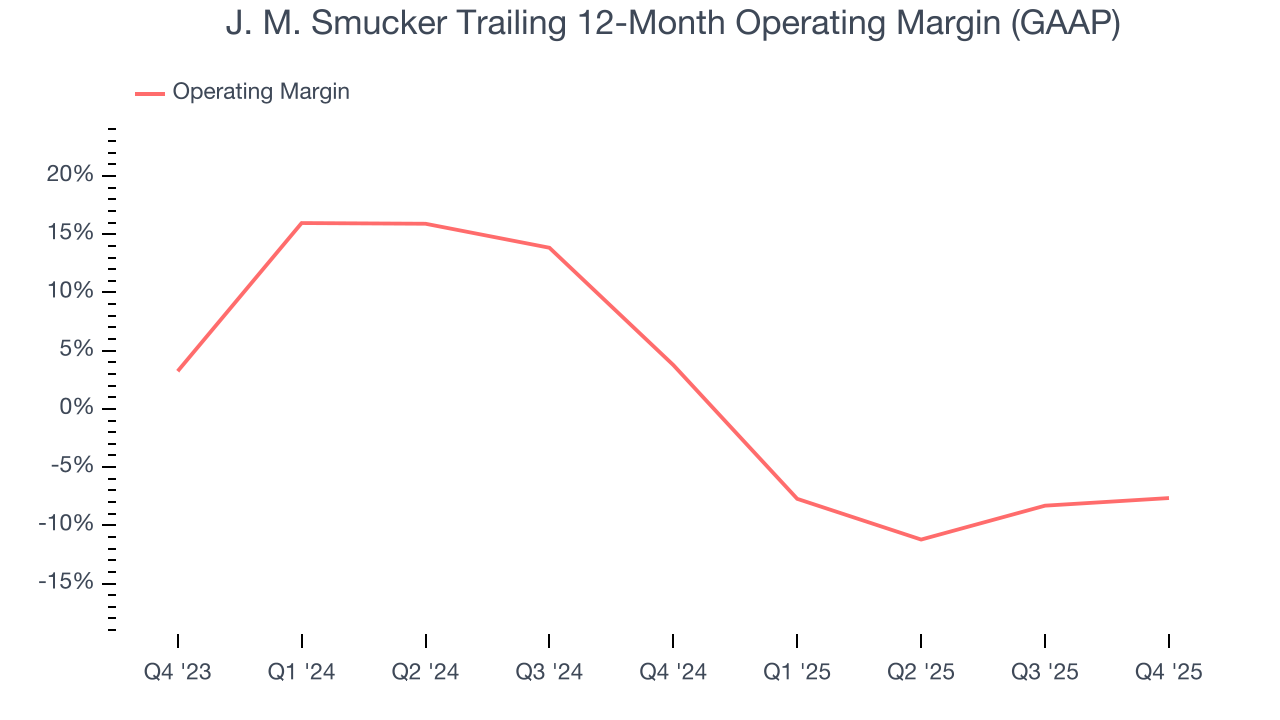
This quarter, J. M. Smucker generated a negative 23.4% operating margin. The company's consistent lack of profits raise a flag.
9. Earnings Per Share
Revenue trends explain a company’s historical growth, but the long-term change in earnings per share (EPS) points to the profitability of that growth – for example, a company could inflate its sales through excessive spending on advertising and promotions.
J. M. Smucker’s flat EPS over the last three years was below its 2.3% annualized revenue growth. This tells us the company became less profitable on a per-share basis as it expanded.
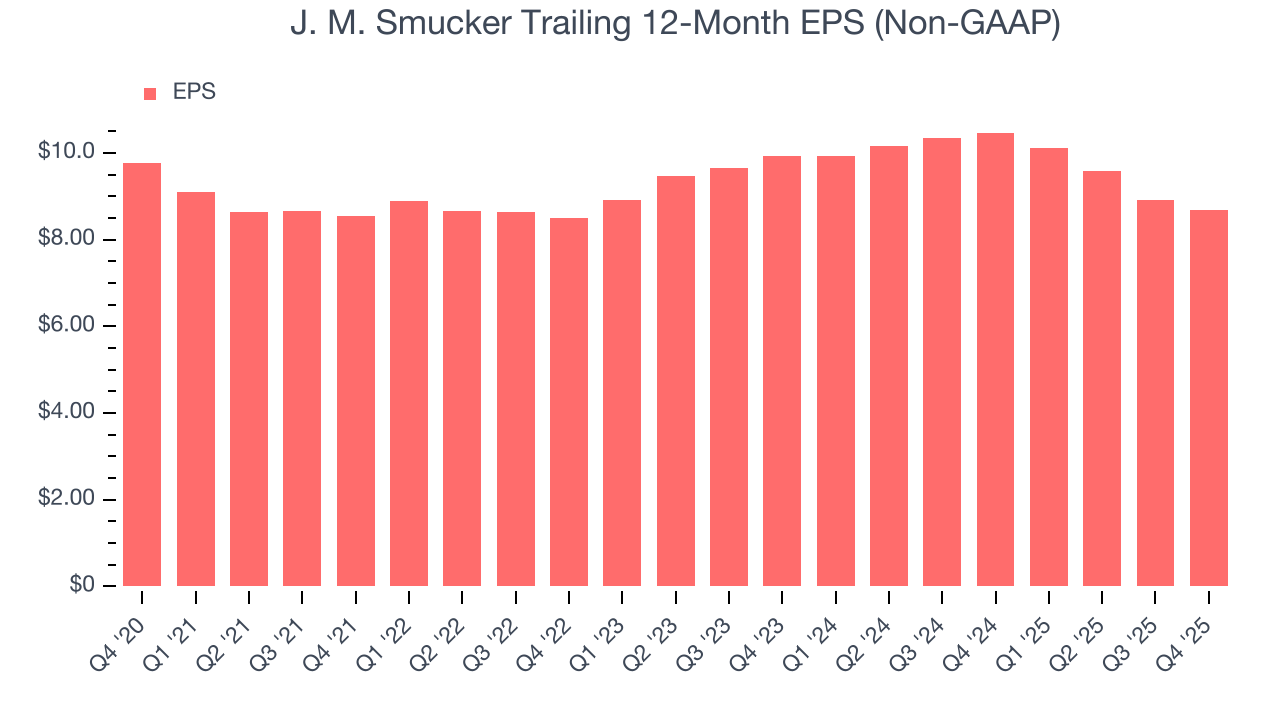
In Q4, J. M. Smucker reported adjusted EPS of $2.38, down from $2.61 in the same quarter last year. Despite falling year on year, this print beat analysts’ estimates by 5.2%. Over the next 12 months, Wall Street expects J. M. Smucker’s full-year EPS of $8.69 to grow 15.3%.
10. Cash Is King
Although earnings are undoubtedly valuable for assessing company performance, we believe cash is king because you can’t use accounting profits to pay the bills.
J. M. Smucker has shown robust cash profitability, driven by its attractive business model that enables it to reinvest or return capital to investors. The company’s free cash flow margin averaged 10.1% over the last two years, quite impressive for a consumer staples business. The divergence from its underwhelming operating margin stems from the add-back of non-cash charges like depreciation and stock-based compensation. GAAP operating profit expenses these line items, but free cash flow does not.
Taking a step back, we can see that J. M. Smucker’s margin expanded by 1.6 percentage points over the last year. This shows the company is heading in the right direction, and we can see it became a less capital-intensive business because its free cash flow profitability rose while its operating profitability fell.
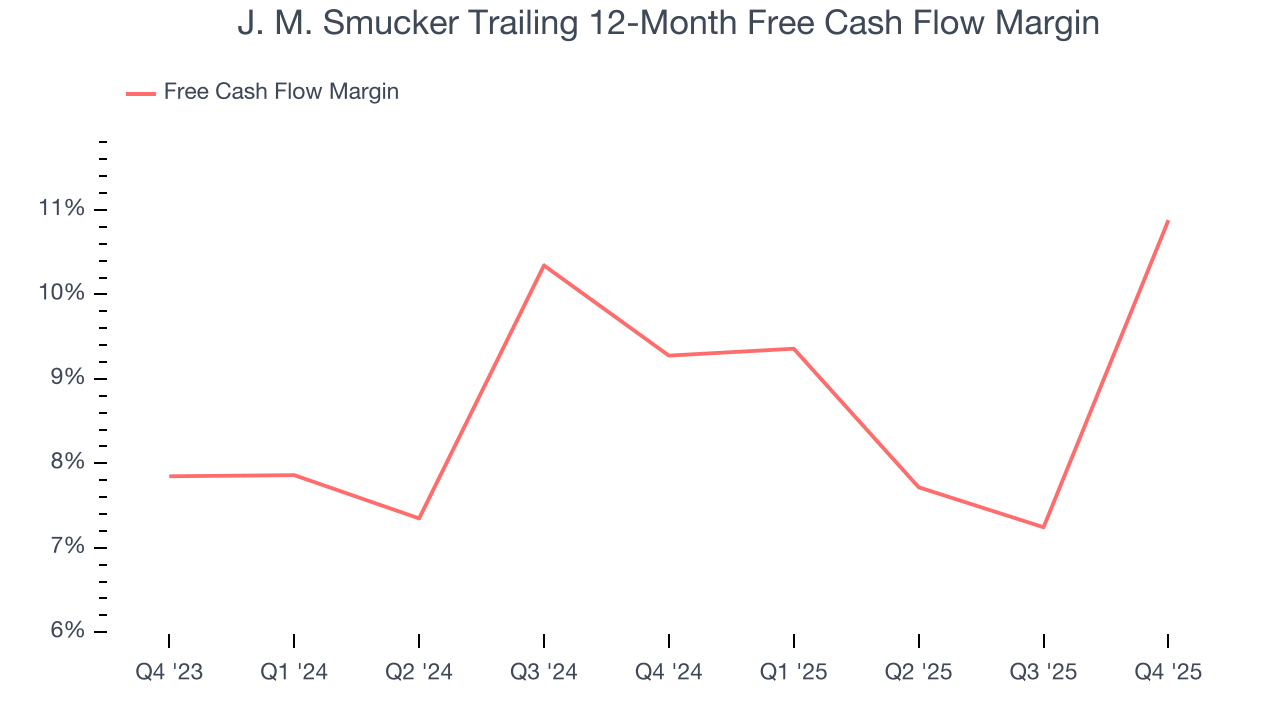
J. M. Smucker’s free cash flow clocked in at $487 million in Q4, equivalent to a 20.8% margin. This result was good as its margin was 13.9 percentage points higher than in the same quarter last year, building on its favorable historical trend.
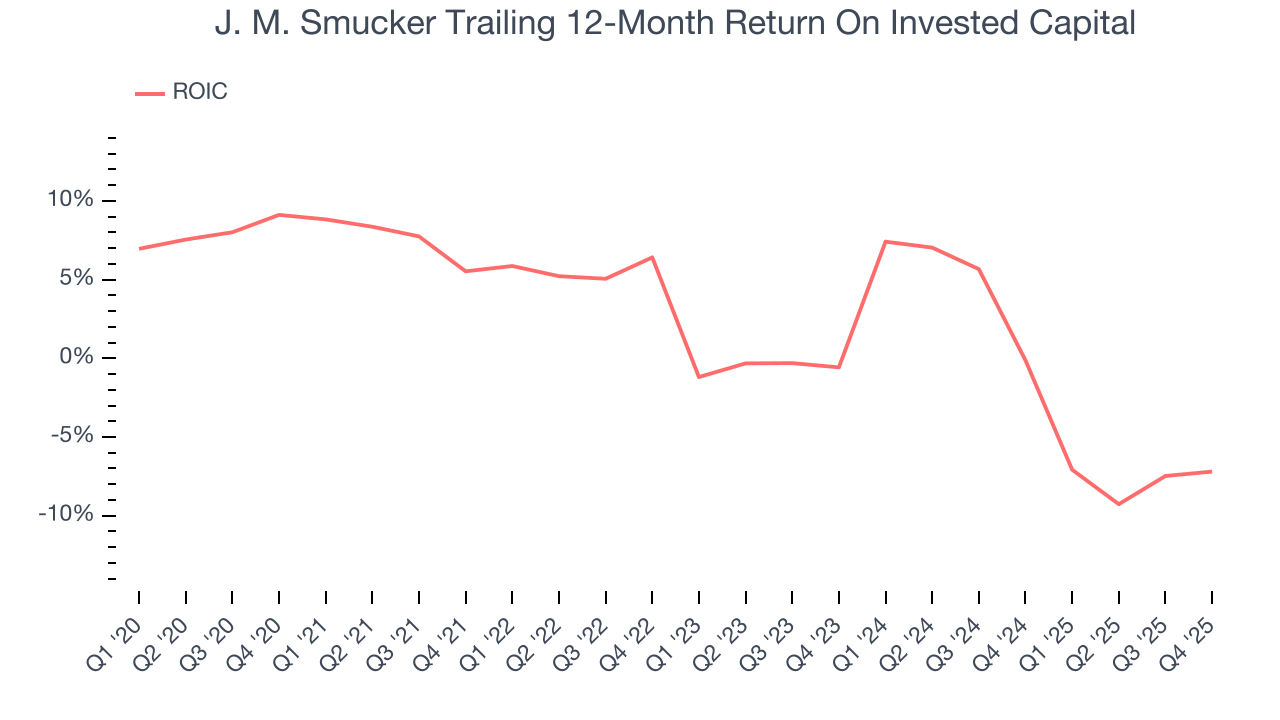
11. Return on Invested Capital (ROIC)
EPS and free cash flow tell us whether a company was profitable while growing its revenue. But was it capital-efficient? A company’s ROIC explains this by showing how much operating profit it makes compared to the money it has raised (debt and equity).
J. M. Smucker historically did a mediocre job investing in profitable growth initiatives. Its five-year average ROIC was 0.8%, lower than the typical cost of capital (how much it costs to raise money) for consumer staples companies.
12. Balance Sheet Assessment
J. M. Smucker reported $52.8 million of cash and $7.33 billion of debt on its balance sheet in the most recent quarter. As investors in high-quality companies, we primarily focus on two things: 1) that a company’s debt level isn’t too high and 2) that its interest payments are not excessively burdening the business.
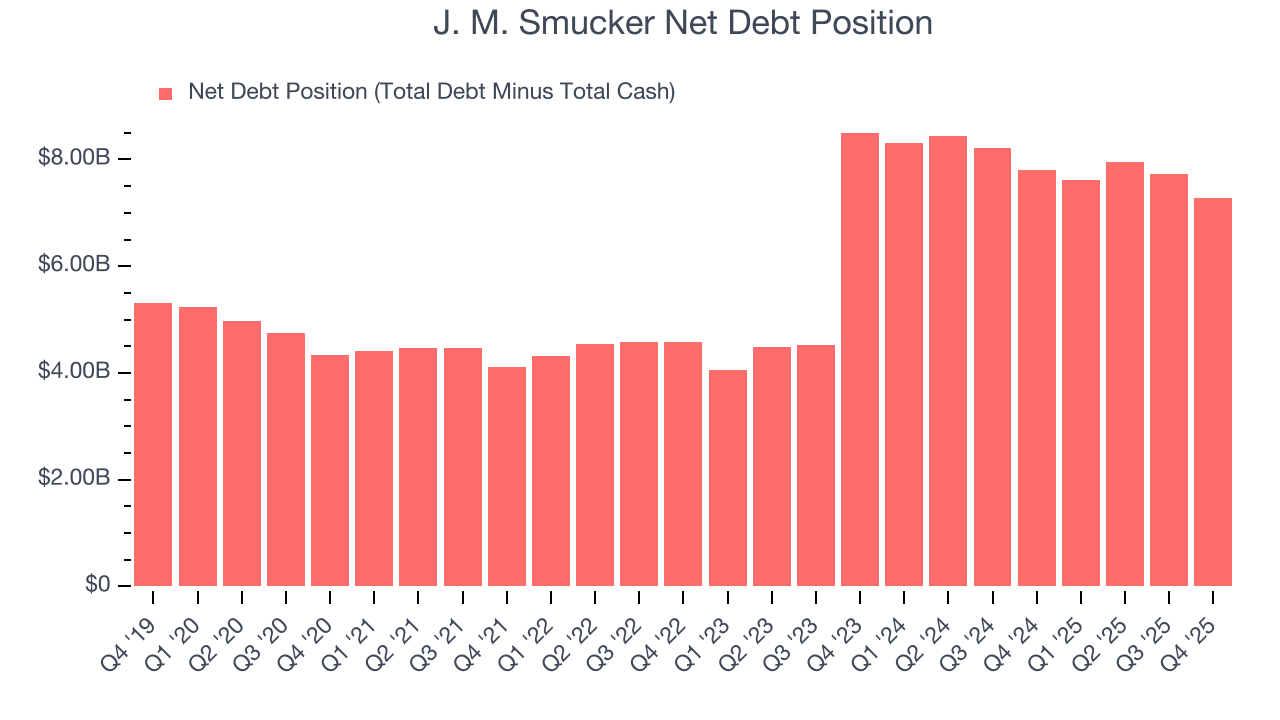
With $1.98 billion of EBITDA over the last 12 months, we view J. M. Smucker’s 3.7× net-debt-to-EBITDA ratio as safe. We also see its $387.5 million of annual interest expenses as appropriate. The company’s profits give it plenty of breathing room, allowing it to continue investing in growth initiatives.
13. Key Takeaways from J. M. Smucker’s Q4 Results
We were impressed that J. M. Smucker beat analysts’ EPS expectations this quarter. We were also happy its gross margin outperformed Wall Street’s estimates. Overall, this print had some key positives. The stock traded up 7.2% to $114.25 immediately following the results.
14. Is Now The Time To Buy J. M. Smucker?
Updated: March 28, 2026 at 10:43 PM EDT
Before making an investment decision, investors should account for J. M. Smucker’s business fundamentals and valuation in addition to what happened in the latest quarter.
J. M. Smucker doesn’t pass our quality test. First off, its revenue growth was uninspiring over the last three years, and analysts don’t see anything changing over the next 12 months. While its strong free cash flow generation allows it to invest in growth initiatives while maintaining an ample cushion, the downside is its declining operating margin shows the business has become less efficient. On top of that, its relatively low ROIC suggests management has struggled to find compelling investment opportunities.
J. M. Smucker’s P/E ratio based on the next 12 months is 9.4x. While this valuation is optically cheap, the potential downside is huge given its shaky fundamentals. There are better stocks to buy right now.
Wall Street analysts have a consensus one-year price target of $125.20 on the company (compared to the current share price of $95.12).
Although the price target is bullish, readers should exercise caution because analysts tend to be overly optimistic. The firms they work for, often big banks, have relationships with companies that extend into fundraising, M&A advisory, and other rewarding business lines. As a result, they typically hesitate to say bad things for fear they will lose out. We at StockStory do not suffer from such conflicts of interest, so we’ll always tell it like it is.