
Schneider (SNDR)
We wouldn’t recommend Schneider. Its poor sales growth and falling returns on capital suggest its growth opportunities are shrinking.― StockStory Analyst Team
1. News


2. Summary
Why We Think Schneider Will Underperform
Employing thousands of drivers across the country to make deliveries, Schneider (NYSE:SNDR) makes full truckload and intermodal deliveries regionally and across borders.
- Earnings per share have dipped by 13.1% annually over the past five years, which is concerning because stock prices follow EPS over the long term
- Gross margin of 17.6% reflects its high production costs
- Annual revenue growth of 1.6% over the last two years was below our standards for the industrials sector


Schneider doesn’t live up to our standards. We’re looking for better stocks elsewhere.
Why There Are Better Opportunities Than Schneider


At $23.71 per share, Schneider trades at 28.1x forward P/E. This multiple is higher than most industrials companies, and we think it’s quite expensive for the weaker revenue growth you get.
There are stocks out there similarly priced with better business quality. We prefer owning these.
3. Schneider (SNDR) Research Report: Q4 CY2025 Update
Transportation company Schneider (NYSE:SNDR) missed Wall Street’s revenue expectations in Q4 CY2025 as sales rose 4.5% year on year to $1.4 billion. Its non-GAAP profit of $0.13 per share was 35% below analysts’ consensus estimates.
Schneider (SNDR) Q4 CY2025 Highlights:
- Revenue: $1.4 billion vs analyst estimates of $1.45 billion (4.5% year-on-year growth, 3.7% miss)
- Adjusted EPS: $0.13 vs analyst expectations of $0.20 (35% miss)
- Adjusted EBITDA: $147 million vs analyst estimates of $167 million (10.5% margin, 12% miss)
- Adjusted EPS guidance for the upcoming financial year 2026 is $0.85 at the midpoint, missing analyst estimates by 20.8%
- Operating Margin: 2.6%, in line with the same quarter last year
- Free Cash Flow Margin: 11%, up from 7% in the same quarter last year
- Market Capitalization: $5.30 billion
Company Overview
Employing thousands of drivers across the country to make deliveries, Schneider (NYSE:SNDR) makes full truckload and intermodal deliveries regionally and across borders.
Schneider was established in 1935 when the founder sold the family car to buy the first truck. The company was able to expand its geographical reach and add new trucks and trailers to its fleet by merging with various companies, making acquisitions, and making internal investments. Specifically, the establishment of a new branch, Schneider Logistics, in 1993 and the acquisition of American Port Services in 2005 facilitated entry into intermodal deliveries and logistics services.
Today, its full truckload service makes deliveries, with a truck dedicated for a singular shipment, from the pickup location to the delivery location. Its truckload services include long-haul (distance of 250 miles or more), expedited, cross-border, and regional deliveries that are made through trucks that Schneider owns. For truckload deliveries, Schneider employs standard tractor-trailers for long-haul and regional routes, including dry vans, refrigerated trailers, and flatbeds. Customers primarily engage in long-term contracts typically spanning several years.
Schneider's intermodal delivery business combines trucks and trains to move goods. It uses trucks to pick up containers and take them to train stations. Then, trains carry the containers long distances which vary in size, ranging from 20 to 50 feet. Its customers purchase a desired volume within the container rather than whole containers. At the destination, trucks deliver the containers to their final locations. Schneider partners with railroad companies which allows them to use existing train networks.
The volume of the shipment or the amount of space it occupies determines the cost for its intermodal deliveries. For its truckload deliveries, the total weight of the shipment plays a large role in determining the cost. To incentivize more frequent and larger volume deliveries, it offers volume discounts to customers.
4. Ground Transportation
The growth of e-commerce and global trade continues to drive demand for shipping services, especially last-mile delivery, presenting opportunities for ground transportation companies. The industry continues to invest in data, analytics, and autonomous fleets to optimize efficiency and find the most cost-effective routes. Despite the essential services this industry provides, ground transportation companies are still at the whim of economic cycles. Consumer spending, for example, can greatly impact the demand for these companies’ offerings while fuel costs can influence profit margins.
Competitors offering similar products include C.H. Robinson (NASDAQ:CHRW), FedEx (NYSE:FDX), and J.B. Hunt (NASDAQ:JBHT).
5. Revenue Growth
Examining a company’s long-term performance can provide clues about its quality. Any business can have short-term success, but a top-tier one grows for years. Regrettably, Schneider’s sales grew at a tepid 4.5% compounded annual growth rate over the last five years. This fell short of our benchmark for the industrials sector and is a tough starting point for our analysis.
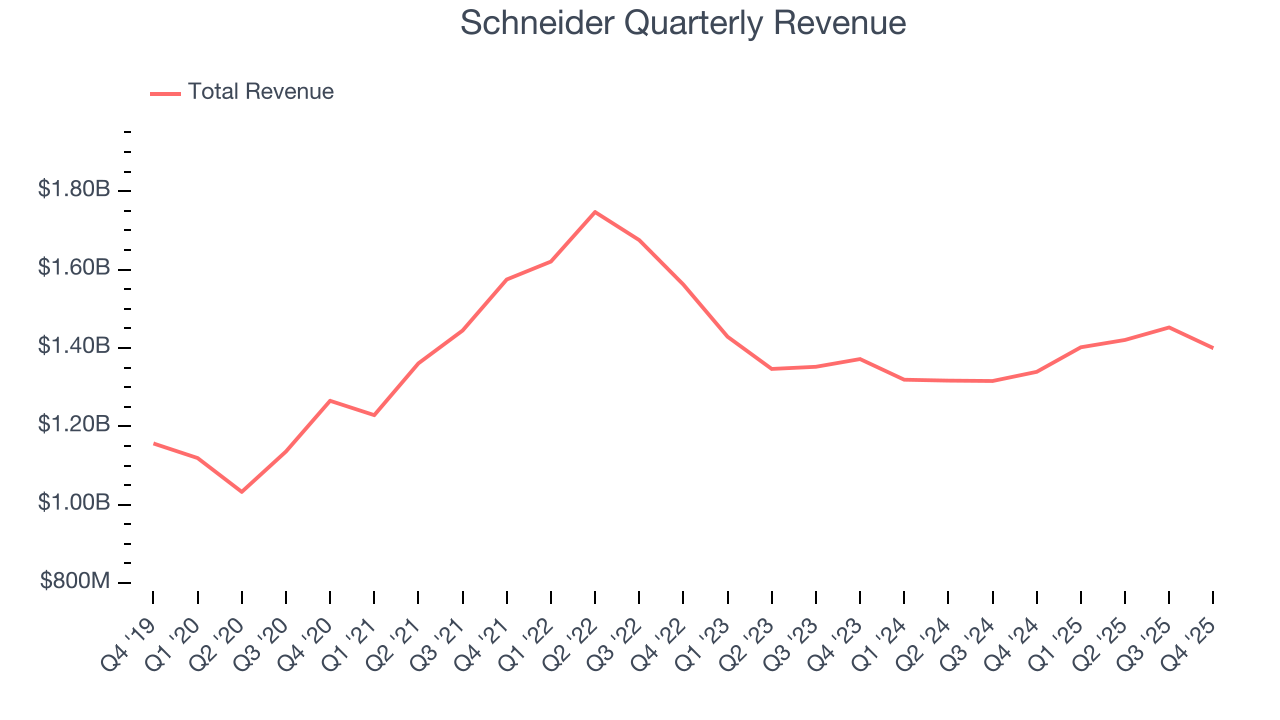
Long-term growth is the most important, but within industrials, a half-decade historical view may miss new industry trends or demand cycles. Schneider’s recent performance shows its demand has slowed as its annualized revenue growth of 1.6% over the last two years was below its five-year trend. 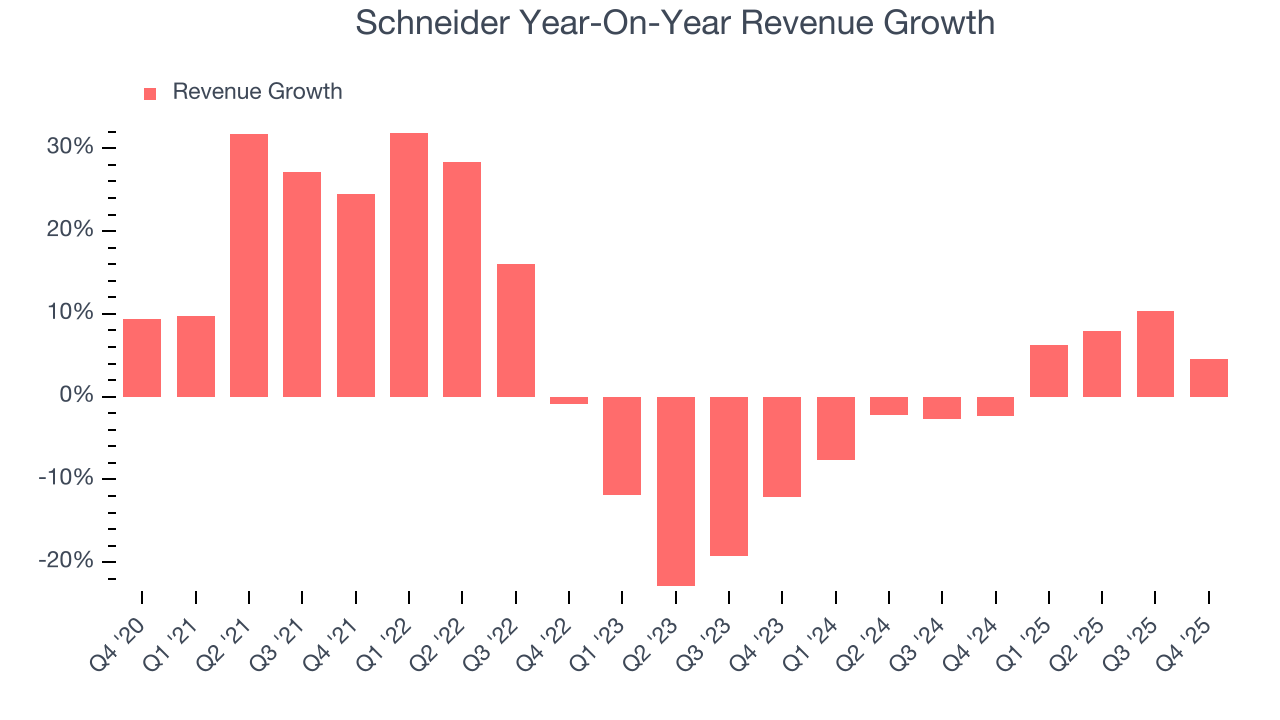
Schneider also breaks out the revenue for its most important segments, Truckload and Logistics, which are 43.6% and 23.5% of revenue. Over the last two years, Schneider’s Truckload revenue (road freight) averaged 7.3% year-on-year growth. On the other hand, its Logistics revenue (supply chain, warehousing) averaged 1.9% declines. 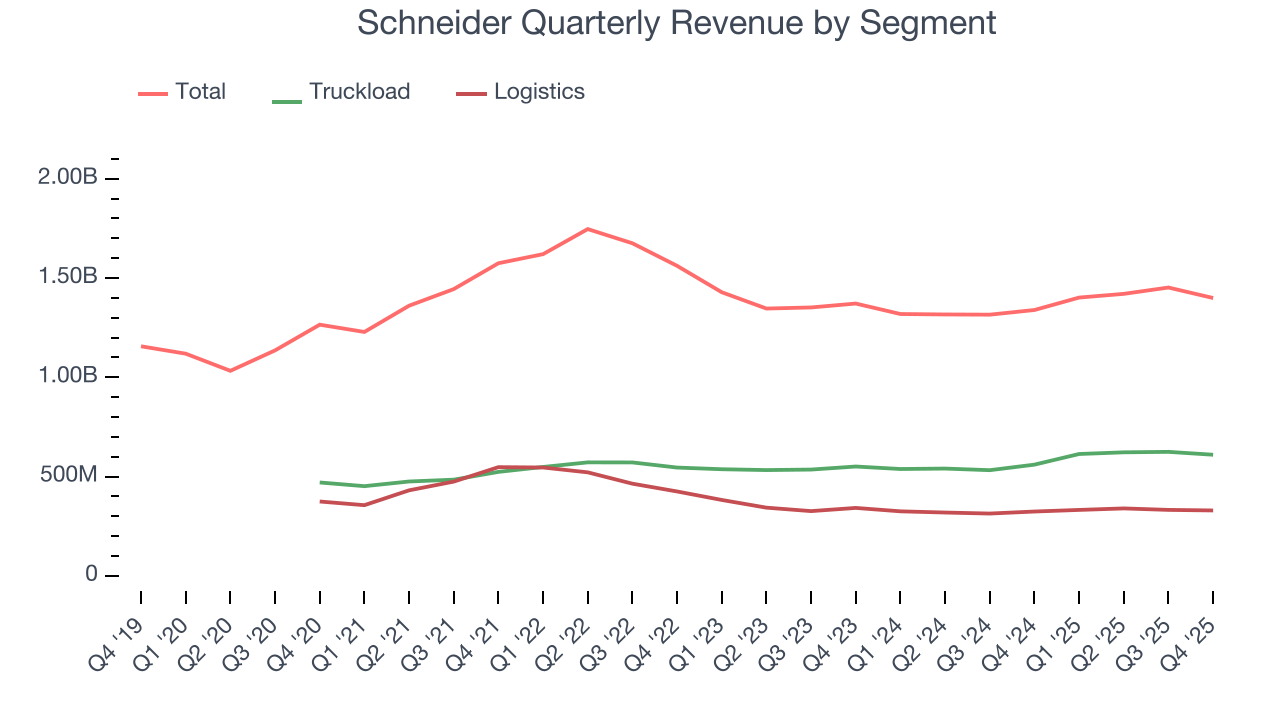
This quarter, Schneider’s revenue grew by 4.5% year on year to $1.4 billion, falling short of Wall Street’s estimates.
Looking ahead, sell-side analysts expect revenue to grow 5.5% over the next 12 months. Although this projection suggests its newer products and services will fuel better top-line performance, it is still below the sector average.
6. Gross Margin & Pricing Power
Cost of sales for an industrials business is usually comprised of the direct labor, raw materials, and supplies needed to offer a product or service. These costs can be impacted by inflation and supply chain dynamics.
Schneider has bad unit economics for an industrials business, signaling it operates in a competitive market. As you can see below, it averaged a 18.2% gross margin over the last five years. That means Schneider paid its suppliers a lot of money ($81.77 for every $100 in revenue) to run its business. 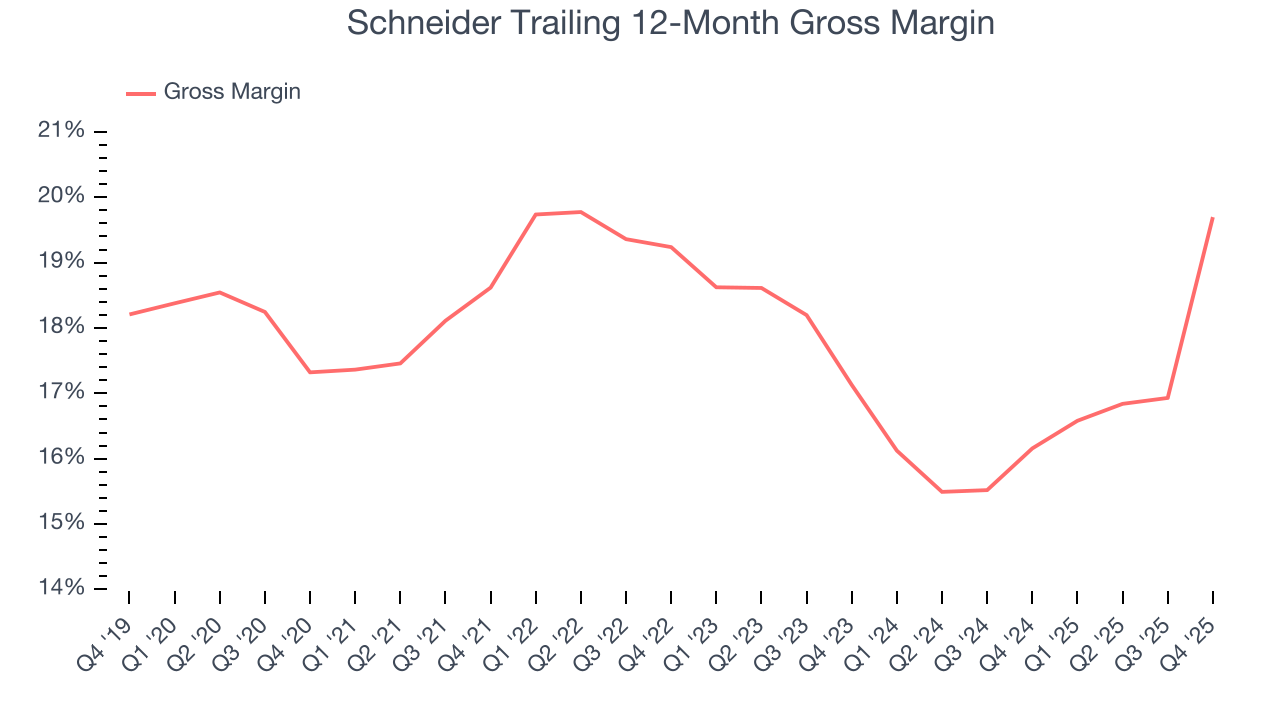
In Q4, Schneider produced a 28.7% gross profit margin, marking a 11.2 percentage point increase from 17.5% in the same quarter last year. Schneider’s full-year margin has also been trending up over the past 12 months, increasing by 3.5 percentage points. If this move continues, it could suggest better unit economics due to more leverage from its growing sales on the fixed portion of its cost of goods sold (such as manufacturing expenses).
7. Operating Margin
Operating margin is one of the best measures of profitability because it tells us how much money a company takes home after procuring and manufacturing its products, marketing and selling those products, and most importantly, keeping them relevant through research and development.
Schneider was profitable over the last five years but held back by its large cost base. Its average operating margin of 6.2% was weak for an industrials business. This result isn’t too surprising given its low gross margin as a starting point.
Looking at the trend in its profitability, Schneider’s operating margin decreased by 6.5 percentage points over the last five years. This raises questions about the company’s expense base because its revenue growth should have given it leverage on its fixed costs, resulting in better economies of scale and profitability. Schneider’s performance was poor no matter how you look at it - it shows that costs were rising and it couldn’t pass them onto its customers.
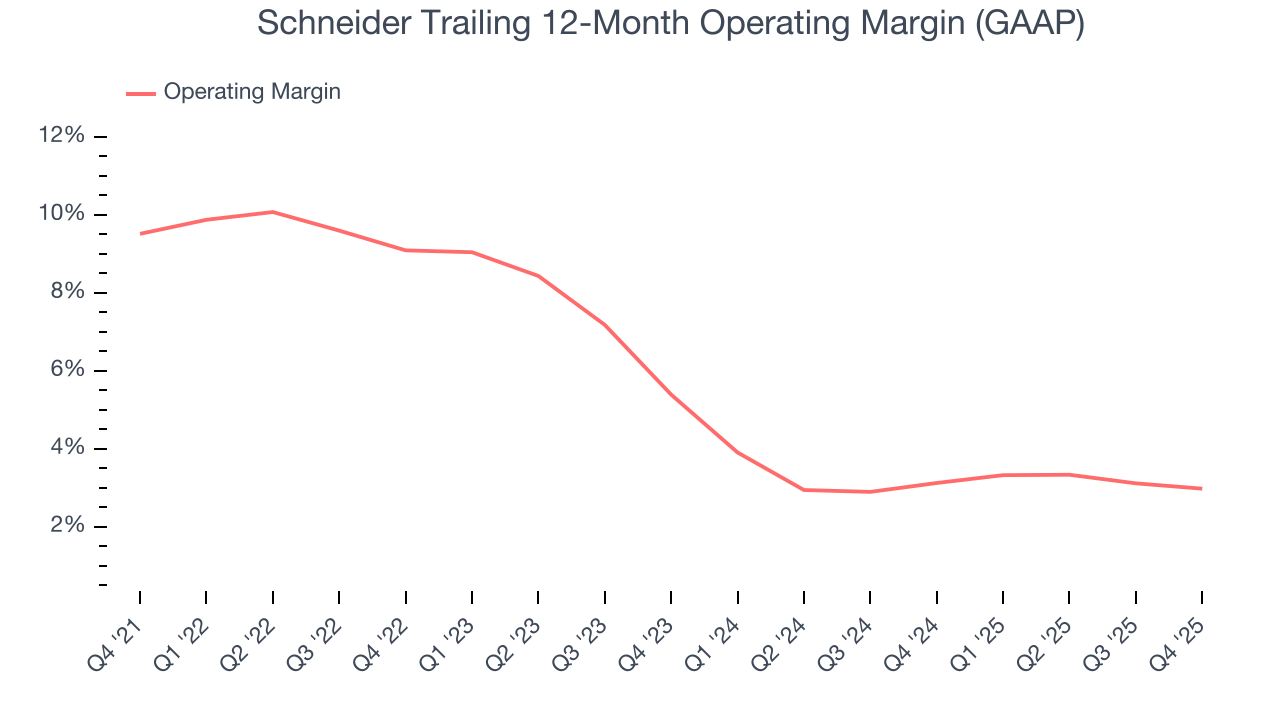
This quarter, Schneider generated an operating margin profit margin of 2.6%, in line with the same quarter last year. This indicates the company’s cost structure has recently been stable.
8. Earnings Per Share
Revenue trends explain a company’s historical growth, but the long-term change in earnings per share (EPS) points to the profitability of that growth – for example, a company could inflate its sales through excessive spending on advertising and promotions.
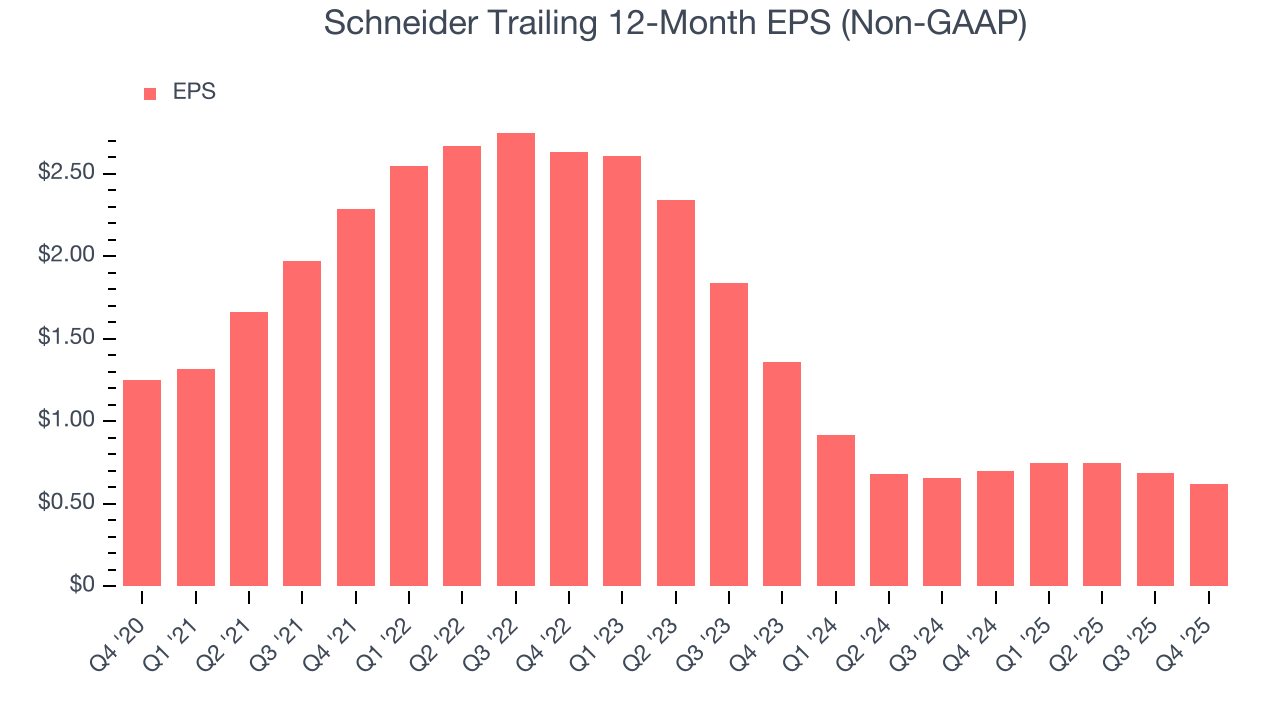
Sadly for Schneider, its EPS declined by 13.1% annually over the last five years while its revenue grew by 4.5%. This tells us the company became less profitable on a per-share basis as it expanded due to non-fundamental factors such as interest expenses and taxes.
We can take a deeper look into Schneider’s earnings to better understand the drivers of its performance. As we mentioned earlier, Schneider’s operating margin was flat this quarter but declined by 6.5 percentage points over the last five years. This was the most relevant factor (aside from the revenue impact) behind its lower earnings; interest expenses and taxes can also affect EPS but don’t tell us as much about a company’s fundamentals.
Like with revenue, we analyze EPS over a shorter period to see if we are missing a change in the business.
For Schneider, its two-year annual EPS declines of 32.5% show it’s continued to underperform. These results were bad no matter how you slice the data.
In Q4, Schneider reported adjusted EPS of $0.13, down from $0.20 in the same quarter last year. This print missed analysts’ estimates. Over the next 12 months, Wall Street expects Schneider’s full-year EPS of $0.62 to grow 72.2%.
9. Cash Is King
Although earnings are undoubtedly valuable for assessing company performance, we believe cash is king because you can’t use accounting profits to pay the bills.
Schneider has shown mediocre cash profitability over the last five years, giving the company limited opportunities to return capital to shareholders. Its free cash flow margin averaged 5%, subpar for an industrials business.
Taking a step back, an encouraging sign is that Schneider’s margin expanded by 1.1 percentage points during that time. The company’s improvement shows it’s heading in the right direction, and we can see it became a less capital-intensive business because its free cash flow profitability rose while its operating profitability fell.
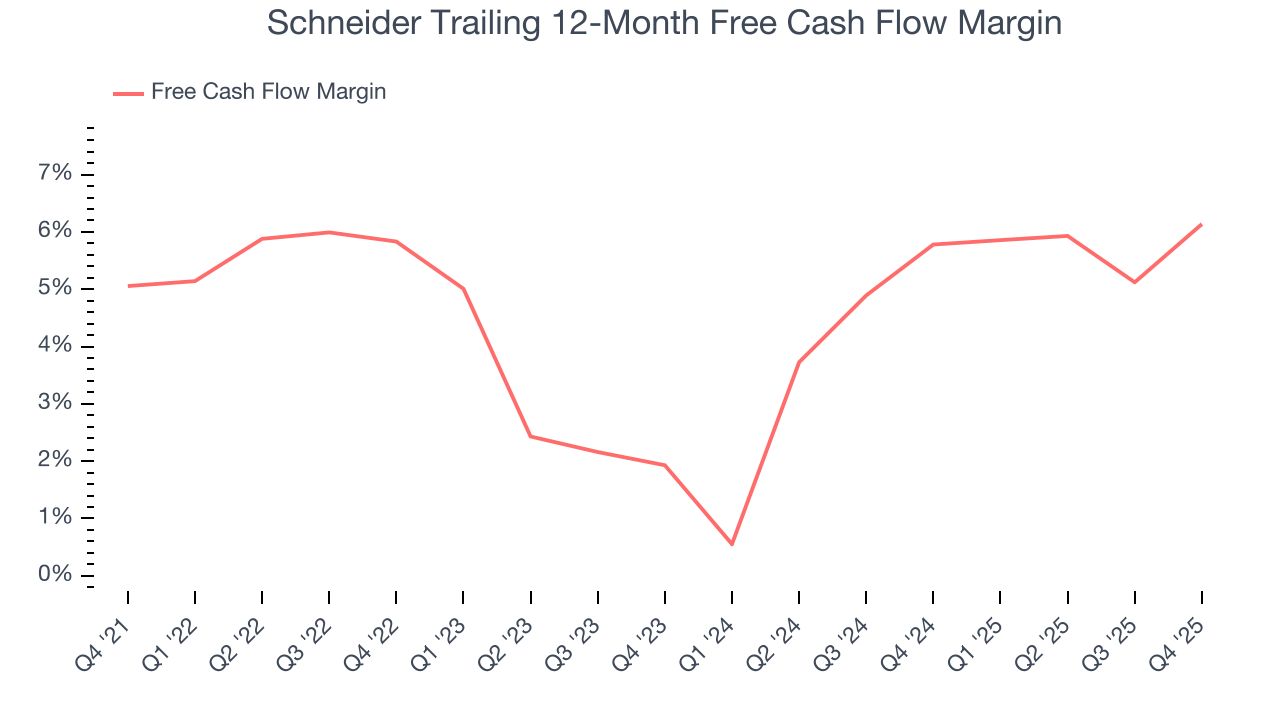
Schneider’s free cash flow clocked in at $154.5 million in Q4, equivalent to a 11% margin. This result was good as its margin was 4 percentage points higher than in the same quarter last year, building on its favorable historical trend.
10. Return on Invested Capital (ROIC)
EPS and free cash flow tell us whether a company was profitable while growing its revenue. But was it capital-efficient? A company’s ROIC explains this by showing how much operating profit it makes compared to the money it has raised (debt and equity).
Schneider’s management team makes decent investment decisions and generates value for shareholders. Its five-year average ROIC was 10.8%, slightly better than typical industrials business.
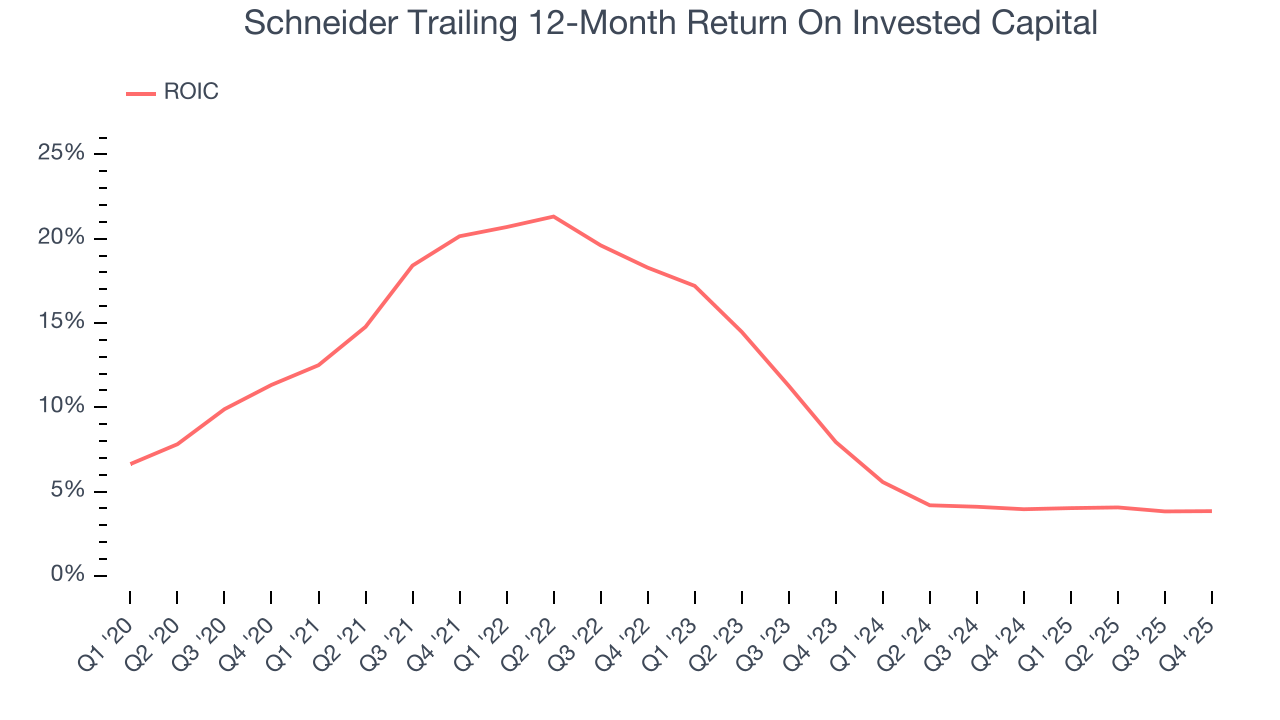
We like to invest in businesses with high returns, but the trend in a company’s ROIC is what often surprises the market and moves the stock price. Over the last few years, Schneider’s ROIC has unfortunately decreased significantly. We like what management has done in the past, but its declining returns are perhaps a symptom of fewer profitable growth opportunities.
11. Balance Sheet Assessment
Schneider reported $201.5 million of cash and $402 million of debt on its balance sheet in the most recent quarter. As investors in high-quality companies, we primarily focus on two things: 1) that a company’s debt level isn’t too high and 2) that its interest payments are not excessively burdening the business.
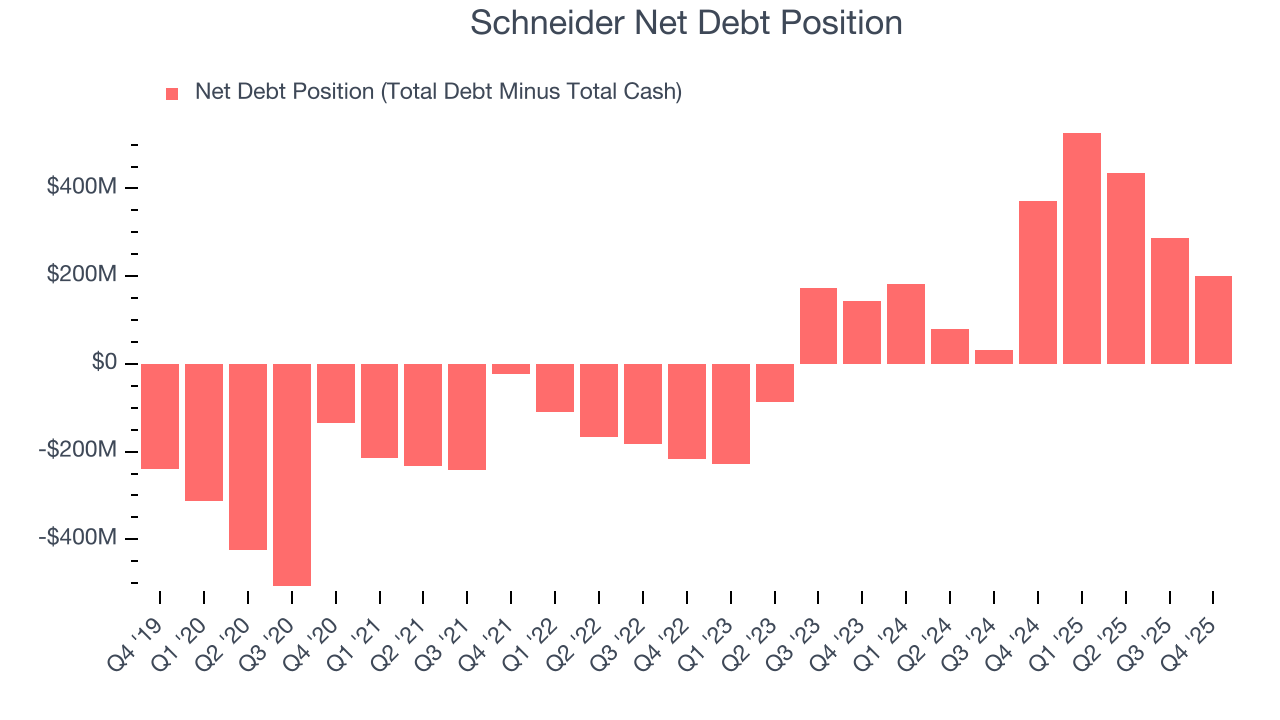
With $623.5 million of EBITDA over the last 12 months, we view Schneider’s 0.3× net-debt-to-EBITDA ratio as safe. We also see its $15.1 million of annual interest expenses as appropriate. The company’s profits give it plenty of breathing room, allowing it to continue investing in growth initiatives.
12. Key Takeaways from Schneider’s Q4 Results
We struggled to find many positives in these results. Its full-year EPS guidance missed and its Truckload revenue fell short of Wall Street’s estimates. Overall, this was a softer quarter. The stock traded down 12.8% to $25.91 immediately following the results.
13. Is Now The Time To Buy Schneider?
Updated: March 14, 2026 at 11:51 PM EDT
We think that the latest earnings result is only one piece of the bigger puzzle. If you’re deciding whether to own Schneider, you should also grasp the company’s longer-term business quality and valuation.
Schneider falls short of our quality standards. To kick things off, its revenue growth was uninspiring over the last five years, and analysts expect its demand to deteriorate over the next 12 months. While its projected EPS for the next year implies the company’s fundamentals will improve, the downside is its diminishing returns show management's prior bets haven't worked out. On top of that, its declining EPS over the last five years makes it a less attractive asset to the public markets.
Schneider’s P/E ratio based on the next 12 months is 28.1x. This multiple tells us a lot of good news is priced in - you can find more timely opportunities elsewhere.
Wall Street analysts have a consensus one-year price target of $28.27 on the company (compared to the current share price of $23.71).
Although the price target is bullish, readers should exercise caution because analysts tend to be overly optimistic. The firms they work for, often big banks, have relationships with companies that extend into fundraising, M&A advisory, and other rewarding business lines. As a result, they typically hesitate to say bad things for fear they will lose out. We at StockStory do not suffer from such conflicts of interest, so we’ll always tell it like it is.