
1. News


2. Summary
Why S&P Global Is Interesting
Tracing its roots back to 1860 when it published the first railroad industry manual, S&P Global (NYSE:SPGI) provides credit ratings, market intelligence, commodity data, automotive analytics, and financial indices that help investors and businesses make decisions.
- Stellar return on equity showcases management’s ability to surface highly profitable business ventures
- A downside is its the company has faced growth challenges as its 6.6% annual revenue increases over the last five years fell short of other financials companies


S&P Global has the potential to be a high-quality business. This company is certainly worth watching.
Why Should You Watch S&P Global


S&P Global is trading at $405.15 per share, or 21x forward P/E. This valuation represents a premium to financials peers.
If S&P Global strings together a few solid quarters and proves it can be a high-quality company, we’d be more open to investing.
3. S&P Global (SPGI) Research Report: Q4 CY2025 Update
Financial intelligence company S&P Global (NYSE:SPGI) met Wall Street’s revenue expectations in Q4 CY2025, with sales up 9% year on year to $3.92 billion. Its non-GAAP profit of $4.30 per share was 0.8% below analysts’ consensus estimates.
S&P Global (SPGI) Q4 CY2025 Highlights:
- Revenue: $3.92 billion vs analyst estimates of $3.90 billion (9% year-on-year growth, in line)
- Pre-tax Profit: $1.63 billion (41.6% margin)
- Adjusted EPS: $4.30 vs analyst expectations of $4.34 (0.8% miss)
- Management raised its full-year Adjusted EPS guidance to $19.53 at the midpoint, a 10.2% increase
- Market Capitalization: $134.5 billion
Company Overview
Tracing its roots back to 1860 when it published the first railroad industry manual, S&P Global (NYSE:SPGI) provides credit ratings, market intelligence, commodity data, automotive analytics, and financial indices that help investors and businesses make decisions.
S&P Global operates through five main business segments that serve the global capital, commodity, and automotive markets. The Market Intelligence segment delivers data, research, and analytics to investment professionals, corporations, and government agencies through platforms like Capital IQ Pro, helping them track performance, identify investment opportunities, and manage risk. The Ratings segment provides independent credit ratings on corporations, governments, and various debt instruments, serving as a critical tool for investors evaluating fixed income investments.
The Commodity Insights segment offers price assessments, benchmarks, and analysis for energy, metals, agriculture, and other commodity markets. This information helps producers, traders, and buyers make informed decisions in volatile markets. The Mobility segment serves the automotive industry with data and analytics spanning the entire value chain, from manufacturers to dealers and financial institutions, providing insights on vehicle sales, production forecasts, and consumer behavior.
The Indices segment maintains widely-used benchmarks like the S&P 500, generating revenue when financial products like ETFs track these indices. For example, when an investor buys shares in an S&P 500 ETF, the fund pays S&P Global a fee based on assets under management. The company also licenses its indices for derivatives trading and sells data subscriptions to financial professionals who need benchmark information for portfolio management.
4. Financial Exchanges & Data
Financial exchanges and data providers operate trading platforms and sell market information. They enjoy relatively stable revenue from trading fees and subscriptions, increasing demand for data analytics, and expansion opportunities in emerging markets. Challenges include regulatory oversight of market structure, competition from alternative trading venues, and substantial technology investments needed to maintain low-latency trading infrastructure and data security.
S&P Global's competitors include Moody's Corporation (NYSE:MCO) and Fitch Group in credit ratings, MSCI Inc. (NYSE:MSCI) and FTSE Russell in indices, FactSet Research Systems (NYSE:FDS) and Bloomberg LP in market data and analytics, and IHS Markit (now part of S&P Global) previously competed in certain segments.
5. Revenue Growth
Reviewing a company’s long-term sales performance reveals insights into its quality. Even a bad business can shine for one or two quarters, but a top-tier one grows for years. Regrettably, S&P Global’s revenue grew at a mediocre 6.6% compounded annual growth rate over the last five years. This wasn’t a great result compared to the rest of the financials sector, but there are still things to like about S&P Global.
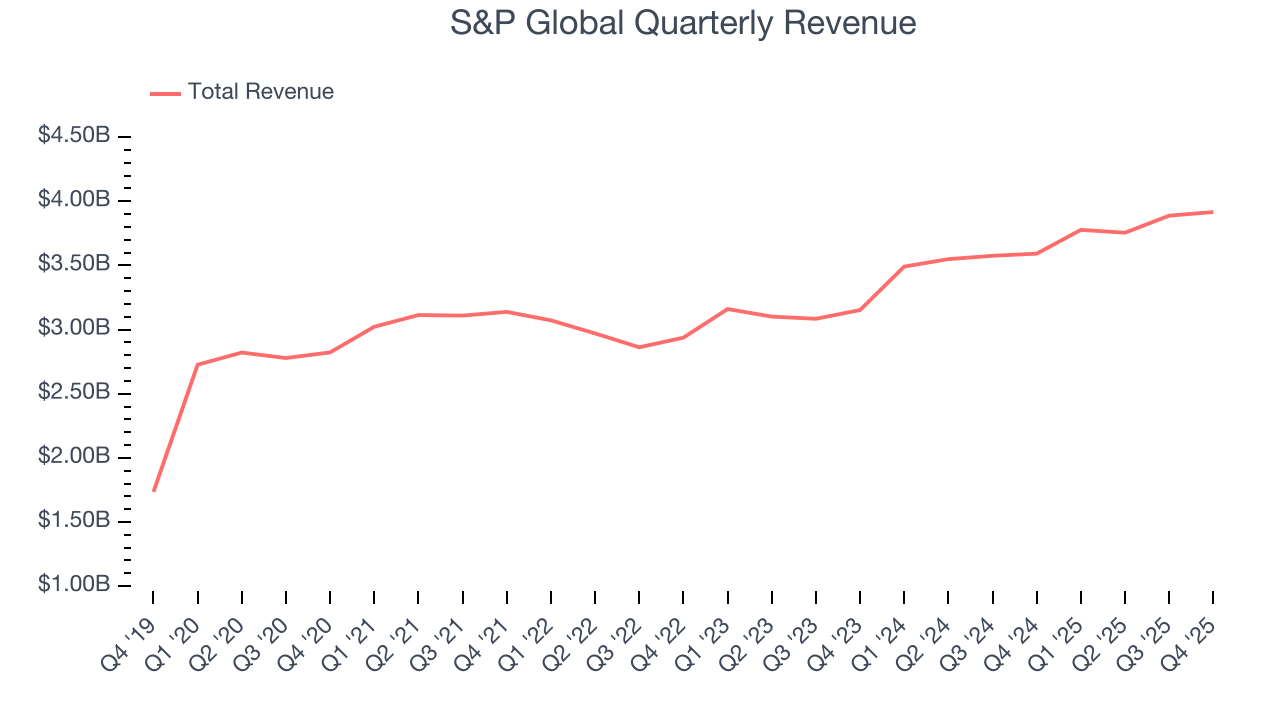
Long-term growth is the most important, but within financials, a half-decade historical view may miss recent interest rate changes and market returns. S&P Global’s annualized revenue growth of 10.8% over the last two years is above its five-year trend, suggesting some bright spots. 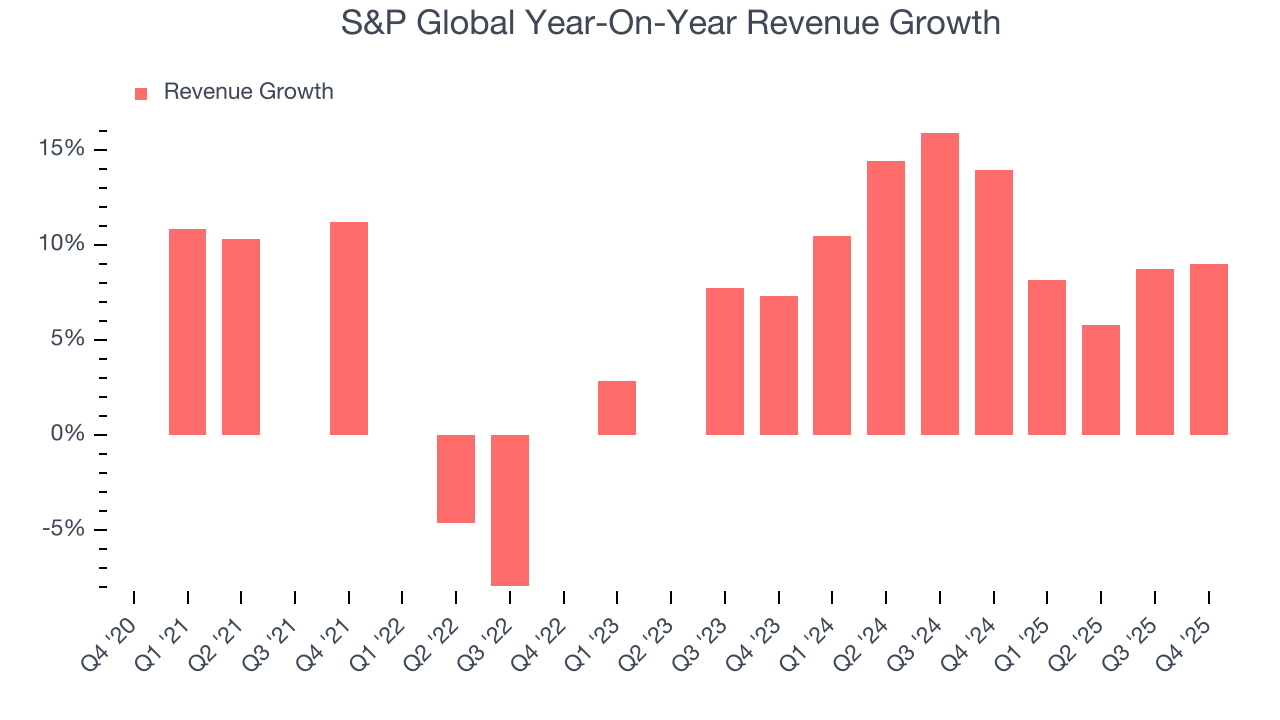 Note: Quarters not shown were determined to be outliers, impacted by outsized investment gains/losses that are not indicative of the recurring fundamentals of the business.
This quarter, S&P Global grew its revenue by 9% year on year, and its $3.92 billion of revenue was in line with Wall Street’s estimates.
6. Pre-Tax Profit Margin
Revenue growth is one major determinant of business quality, and the efficiency of operations is another. For Financial Exchanges & Data companies, we look at pre-tax profit rather than the operating margin that defines sectors such as consumer, tech, and industrials.
This is because for financials businesses, interest income and expense should be factored into the definition of profit but taxes - which are largely out of a company's control - should not.
Over the last five years, S&P Global’s pre-tax profit margin has fallen by 11.6 percentage points, going from 33.6% to 40.6%. It has also expanded by 11.2 percentage points on a two-year basis, showing its expenses have consistently grown at a slower rate than revenue. This typically signals prudent management.
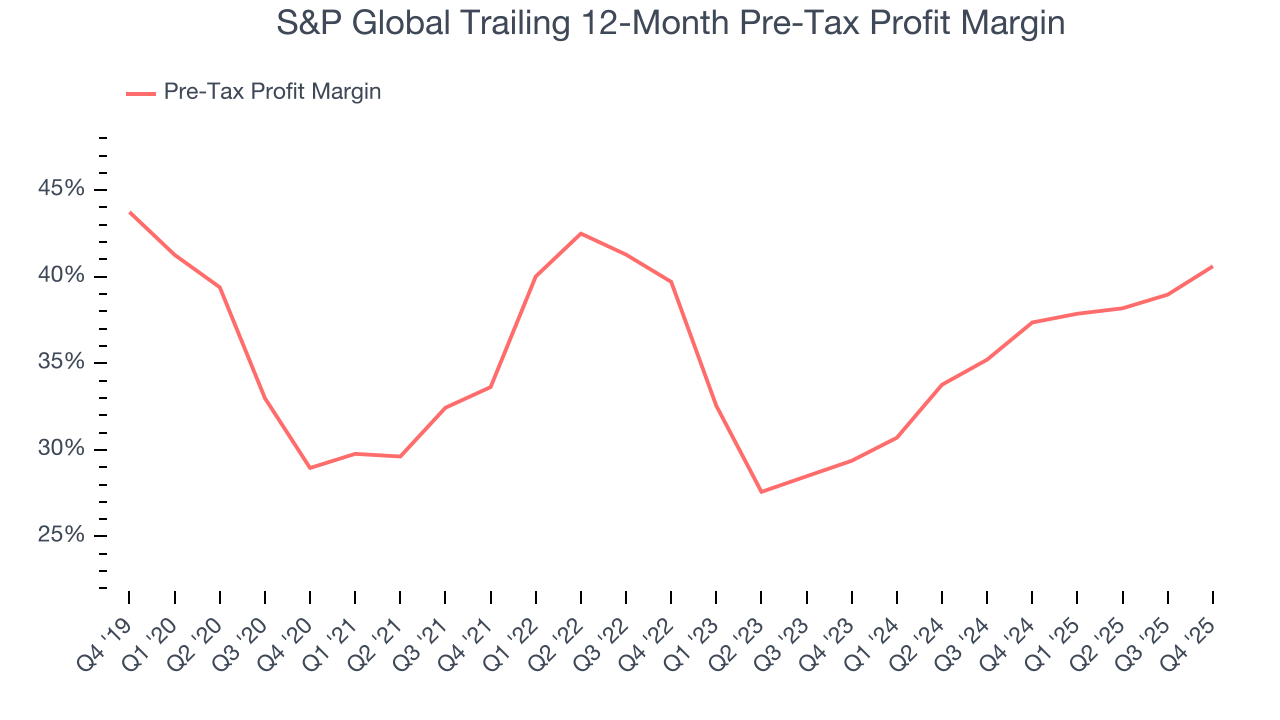
S&P Global’s pre-tax profit margin came in at 41.6% this quarter. This result was 6.7 percentage points better than the same quarter last year.
7. Earnings Per Share
Revenue trends explain a company’s historical growth, but the long-term change in earnings per share (EPS) points to the profitability of that growth – for example, a company could inflate its sales through excessive spending on advertising and promotions.
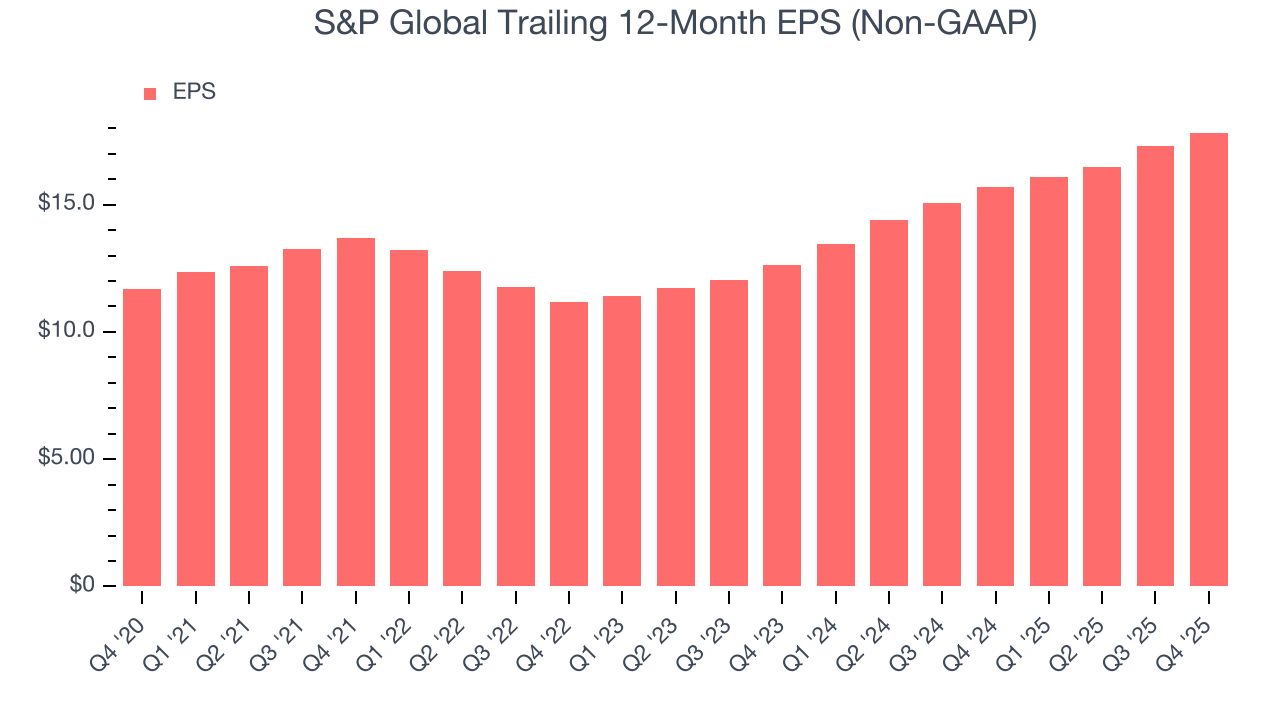
S&P Global’s EPS grew at an unimpressive 8.8% compounded annual growth rate over the last five years. On the bright side, this performance was better than its 6.6% annualized revenue growth and tells us the company became more profitable on a per-share basis as it expanded.
Like with revenue, we analyze EPS over a more recent period because it can provide insight into an emerging theme or development for the business.
For S&P Global, its two-year annual EPS growth of 18.9% was higher than its five-year trend. This acceleration made it one of the faster-growing financials companies in recent history.
In Q4, S&P Global reported adjusted EPS of $4.30, up from $3.77 in the same quarter last year. This print was close to analysts’ estimates. Over the next 12 months, Wall Street expects S&P Global’s full-year EPS of $17.83 to grow 12.1%.
8. Return on Equity
Return on equity (ROE) reveals the profit generated per dollar of shareholder equity, which represents a key source of bank funding. Banks maintaining elevated ROE levels tend to accelerate wealth creation for shareholders via earnings retention, buybacks, and distributions.
Over the last five years, S&P Global has averaged an ROE of 23.8%, exceptional for a company operating in a sector where the average shakes out around 10% and those putting up 25%+ are greatly admired. This shows S&P Global has a strong competitive moat.
9. Balance Sheet Assessment
The debt-to-equity ratio is a widely used measure to assess a company's balance sheet health. A higher ratio means that a business aggressively financed its growth with debt. This can result in higher earnings (if the borrowed funds are invested profitably) but also increases risk.
If debt levels are too high, there could be difficulties in meeting obligations, especially during economic downturns or periods of rising interest rates if the debt has variable-rate payments.
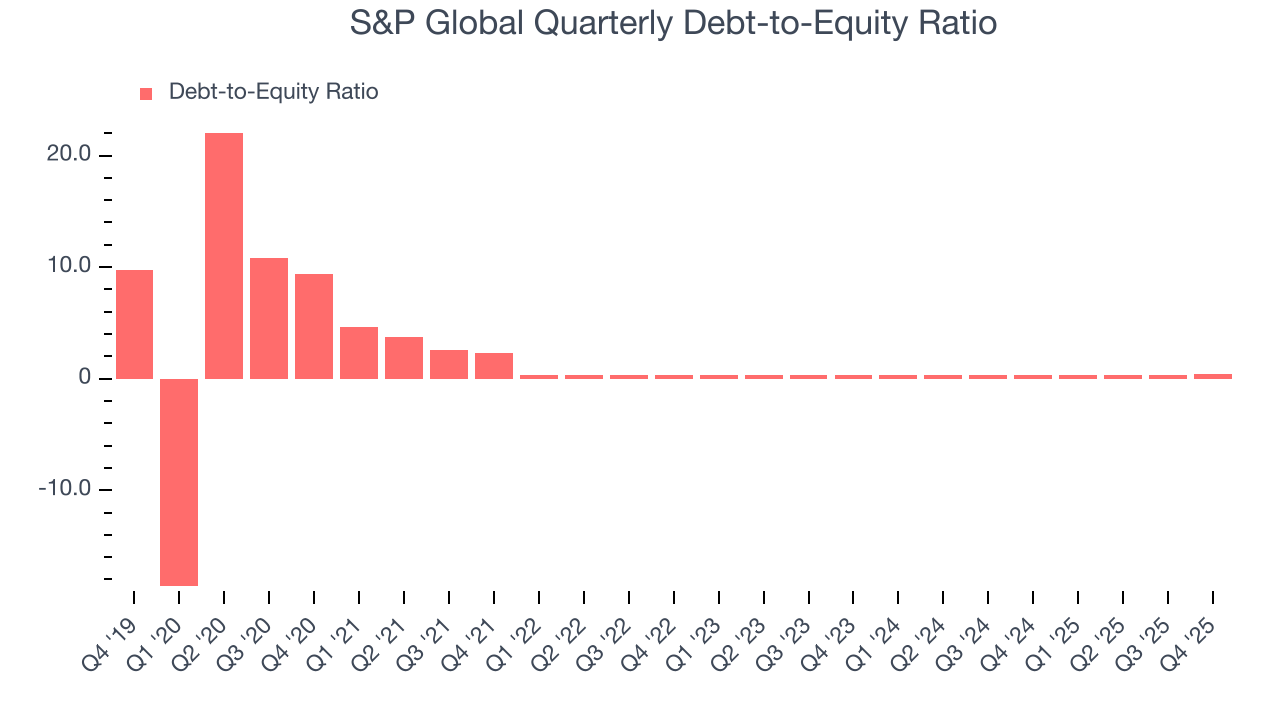
S&P Global currently has $13.58 billion of debt and $31.24 billion of shareholder's equity on its balance sheet, and over the past four quarters, has averaged a debt-to-equity ratio of 0.4×. We think this is safe and raises no red flags. In general, we’re comfortable with any ratio below 3.5× for a financials business.
10. Key Takeaways from S&P Global’s Q4 Results
We struggled to find many positives in these results. Overall, this was a weaker quarter. The stock traded down 15.8% to $373.88 immediately following the results.
11. Is Now The Time To Buy S&P Global?
Updated: March 30, 2026 at 12:10 AM EDT
We think that the latest earnings result is only one piece of the bigger puzzle. If you’re deciding whether to own S&P Global, you should also grasp the company’s longer-term business quality and valuation.
In our opinion, S&P Global is a solid company. Although its revenue growth was mediocre over the last five years, its expanding pre-tax profit margin shows the business has become more efficient. And while its unimpressive EPS growth over the last five years shows it’s failed to produce meaningful profits for shareholders, its stellar ROE suggests it has been a well-run company historically.
S&P Global’s P/E ratio based on the next 12 months is 21x. This multiple tells us that a lot of good news is priced in. This is a good one to add to your watchlist - there are better opportunities elsewhere at the moment.
Wall Street analysts have a consensus one-year price target of $538.52 on the company (compared to the current share price of $405.15).