
S&P Global (SPGI)
We like S&P Global. Its stellar 25.8% ROE illustrates management’s exceptional investing abilities.― StockStory Analyst Team
1. News


2. Summary
Why We Like S&P Global
Tracing its roots back to 1860 when it published the first railroad industry manual, S&P Global (NYSE:SPGI) provides credit ratings, market intelligence, commodity data, automotive analytics, and financial indices that help investors and businesses make decisions.
- Stellar return on equity showcases management’s ability to surface highly profitable business ventures
- Additional sales over the last two years increased its profitability as the 20% annual growth in its earnings per share outpaced its revenue
- Decent 10.6% annual revenue growth over the last two years beat most of its peers, showing customers find value in its products and services


S&P Global is a top-tier company. There’s a lot to like here.
Is Now The Time To Buy S&P Global?


S&P Global’s stock price of $532.97 implies a valuation ratio of 27.9x forward P/E. There are high expectations given this pricey multiple; we can’t deny that.
Are you a fan of the company and its story? If so, we suggest a small position as the long-term outlook seems promising. Be aware that S&P Global’s premium valuation could result in choppy short-term stock performance.
3. S&P Global (SPGI) Research Report: Q3 CY2025 Update
Financial intelligence company S&P Global (NYSE:SPGI) beat Wall Street’s revenue expectations in Q3 CY2025, with sales up 8.8% year on year to $3.89 billion. Its non-GAAP profit of $4.73 per share was 7.3% above analysts’ consensus estimates.
S&P Global (SPGI) Q3 CY2025 Highlights:
- Revenue: $3.89 billion vs analyst estimates of $3.85 billion (8.8% year-on-year growth, 1.1% beat)
- Pre-tax Profit: $1.60 billion (41.1% margin, 17.5% year-on-year growth)
- Adjusted EPS: $4.73 vs analyst estimates of $4.41 (7.3% beat)
- Adjusted EPS guidance for the upcoming financial year 2026 is $17.73 at the midpoint, beating analyst estimates by 2%
- Market Capitalization: $144.4 billion
Company Overview
Tracing its roots back to 1860 when it published the first railroad industry manual, S&P Global (NYSE:SPGI) provides credit ratings, market intelligence, commodity data, automotive analytics, and financial indices that help investors and businesses make decisions.
S&P Global operates through five main business segments that serve the global capital, commodity, and automotive markets. The Market Intelligence segment delivers data, research, and analytics to investment professionals, corporations, and government agencies through platforms like Capital IQ Pro, helping them track performance, identify investment opportunities, and manage risk. The Ratings segment provides independent credit ratings on corporations, governments, and various debt instruments, serving as a critical tool for investors evaluating fixed income investments.
The Commodity Insights segment offers price assessments, benchmarks, and analysis for energy, metals, agriculture, and other commodity markets. This information helps producers, traders, and buyers make informed decisions in volatile markets. The Mobility segment serves the automotive industry with data and analytics spanning the entire value chain, from manufacturers to dealers and financial institutions, providing insights on vehicle sales, production forecasts, and consumer behavior.
The Indices segment maintains widely-used benchmarks like the S&P 500, generating revenue when financial products like ETFs track these indices. For example, when an investor buys shares in an S&P 500 ETF, the fund pays S&P Global a fee based on assets under management. The company also licenses its indices for derivatives trading and sells data subscriptions to financial professionals who need benchmark information for portfolio management.
4. Financial Exchanges & Data
Financial exchanges and data providers operate trading platforms and sell market information. They enjoy relatively stable revenue from trading fees and subscriptions, increasing demand for data analytics, and expansion opportunities in emerging markets. Challenges include regulatory oversight of market structure, competition from alternative trading venues, and substantial technology investments needed to maintain low-latency trading infrastructure and data security.
S&P Global's competitors include Moody's Corporation (NYSE:MCO) and Fitch Group in credit ratings, MSCI Inc. (NYSE:MSCI) and FTSE Russell in indices, FactSet Research Systems (NYSE:FDS) and Bloomberg LP in market data and analytics, and IHS Markit (now part of S&P Global) previously competed in certain segments.
5. Revenue Growth
A company’s long-term performance is an indicator of its overall quality. Any business can put up a good quarter or two, but many enduring ones grow for years. Thankfully, S&P Global’s 15.5% annualized revenue growth over the last five years was impressive. Its growth surpassed the average financials company and shows its offerings resonate with customers, a great starting point for our analysis.
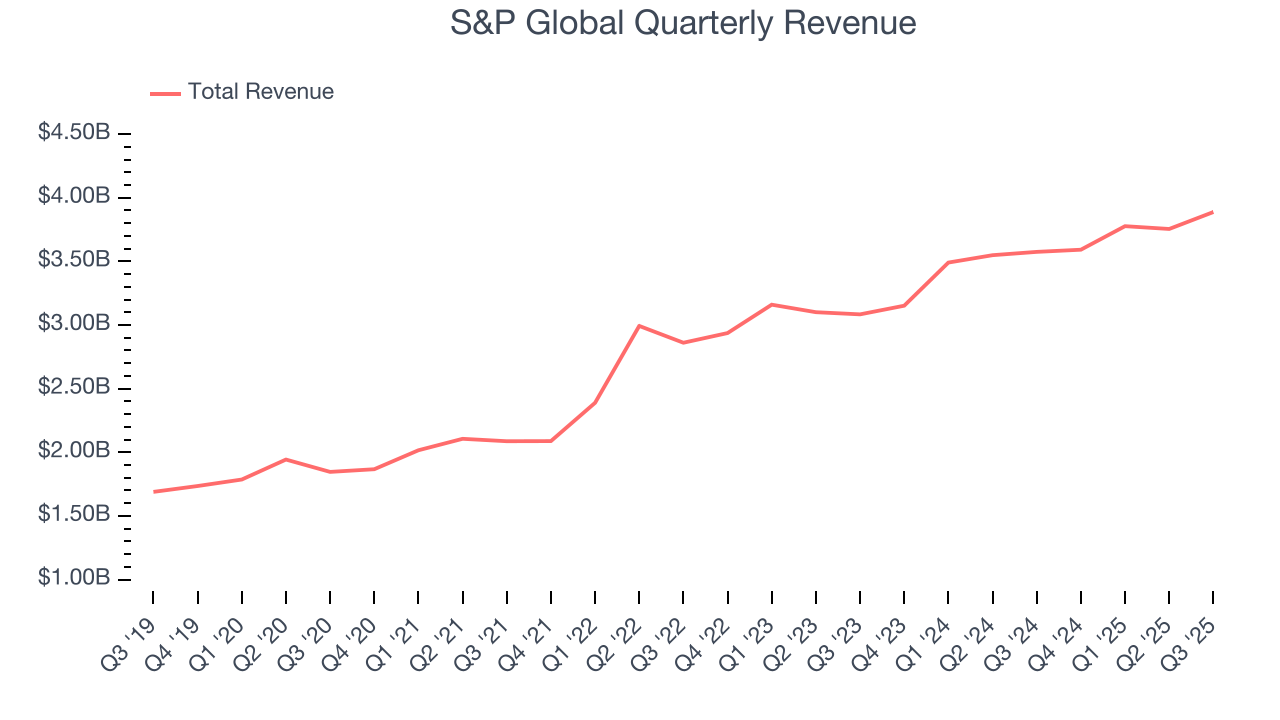
We at StockStory place the most emphasis on long-term growth, but within financials, a half-decade historical view may miss recent interest rate changes, market returns, and industry trends. S&P Global’s annualized revenue growth of 10.6% over the last two years is below its five-year trend, but we still think the results were respectable. 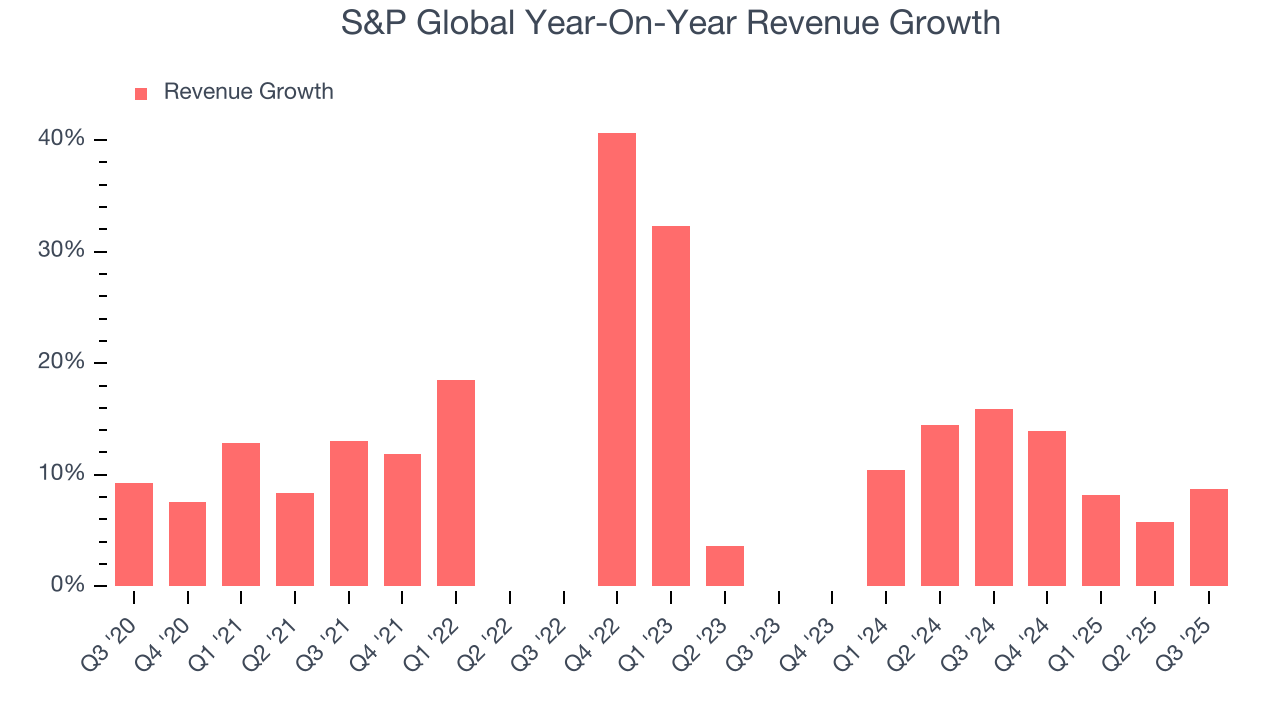 Note: Quarters not shown were determined to be outliers, impacted by outsized investment gains/losses that are not indicative of the recurring fundamentals of the business.
This quarter, S&P Global reported year-on-year revenue growth of 8.8%, and its $3.89 billion of revenue exceeded Wall Street’s estimates by 1.1%.
6. Pre-Tax Profit Margin
Revenue growth is one major determinant of business quality, and the efficiency of operations is another. For Financial Exchanges & Data companies, we look at pre-tax profit rather than the operating margin that defines sectors such as consumer, tech, and industrials.
This is because for financials businesses, interest income and expense should be factored into the definition of profit but taxes - which are largely out of a company's control - should not.
Over the last four years, S&P Global’s pre-tax profit margin has risen by 9.5 percentage points, going from 48.5% to 39%. Luckily, it seems the company has recently taken steps to address its expense base as its pre-tax profit margin expanded by 10.5 percentage points on a two-year basis.
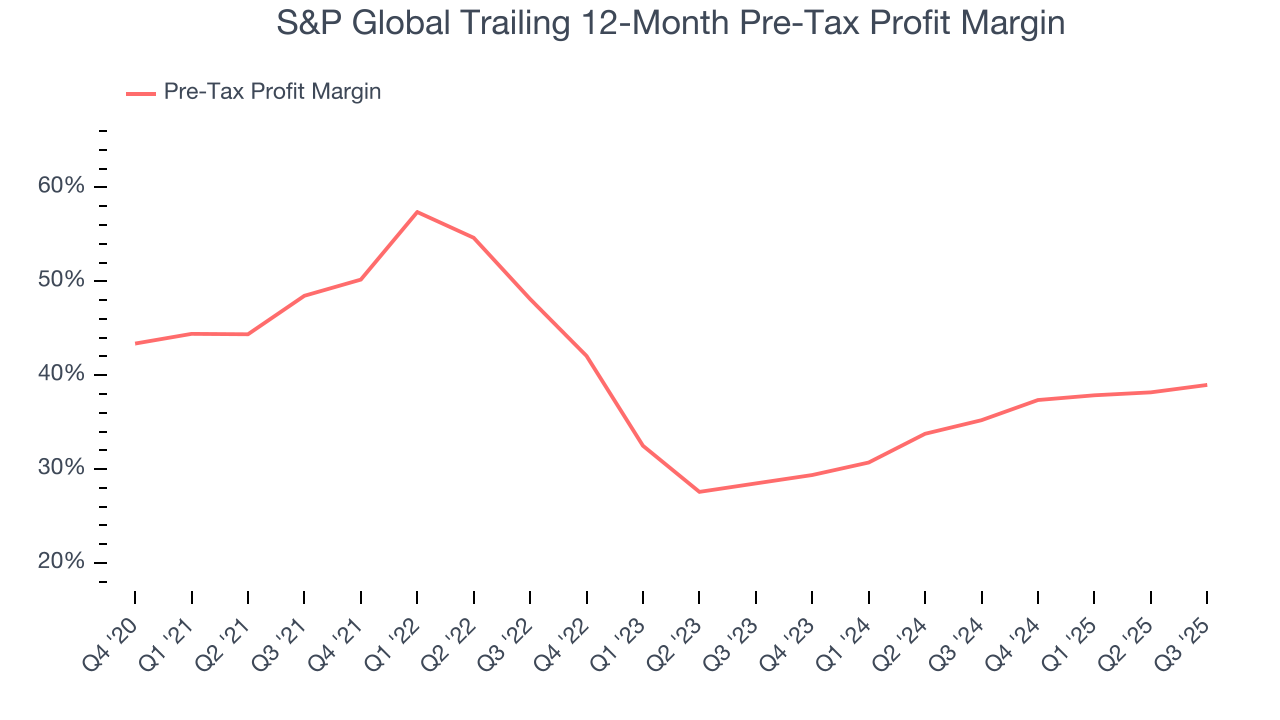
S&P Global’s pre-tax profit margin came in at 41.1% this quarter. This result was 3.1 percentage points better than the same quarter last year.
7. Earnings Per Share
We track the long-term change in earnings per share (EPS) for the same reason as long-term revenue growth. Compared to revenue, however, EPS highlights whether a company’s growth is profitable.
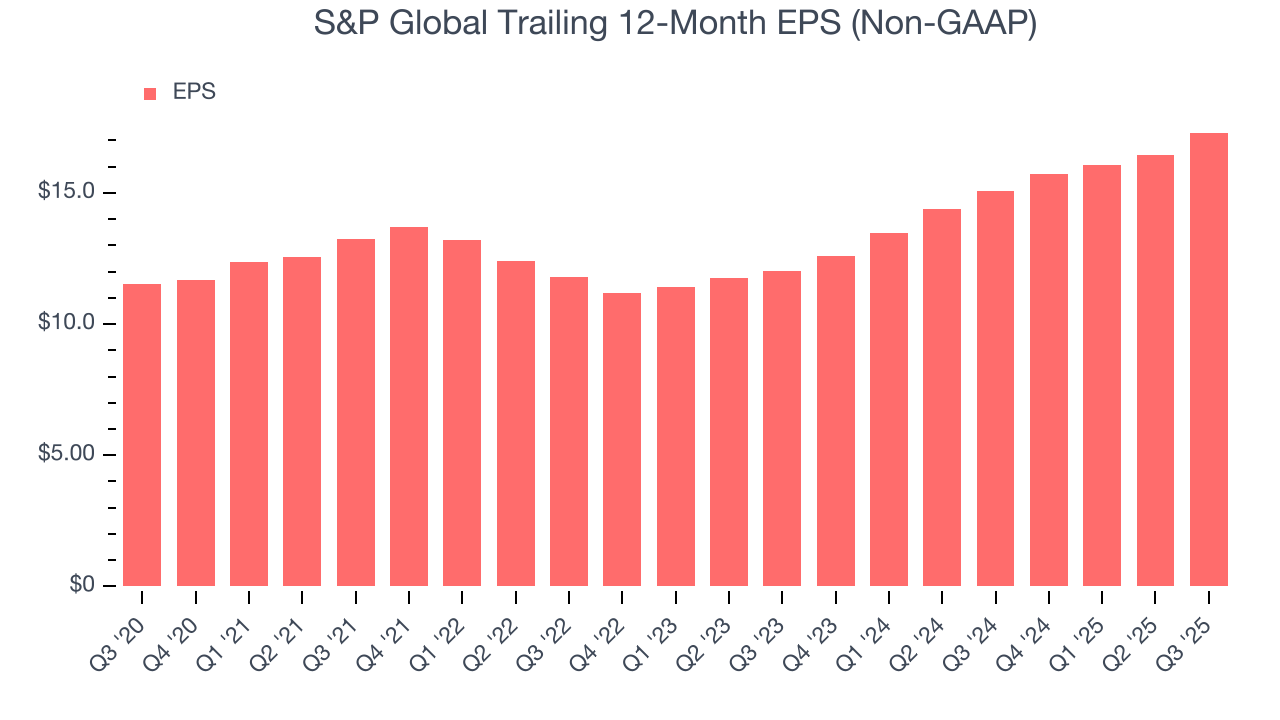
S&P Global’s EPS grew at an unimpressive 8.5% compounded annual growth rate over the last five years, lower than its 15.5% annualized revenue growth. However, its pre-tax profit margin actually improved during this time, telling us that non-fundamental factors such as interest expenses and taxes affected its ultimate earnings.
Like with revenue, we analyze EPS over a shorter period to see if we are missing a change in the business.
For S&P Global, its two-year annual EPS growth of 20% was higher than its five-year trend. This acceleration made it one of the faster-growing financials companies in recent history.
In Q3, S&P Global reported adjusted EPS of $4.73, up from $3.89 in the same quarter last year. This print beat analysts’ estimates by 7.3%. Over the next 12 months, Wall Street expects S&P Global’s full-year EPS of $17.30 to grow 8.9%.
8. Return on Equity
Return on equity, or ROE, tells us how much profit a company generates for each dollar of shareholder equity, a key funding source for banks. Over a long period, banks with high ROE tend to compound shareholder wealth faster through retained earnings, buybacks, and dividends.
Over the last five years, S&P Global has averaged an ROE of 26.4%, exceptional for a company operating in a sector where the average shakes out around 10% and those putting up 25%+ are greatly admired. This shows S&P Global has a strong competitive moat.
9. Balance Sheet Assessment
The debt-to-equity ratio is a widely used measure to assess a company's balance sheet health. A higher ratio means that a business aggressively financed its growth with debt. This can result in higher earnings (if the borrowed funds are invested profitably) but also increases risk.
If debt levels are too high, there could be difficulties in meeting obligations, especially during economic downturns or periods of rising interest rates if the debt has variable-rate payments.
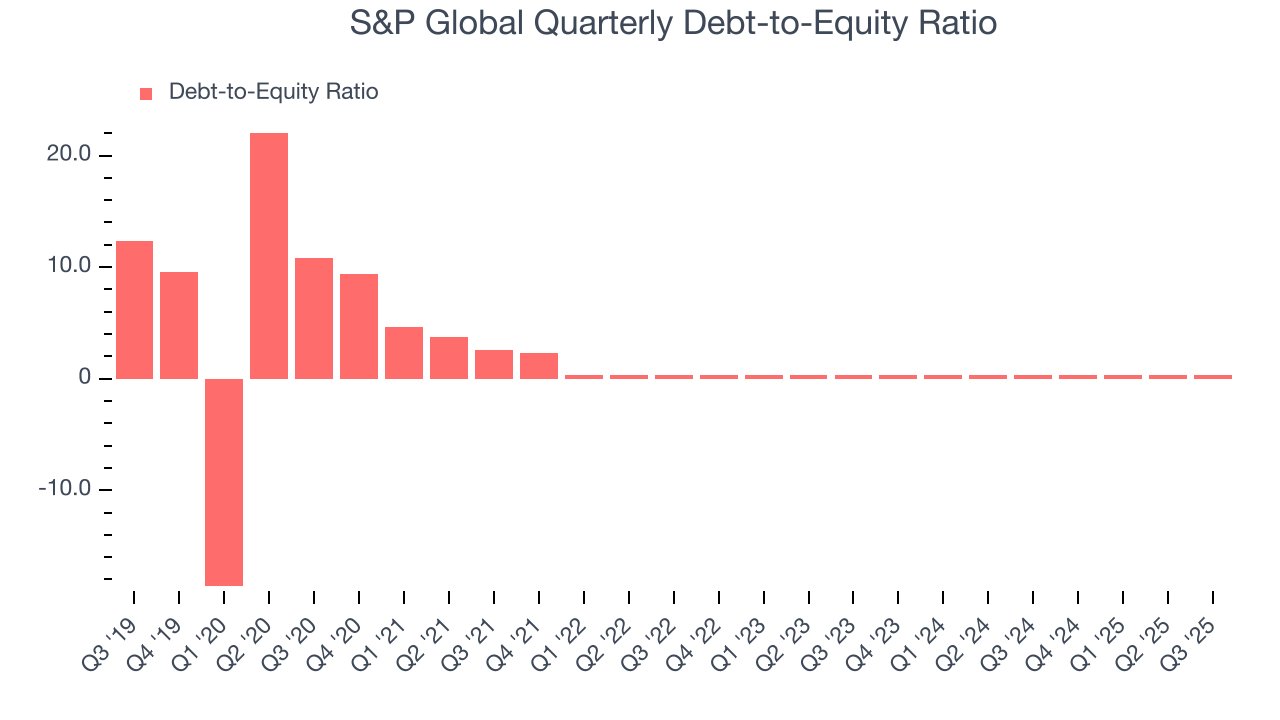
S&P Global currently has $11.87 billion of debt and $33.24 billion of shareholder's equity on its balance sheet, and over the past four quarters, has averaged a debt-to-equity ratio of 0.4×. We think this is safe and raises no red flags. In general, we’re comfortable with any ratio below 3.5× for a financials business.
10. Key Takeaways from S&P Global’s Q3 Results
It was encouraging to see S&P Global’s full-year EPS guidance beat analysts’ expectations. We were also glad its EPS outperformed Wall Street’s estimates. Overall, we think this was a solid quarter with some key areas of upside. The stock traded up 2.4% to $484.47 immediately after reporting.
11. Is Now The Time To Buy S&P Global?
Updated: January 24, 2026 at 11:27 PM EST
A common mistake we notice when investors are deciding whether to buy a stock or not is that they simply look at the latest earnings results. Business quality and valuation matter more, so we urge you to understand these dynamics as well.
S&P Global is a rock-solid business worth owning. For starters, its revenue growth was decent over the last five years, and analysts believe it can continue growing at these levels. On top of that, its stellar ROE suggests it has been a well-run company historically, and its expanding pre-tax profit margin shows the business has become more efficient.
S&P Global’s P/E ratio based on the next 12 months is 27.9x. Some good news is baked into the stock given its multiple, but we’ll happily own S&P Global as its fundamentals really stand out. It’s often wise to hold investments like this for at least three to five years, as the power of long-term compounding negates short-term price swings that can accompany relatively high valuations.
Wall Street analysts have a consensus one-year price target of $618.60 on the company (compared to the current share price of $532.97).