Stryker (SYK)
Stryker piques our interest. Its impressive margins shows it has disciplined controls and a highly efficient business.― StockStory Analyst Team
1. News


2. Summary
Why Stryker Is Interesting
With over 150 million patients impacted annually through its innovative healthcare technologies, Stryker (NYSE:SYK) develops and manufactures advanced medical devices and equipment across orthopedics, surgical tools, neurotechnology, and patient care solutions.
- Earnings growth has trumped its peers over the last five years as its EPS has compounded at 13.1% annually
- Disciplined cost controls and effective management have materialized in a strong adjusted operating margin
- The stock is trading at a reasonable price if you like its story and growth prospects


Stryker has some respectable qualities. If you like the company, the valuation seems fair.
Why Is Now The Time To Buy Stryker?


Stryker is trading at $352.80 per share, or 24.7x forward P/E. When stacked up against other healthcare companies, we think Stryker’s multiple is fair for the fundamentals you get.
If you think the market is not giving the company enough credit for its fundamentals, now could be a good time to invest.
3. Stryker (SYK) Research Report: Q3 CY2025 Update
Medical technology company Stryker (NYSE:SYK) met Wall Streets revenue expectations in Q3 CY2025, with sales up 10.2% year on year to $6.06 billion. Its non-GAAP profit of $3.19 per share was 1.9% above analysts’ consensus estimates.
Stryker (SYK) Q3 CY2025 Highlights:
- Revenue: $6.06 billion vs analyst estimates of $6.03 billion (10.2% year-on-year growth, in line)
- Adjusted EPS: $3.19 vs analyst estimates of $3.13 (1.9% beat)
- Management slightly raised its full-year Adjusted EPS guidance to $13.55 at the midpoint
- Operating Margin: 18.7%, down from 19.7% in the same quarter last year
- Free Cash Flow Margin: 22.3%, down from 23.7% in the same quarter last year
- Organic Revenue rose 9.5% year on year vs analyst estimates of 9% growth (46.7 basis point beat)
- Market Capitalization: $141.3 billion
Company Overview
With over 150 million patients impacted annually through its innovative healthcare technologies, Stryker (NYSE:SYK) develops and manufactures advanced medical devices and equipment across orthopedics, surgical tools, neurotechnology, and patient care solutions.
Stryker operates through two main segments: MedSurg and Neurotechnology, and Orthopaedics. The MedSurg and Neurotechnology division provides surgical equipment, endoscopic systems, patient handling devices, emergency medical equipment, and neurosurgical products. The Orthopaedics segment focuses on implants for joint replacements and trauma surgeries.
A distinguishing feature of Stryker's product lineup is its Mako SmartRobotics system, which assists surgeons in performing precise joint replacement procedures. For example, an orthopedic surgeon might use Mako's robotic-arm technology to create a personalized surgical plan for a patient's knee replacement, with the system providing real-time feedback during surgery to ensure optimal implant positioning.
The company's revenue comes primarily from selling its products directly to healthcare providers, including hospitals, surgical centers, and physicians. Stryker also offers navigation systems that help surgeons perform minimally invasive procedures with greater accuracy, and clinical communication platforms that enhance coordination among healthcare teams.
Stryker maintains a global presence, selling products in approximately 75 countries through company-owned subsidiaries and third-party distributors. The company continuously expands its portfolio through both internal innovation and strategic acquisitions, such as Vertos Medical and care.ai, which have strengthened its positions in interventional pain management and virtual care technology, respectively.
The medical technology industry is heavily regulated, with Stryker's products subject to oversight by the FDA in the United States and similar agencies internationally. Many of Stryker's new products require regulatory clearance through processes like the 510(k) notification, while others need more extensive clinical testing and pre-market approval for specific surgical applications.
4. Medical Devices & Supplies - Diversified
The medical devices industry operates a business model that balances steady demand with significant investments in innovation and regulatory compliance. The industry benefits from recurring revenue streams tied to consumables, maintenance services, and incremental upgrades to the latest technologies. However, the capital-intensive nature of product development, coupled with lengthy regulatory pathways and the need for clinical validation, can weigh on profitability and timelines. In addition, there are constant pricing pressures from healthcare systems and insurers maximizing cost efficiency. Over the next several years, one tailwind is demographic–aging populations means rising chronic disease rates that drive greater demand for medical interventions and monitoring solutions. Advances in digital health, such as remote patient monitoring and smart devices, are also expected to unlock new demand by shortening upgrade cycles. On the other hand, the industry faces headwinds from pricing and reimbursement pressures as healthcare providers increasingly adopt value-based care models. Additionally, the integration of cybersecurity for connected devices adds further risk and complexity for device manufacturers.
Stryker competes with several major medical technology companies, including Zimmer Biomet Holdings, Johnson & Johnson MedTech, Medtronic, and Smith & Nephew in orthopedics and surgical instruments. In neurotechnology, its competitors include Medtronic, Johnson & Johnson MedTech, Terumo Corporation, and Penumbra.
5. Economies of Scale
Larger companies benefit from economies of scale, where fixed costs like infrastructure, technology, and administration are spread over a higher volume of goods or services, reducing the cost per unit. Scale can also lead to bargaining power with suppliers, greater brand recognition, and more investment firepower. A virtuous cycle can ensue if a scaled company plays its cards right.
With $24.38 billion in revenue over the past 12 months, Stryker sports economies of scale. This is important as it gives the company more leverage in a heavily regulated, competitive environment that is complex and resource-intensive.
6. Revenue Growth
A company’s long-term sales performance can indicate its overall quality. Any business can put up a good quarter or two, but many enduring ones grow for years. Luckily, Stryker’s sales grew at a decent 11.4% compounded annual growth rate over the last five years. Its growth was slightly above the average healthcare company and shows its offerings resonate with customers.
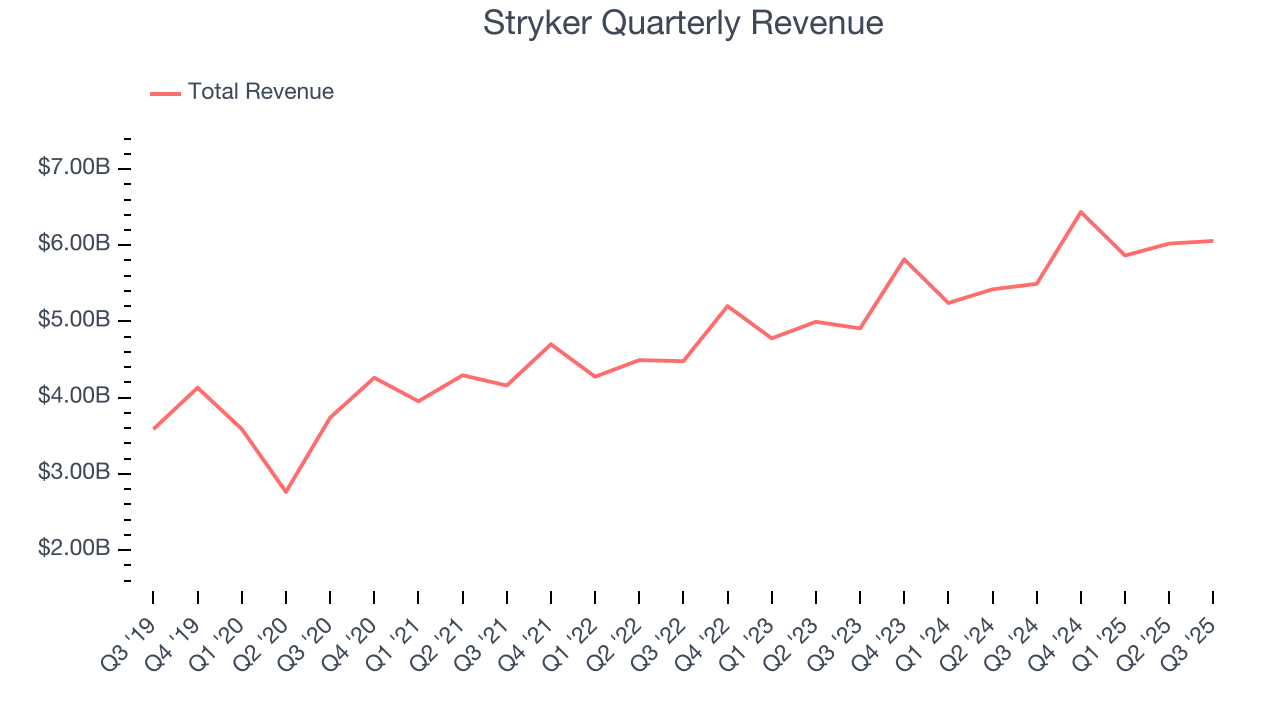
We at StockStory place the most emphasis on long-term growth, but within healthcare, a half-decade historical view may miss recent innovations or disruptive industry trends. Stryker’s annualized revenue growth of 10.7% over the last two years aligns with its five-year trend, suggesting its demand was stable. 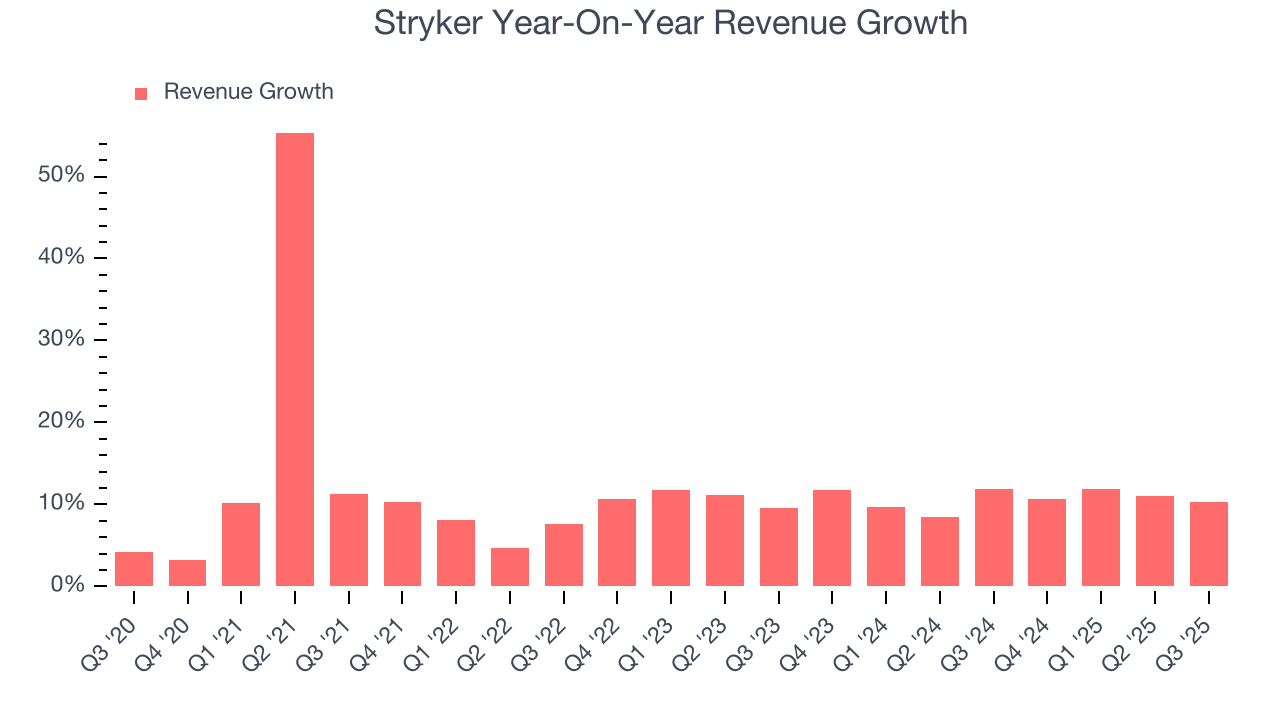
Stryker also reports organic revenue, which strips out one-time events like acquisitions and currency fluctuations that don’t accurately reflect its fundamentals. Over the last two years, Stryker’s organic revenue averaged 10.2% year-on-year growth. Because this number aligns with its two-year revenue growth, we can see the company’s core operations (not acquisitions and divestitures) drove most of its results. 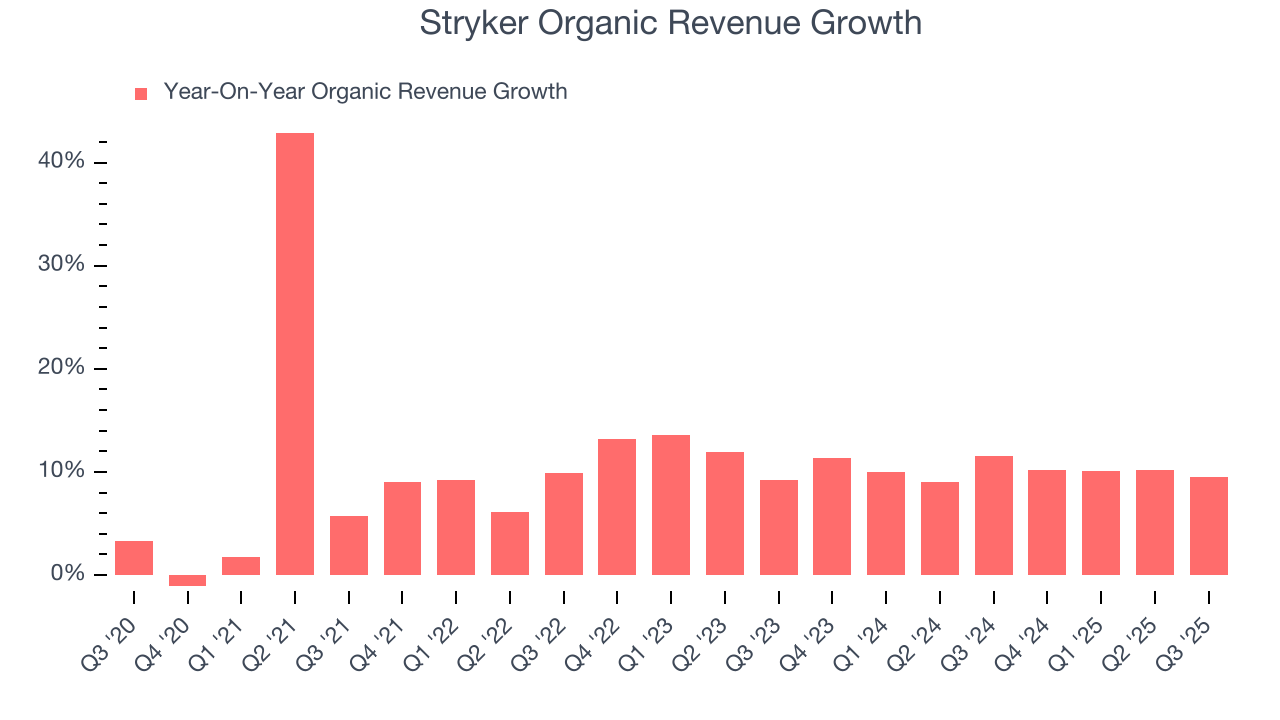
This quarter, Stryker’s year-on-year revenue growth was 10.2%, and its $6.06 billion of revenue was in line with Wall Street’s estimates.
Looking ahead, sell-side analysts expect revenue to grow 8.6% over the next 12 months, a slight deceleration versus the last two years. We still think its growth trajectory is attractive given its scale and indicates the market sees success for its products and services.
7. Operating Margin
Stryker’s operating margin might fluctuated slightly over the last 12 months but has generally stayed the same, averaging 16.7% over the last five years. This profitability was solid for a healthcare business and shows it’s an efficient company that manages its expenses well.
Looking at the trend in its profitability, Stryker’s operating margin of 15% for the trailing 12 months may be around the same as five years ago, but it has decreased by 2.3 percentage points over the last two years. Still, we’re optimistic that Stryker can correct course and expand its profitability on a longer-term horizon due to its business quality.
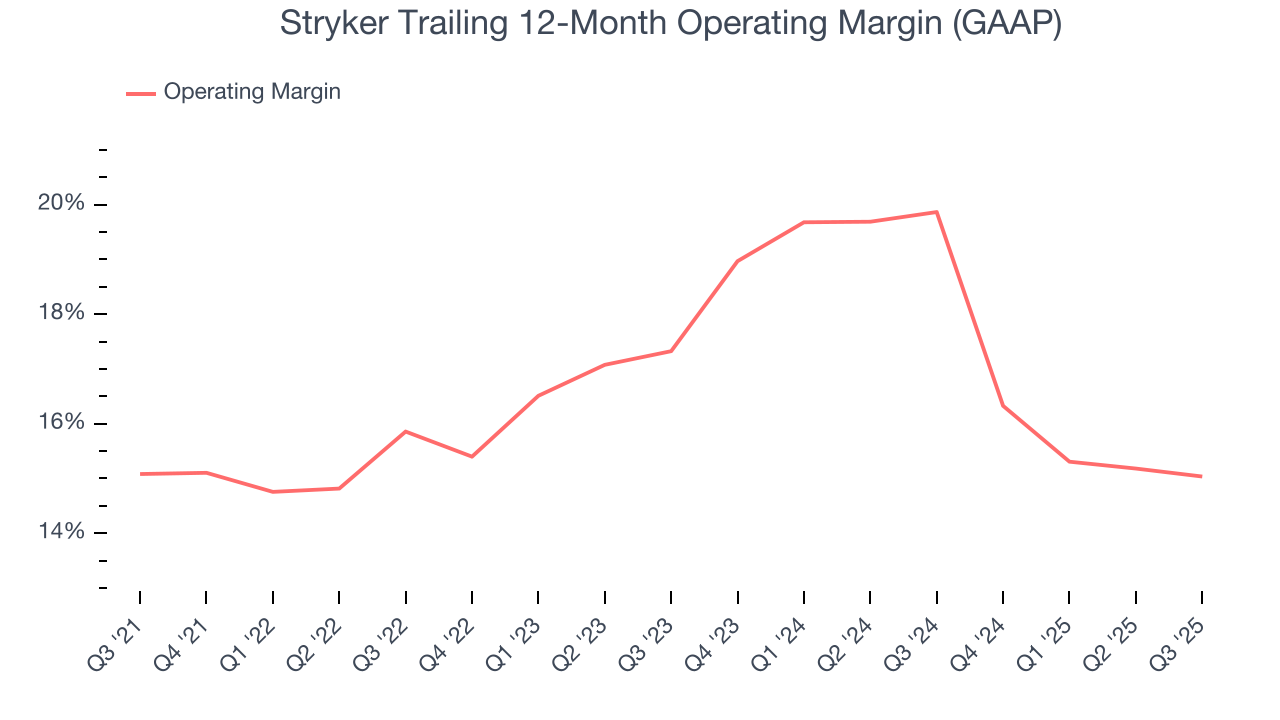
This quarter, Stryker generated an operating margin profit margin of 18.7%, down 1 percentage points year on year. This reduction is quite minuscule and indicates the company’s overall cost structure has been relatively stable.
8. Earnings Per Share
We track the long-term change in earnings per share (EPS) for the same reason as long-term revenue growth. Compared to revenue, however, EPS highlights whether a company’s growth is profitable.
Stryker’s spectacular 13.1% annual EPS growth over the last five years aligns with its revenue performance. This tells us it maintained its per-share profitability as it expanded.
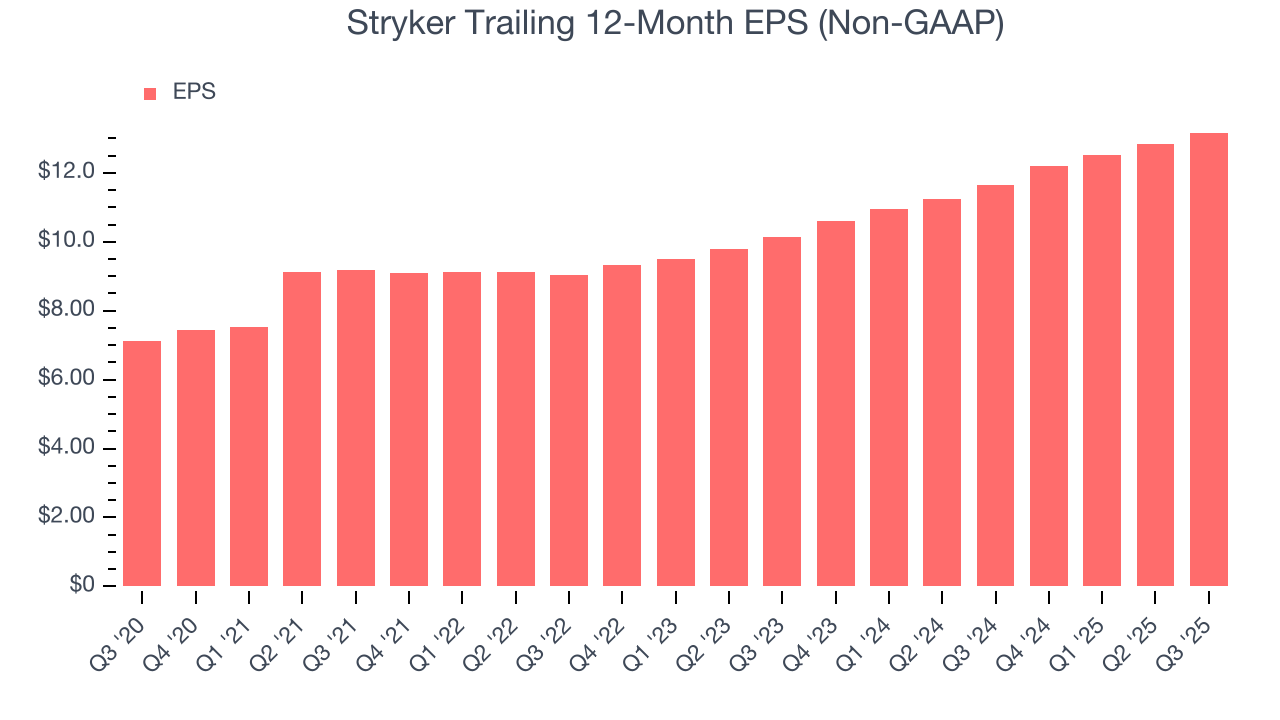
In Q3, Stryker reported adjusted EPS of $3.19, up from $2.87 in the same quarter last year. This print beat analysts’ estimates by 1.9%. Over the next 12 months, Wall Street expects Stryker’s full-year EPS of $13.17 to grow 10.2%.
9. Cash Is King
Free cash flow isn't a prominently featured metric in company financials and earnings releases, but we think it's telling because it accounts for all operating and capital expenses, making it tough to manipulate. Cash is king.
Stryker has shown impressive cash profitability, giving it the option to reinvest or return capital to investors. The company’s free cash flow margin averaged 14.8% over the last five years, better than the broader healthcare sector.
Taking a step back, we can see that Stryker’s margin dropped by 1.4 percentage points during that time. It may have ticked higher more recently, but shareholders are likely hoping for its margin to at least revert to its historical level. If the longer-term trend returns, it could signal increasing investment needs and capital intensity. We’ll give the company the benefit of the doubt for now as its overall financial profile is still healthy.
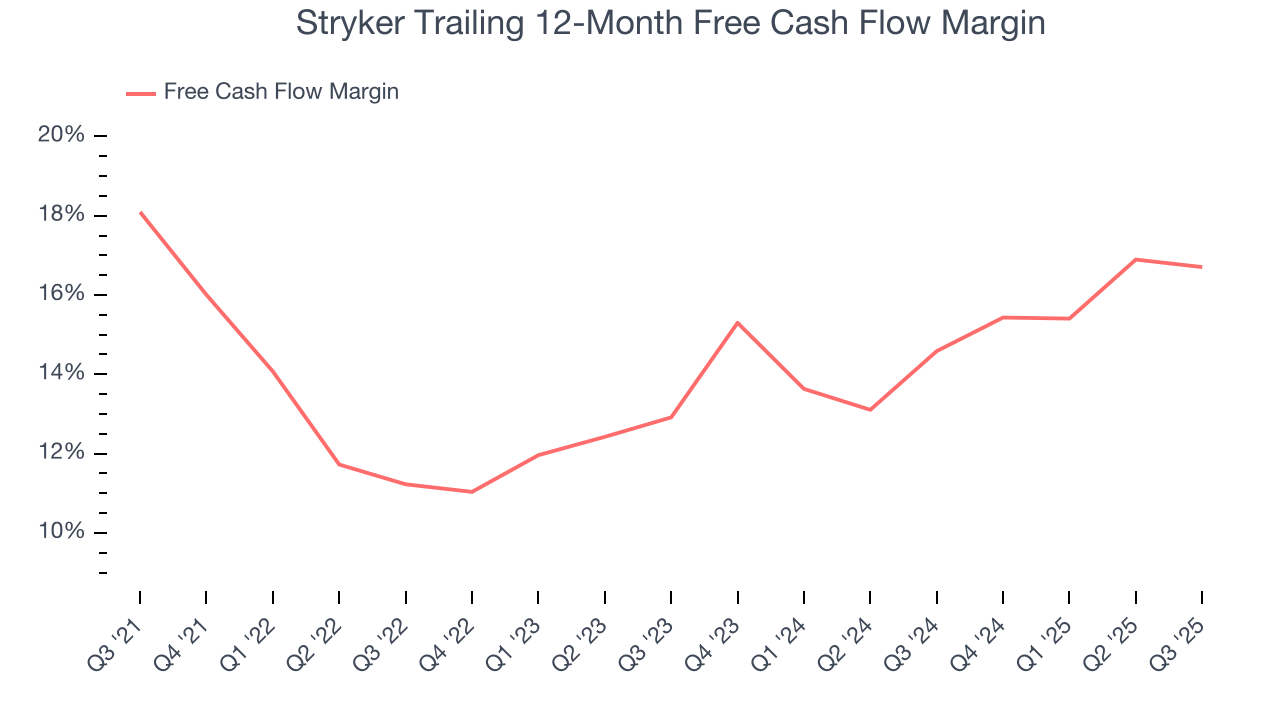
Stryker’s free cash flow clocked in at $1.35 billion in Q3, equivalent to a 22.3% margin. The company’s cash profitability regressed as it was 1.4 percentage points lower than in the same quarter last year, but it’s still above its five-year average. We wouldn’t read too much into this quarter’s decline because investment needs can be seasonal, causing short-term swings. Long-term trends carry greater meaning.
10. Return on Invested Capital (ROIC)
EPS and free cash flow tell us whether a company was profitable while growing its revenue. But was it capital-efficient? A company’s ROIC explains this by showing how much operating profit it makes compared to the money it has raised (debt and equity).
Stryker’s management team makes decent investment decisions and generates value for shareholders. Its five-year average ROIC was 9.8%, slightly better than typical healthcare business.
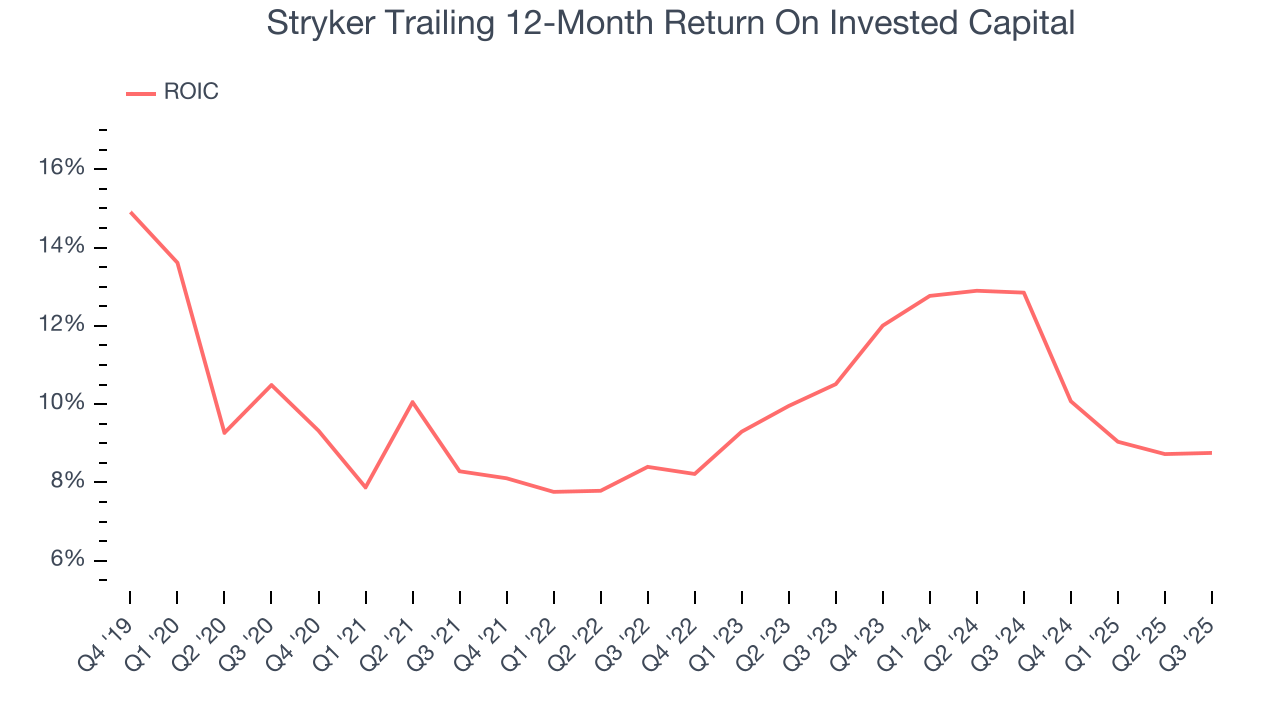
We like to invest in businesses with high returns, but the trend in a company’s ROIC is what often surprises the market and moves the stock price. Over the last few years, Stryker’s ROIC averaged 2.5 percentage point increases each year. This is a great sign when paired with its already strong returns. It could suggest its competitive advantage or profitable growth opportunities are expanding.
11. Balance Sheet Assessment
Stryker reported $3.34 billion of cash and $14.85 billion of debt on its balance sheet in the most recent quarter. As investors in high-quality companies, we primarily focus on two things: 1) that a company’s debt level isn’t too high and 2) that its interest payments are not excessively burdening the business.
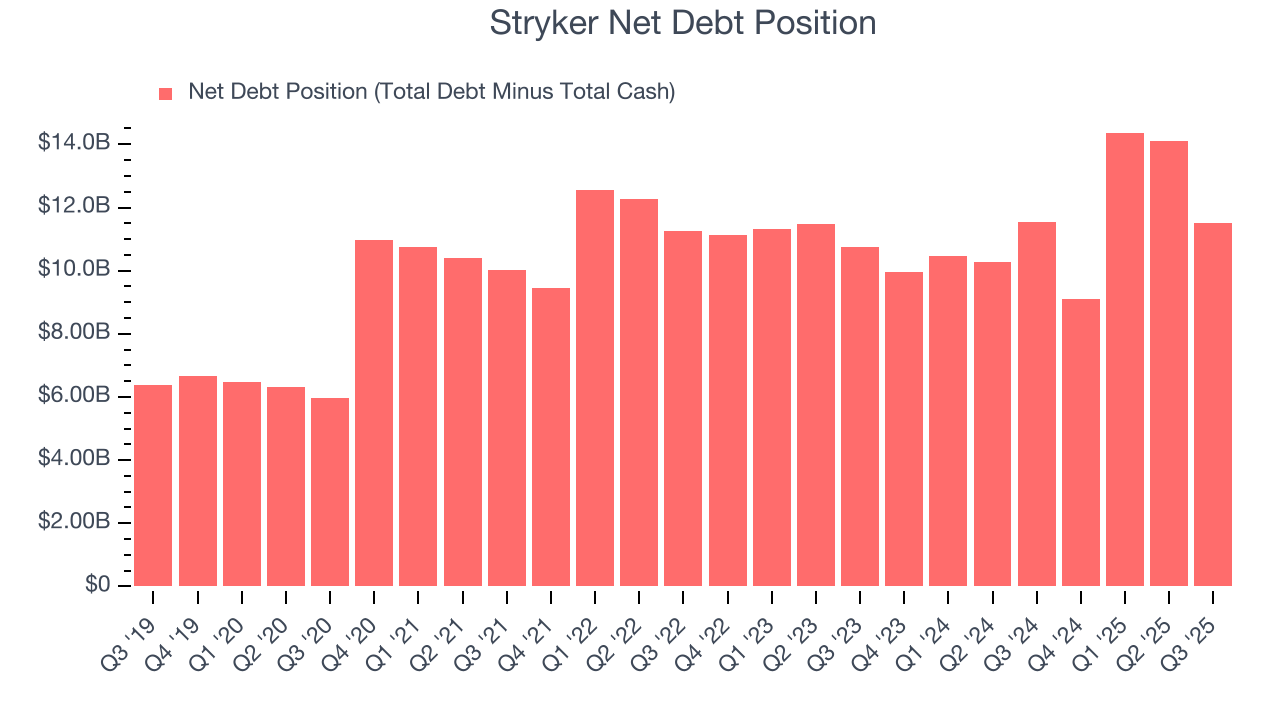
With $6.89 billion of EBITDA over the last 12 months, we view Stryker’s 1.7× net-debt-to-EBITDA ratio as safe. We also see its $287 million of annual interest expenses as appropriate. The company’s profits give it plenty of breathing room, allowing it to continue investing in growth initiatives.
12. Key Takeaways from Stryker’s Q3 Results
It was good to see Stryker meet analysts’ organic revenue expectations this quarter, although revenue was just in line. EPS managed to exceed expectations though. Overall, this print had some key positives. The market seemed to be hoping for more, and the stock traded down 1.1% to $364.89 immediately after reporting.
13. Is Now The Time To Buy Stryker?
Updated: January 24, 2026 at 11:18 PM EST
Before making an investment decision, investors should account for Stryker’s business fundamentals and valuation in addition to what happened in the latest quarter.
We think Stryker is a solid business. First off, its revenue growth was good over the last five years. Plus, Stryker’s spectacular EPS growth over the last five years shows its profits are trickling down to shareholders, and its strong operating margins show it’s a well-run business.
Stryker’s P/E ratio based on the next 12 months is 24.7x. When scanning the healthcare space, Stryker trades at a fair valuation. If you’re a fan of the business and management team, now is a good time to scoop up some shares.
Wall Street analysts have a consensus one-year price target of $427.40 on the company (compared to the current share price of $352.80), implying they see 21.1% upside in buying Stryker in the short term.