
Truist Financial (TFC)
We wouldn’t recommend Truist Financial. Not only are its sales cratering but also its low returns on capital suggest it struggles to generate profits.― StockStory Analyst Team
1. News


2. Summary
Why We Think Truist Financial Will Underperform
Born from the 2019 merger of BB&T and SunTrust in one of the largest banking combinations since the 2008 financial crisis, Truist Financial (NYSE:TFC) is a bank holding company that offers a wide range of financial services including consumer and commercial banking, wealth management, insurance, and lending solutions.
- Customers postponed purchases of its products and services this cycle as its revenue declined by 1.7% annually over the last five years
- Flat earnings per share over the last five years lagged its peers
- Net interest income is projected to tank by 11.3% over the next 12 months as demand evaporates


Truist Financial’s quality doesn’t meet our hurdle. We see more attractive opportunities in the market.
Why There Are Better Opportunities Than Truist Financial


At $44.30 per share, Truist Financial trades at 0.9x forward P/B. Truist Financial’s valuation may seem like a bargain, especially when stacked up against other banking companies. We remind you that you often get what you pay for, though.
Cheap stocks can look like great bargains at first glance, but you often get what you pay for. These mediocre businesses often have less earnings power, meaning there is more reliance on a re-rating to generate good returns - an unlikely scenario for low-quality companies.
3. Truist Financial (TFC) Research Report: Q4 CY2025 Update
Financial services company Truist Financial (NYSE:TFC) fell short of the markets revenue expectations in Q4 CY2025 as sales rose 2.7% year on year to $5.25 billion. Its GAAP profit of $1 per share was 8.4% below analysts’ consensus estimates.
Truist Financial (TFC) Q4 CY2025 Highlights:
- Net Interest Income: $3.7 billion vs analyst estimates of $3.74 billion (3.1% year-on-year growth, 1.1% miss)
- Net Interest Margin: 3.1% vs analyst estimates of 3% (2.8 basis point beat)
- Revenue: $5.25 billion vs analyst estimates of $5.32 billion (2.7% year-on-year growth, 1.3% miss)
- Efficiency Ratio: 60.4% vs analyst estimates of 55.4% (501 basis point miss)
- EPS (GAAP): $1 vs analyst expectations of $1.09 (8.4% miss)
- Tangible Book Value per Share: $33.48 vs analyst estimates of $32.85 (12.7% year-on-year growth, 1.9% beat)
- Market Capitalization: $62.86 billion
Company Overview
Born from the 2019 merger of BB&T and SunTrust in one of the largest banking combinations since the 2008 financial crisis, Truist Financial (NYSE:TFC) is a bank holding company that offers a wide range of financial services including consumer and commercial banking, wealth management, insurance, and lending solutions.
Truist operates primarily through its main subsidiary, Truist Bank, serving both individual consumers and businesses across a comprehensive suite of financial products. For individual customers, the bank provides everyday banking services like checking and savings accounts, credit cards, and various lending options including home mortgages, home equity loans, auto loans, and personal loans. These services are delivered through both physical branch locations and digital platforms.
On the commercial side, Truist caters to businesses of all sizes, from small local enterprises to large corporations. Its commercial offerings include business loans, treasury management services, equipment financing, and specialized lending for industries like healthcare and commercial real estate. For example, a mid-sized manufacturing company might use Truist for a combination of working capital loans, cash management services, and employee benefit programs.
The company also maintains significant operations in insurance, wealth management, and capital markets. Through its insurance division, Truist offers property, casualty, life, and health insurance products. Its wealth management arm provides investment advisory services, retirement planning, and private banking for affluent clients. Meanwhile, the investment banking team helps corporate clients with services like debt issuance, mergers and acquisitions advice, and securities underwriting.
Truist generates revenue primarily through interest income on loans, fees from banking services, insurance premiums, and investment management fees. The company operates throughout the eastern and southeastern United States, with particularly strong presence in states like North Carolina, Virginia, Florida, and Georgia.
4. Diversified Banks
At their core, diversified banks take in deposits and engage in various forms of lending, which means revenue is generated through interest rate spreads (difference between loan and deposit rates) and fees. Other revenue comes from adjacent services such as wealth management, card and account fees, and products such as annuities. These institutions benefit from rising interest rates that improve NIMs (net interest margins), digital transformation reducing operational costs, and expanding wealth management services as populations age. However, they face headwinds including fintech competition disrupting traditional models (how disruptive is crypto?), stringent regulatory requirements increasing compliance costs, and cybersecurity threats requiring substantial technology investments. Economic downturns also pose risks through potential loan defaults and compressed margins during accommodative monetary policy periods.
Truist Financial competes with other major U.S. banks including JPMorgan Chase (NYSE:JPM), Bank of America (NYSE:BAC), Wells Fargo (NYSE:WFC), and PNC Financial Services (NYSE:PNC), as well as regional banks like Fifth Third Bancorp (NASDAQ:FITB) and Regions Financial (NYSE:RF).
5. Sales Growth
In general, banks make money from two primary sources. The first is net interest income, which is interest earned on loans, mortgages, and investments in securities minus interest paid out on deposits. The second source is non-interest income, which can come from bank account, credit card, wealth management, investing banking, and trading fees. Truist Financial struggled to consistently generate demand over the last five years as its revenue dropped at a 1.8% annual rate. This was below our standards and is a sign of lacking business quality.
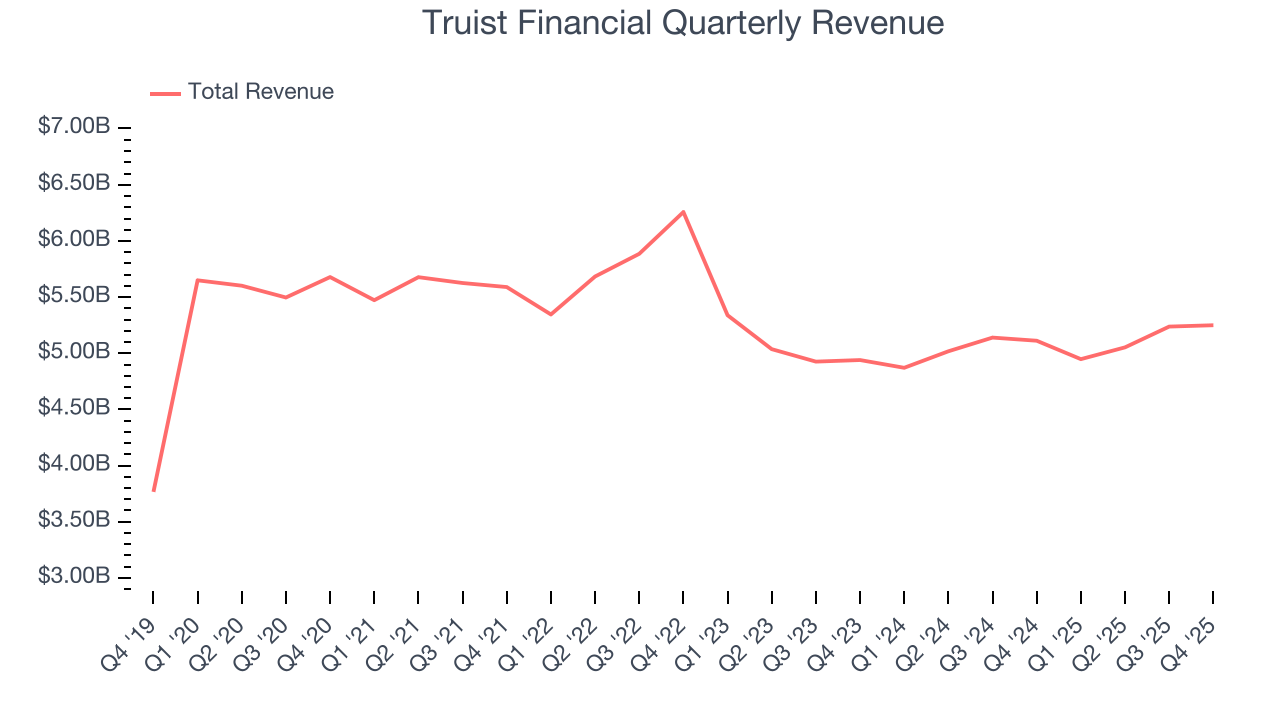
We at StockStory place the most emphasis on long-term growth, but within financials, a half-decade historical view may miss recent interest rate changes, market returns, and industry trends. Truist Financial’s revenue over the last two years was flat, sugggesting its demand was weak but stabilized after its initial drop. 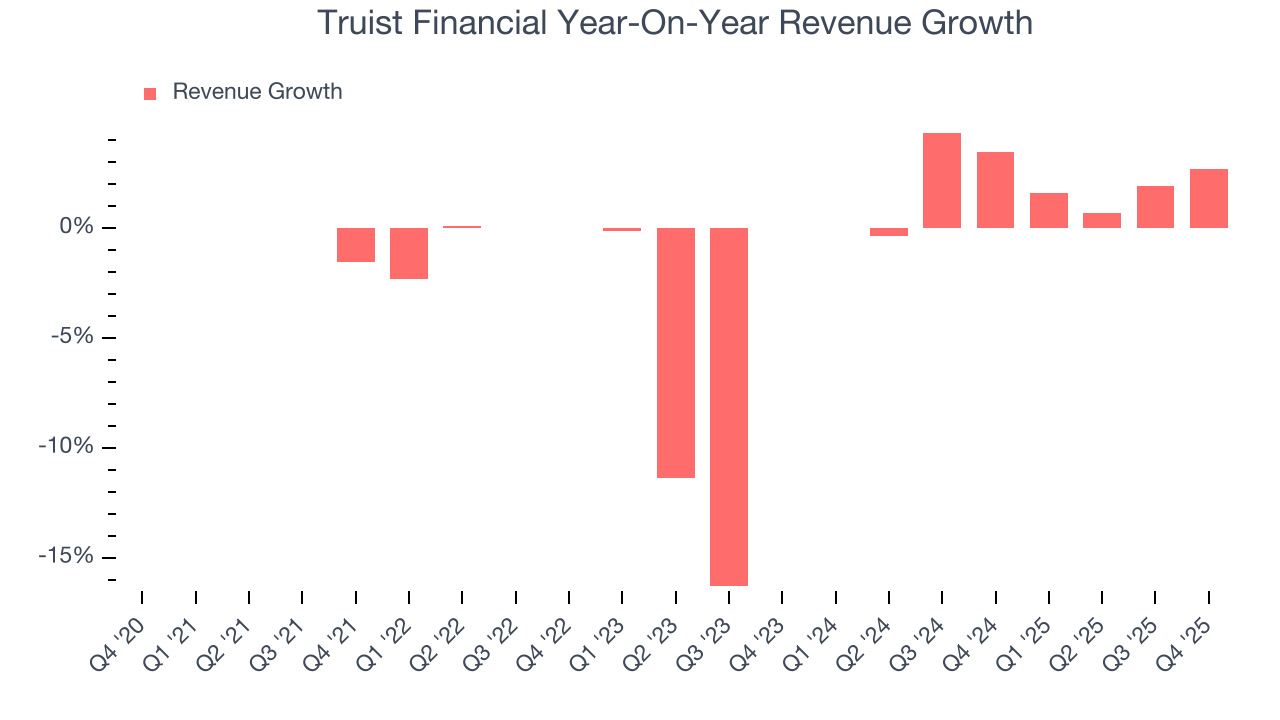 Note: Quarters not shown were determined to be outliers, impacted by outsized investment gains/losses that are not indicative of the recurring fundamentals of the business.
This quarter, Truist Financial’s revenue grew by 2.7% year on year to $5.25 billion, falling short of Wall Street’s estimates.
Net interest income made up 69.3% of the company’s total revenue during the last five years, meaning lending operations are Truist Financial’s largest source of revenue.
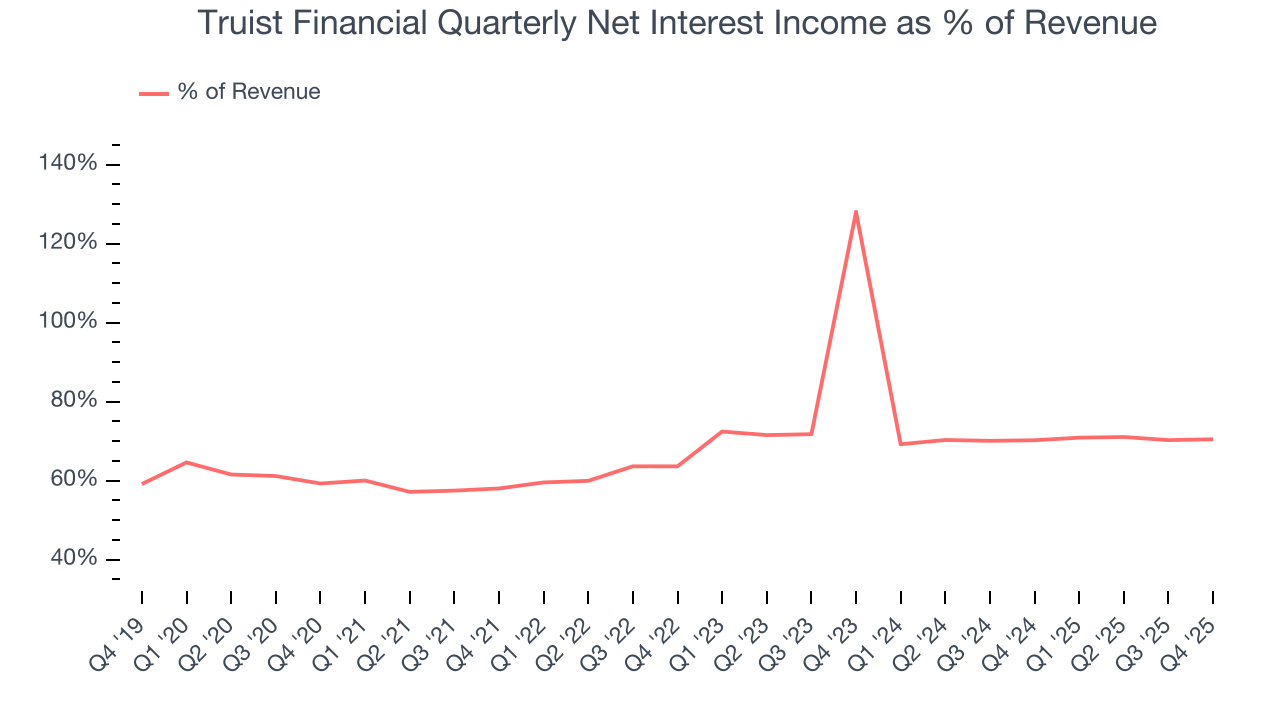
While banks generate revenue from multiple sources, investors view net interest income as the cornerstone - its predictable, recurring characteristics stand in sharp contrast to the volatility of non-interest income.
6. Earnings Per Share
Revenue trends explain a company’s historical growth, but the long-term change in earnings per share (EPS) points to the profitability of that growth – for example, a company could inflate its sales through excessive spending on advertising and promotions.
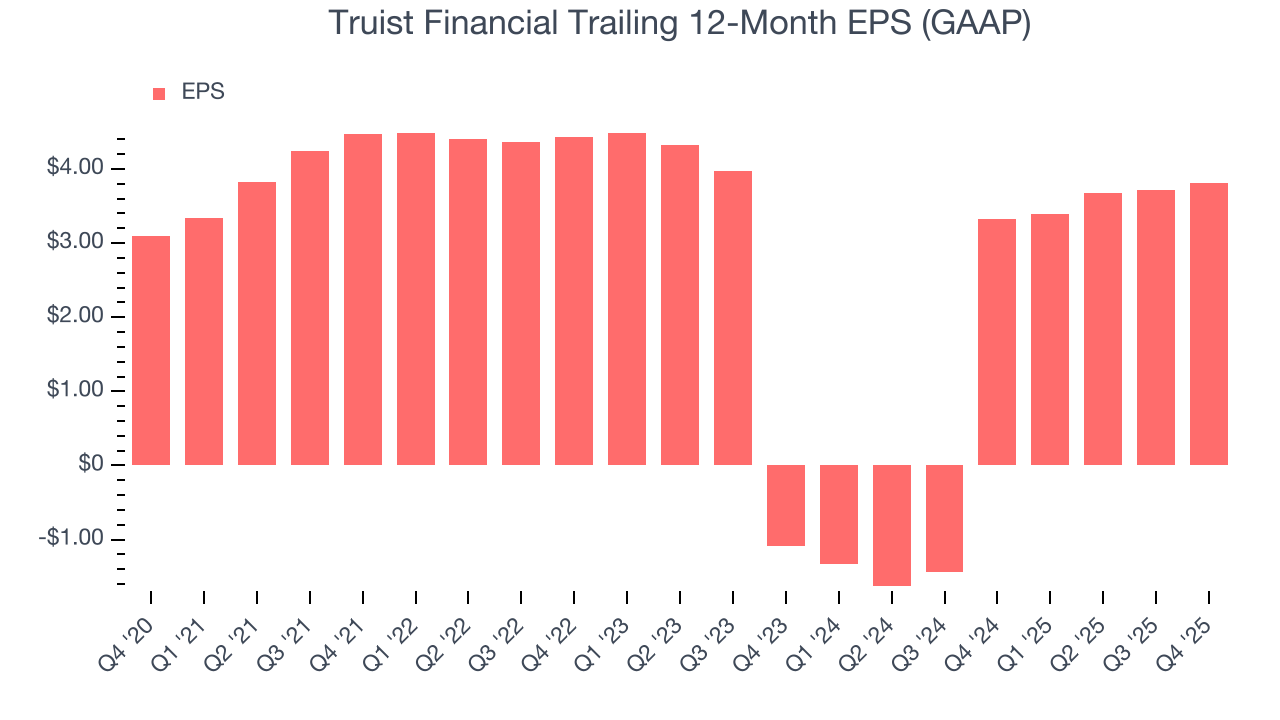
Truist Financial’s EPS grew at a weak 4.3% compounded annual growth rate over the last five years. This performance was better than its 1.8% annualized revenue declines, but we take it with a grain of salt because its efficiency ratio didn’t improve and it didn’t repurchase its shares, meaning the delta came from reduced interest expenses or taxes.
Like with revenue, we analyze EPS over a more recent period because it can provide insight into an emerging theme or development for the business.
For Truist Financial, its two-year annual EPS growth of 134% was higher than its five-year trend. This acceleration made it one of the faster-growing banking companies in recent history.
In Q4, Truist Financial reported EPS of $1, up from $0.91 in the same quarter last year. Despite growing year on year, this print missed analysts’ estimates. Over the next 12 months, Wall Street expects Truist Financial’s full-year EPS of $3.81 to grow 17.5%.
7. Tangible Book Value Per Share (TBVPS)
The balance sheet drives banking profitability since earnings flow from the spread between borrowing and lending rates. As such, valuations for these companies concentrate on capital strength and sustainable equity accumulation potential.
When analyzing banks, tangible book value per share (TBVPS) takes precedence over many other metrics. This measure isolates genuine per-share value by removing intangible assets of debatable liquidation worth. On the other hand, EPS is often distorted by mergers and flexible loan loss accounting. TBVPS provides clearer performance insights.
Truist Financial’s TBVPS grew at a decent 5% annual clip over the last five years. TBVPS growth has accelerated recently, growing by 15.7% annually over the last two years from $25.01 to $33.48 per share.
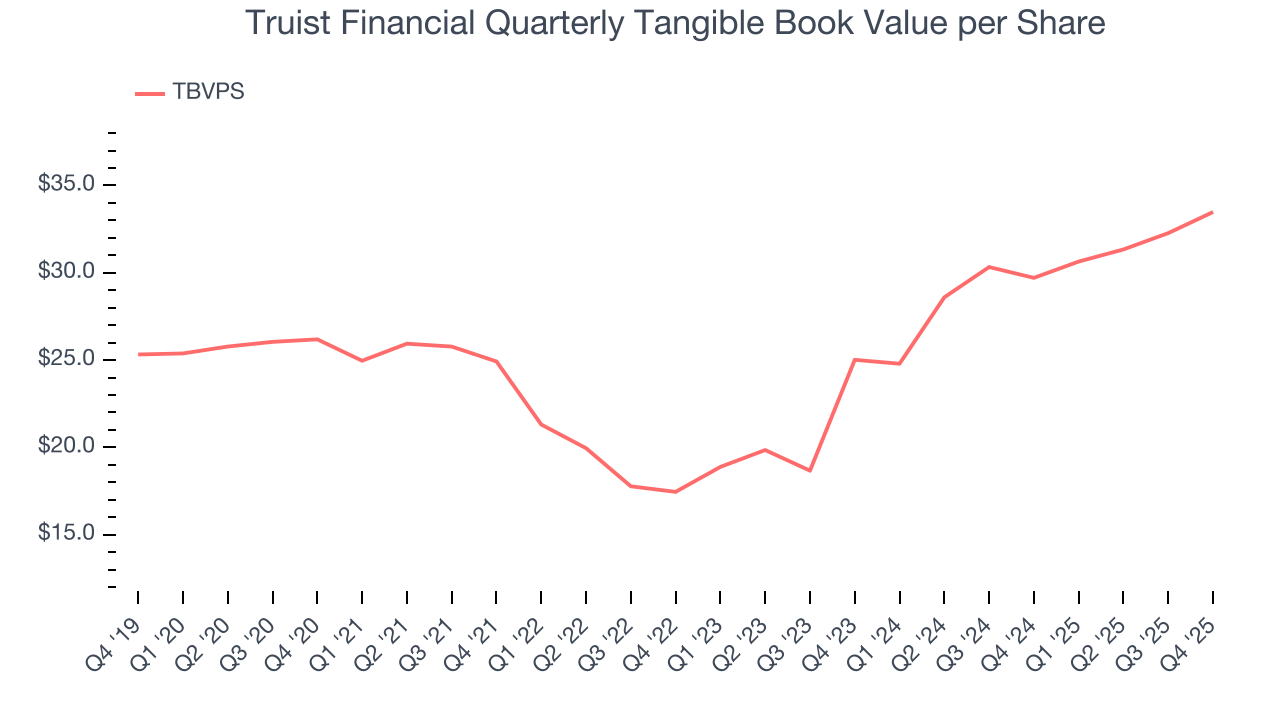
Over the next 12 months, Consensus estimates call for Truist Financial’s TBVPS to grow by 3.7% to $34.73, lousy growth rate.
8. Balance Sheet Assessment
Leverage is core to a financial firm’s business model (loans funded by deposits). To ensure economic stability and avoid a repeat of the 2008 GFC, regulators require certain levels of capital and liquidity, focusing on the Tier 1 capital ratio.
Tier 1 capital is the highest-quality capital that a firm holds, consisting primarily of common stock and retained earnings, but also physical gold. It serves as the primary cushion against losses and is the first line of defense in times of financial distress.
This capital is divided by risk-weighted assets to derive the Tier 1 capital ratio. Risk-weighted means that cash and US treasury securities are assigned little risk while unsecured consumer loans and equity investments get much higher risk weights, for example.
New regulation after the 2008 financial crisis requires that all firms must maintain a Tier 1 capital ratio greater than 4.5%. On top of this, there are additional buffers based on scale, risk profile, and other regulatory classifications, so that at the end of the day, firms generally must maintain a 7-10% ratio at minimum.
Over the last two years, Truist Financial has averaged a Tier 1 capital ratio of 11.1%, which is considered safe and well capitalized in the event that macro or market conditions suddenly deteriorate.
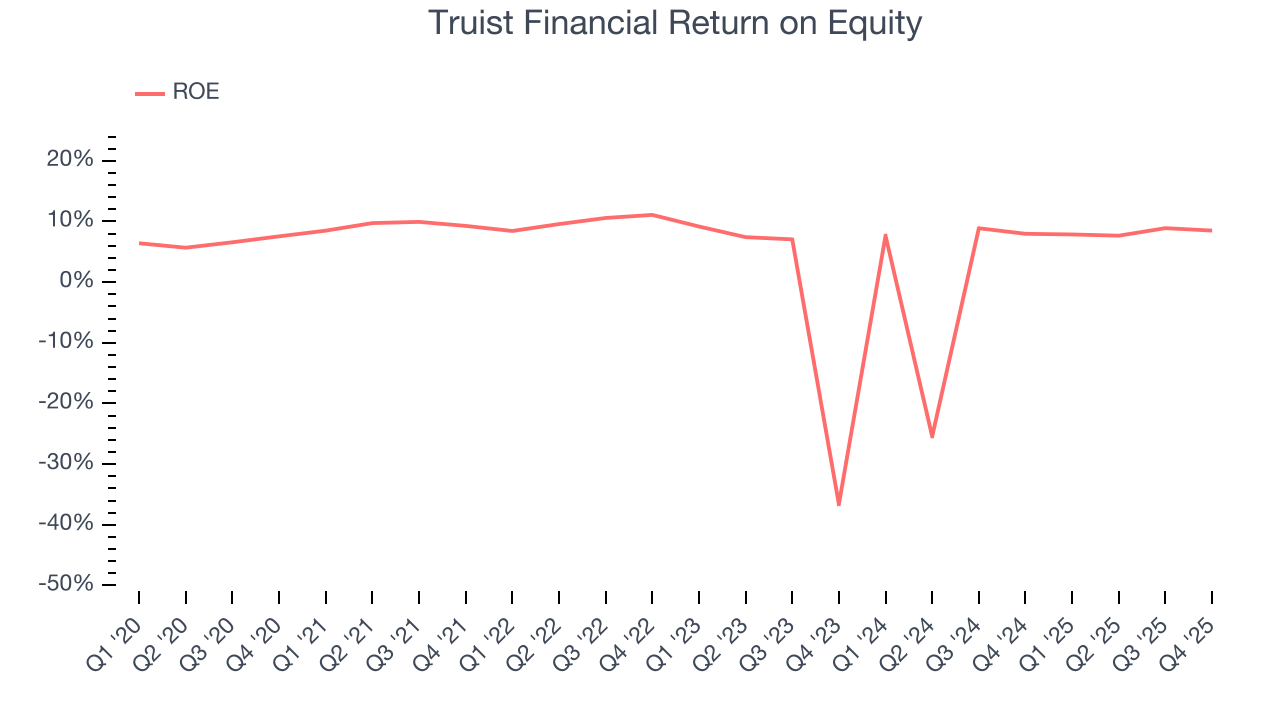
9. Return on Equity
Return on equity, or ROE, tells us how much profit a company generates for each dollar of shareholder equity, a key funding source for banks. Over a long period, banks with high ROE tend to compound shareholder wealth faster through retained earnings, buybacks, and dividends.
Over the last five years, Truist Financial has averaged an ROE of 4.8%, uninspiring for a company operating in a sector where the average shakes out around 7.5%.
10. Key Takeaways from Truist Financial’s Q4 Results
It was encouraging to see Truist Financial beat analysts’ tangible book value per share expectations this quarter. On the other hand, its EPS missed and its revenue fell slightly short of Wall Street’s estimates. Overall, this quarter could have been better. The stock traded down 2.3% to $48.03 immediately following the results.
11. Is Now The Time To Buy Truist Financial?
Updated: March 21, 2026 at 1:08 AM EDT
Before making an investment decision, investors should account for Truist Financial’s business fundamentals and valuation in addition to what happened in the latest quarter.
We cheer for all companies supporting the economy, but in the case of Truist Financial, we’ll be cheering from the sidelines. First off, its revenue has declined over the last five years. While its anticipated efficiency ratio over the next year signals it will gain leverage on its fixed costs, the downside is its weak EPS growth over the last five years shows it’s failed to produce meaningful profits for shareholders. On top of that, its estimated net interest income for the next 12 months are weak.
Truist Financial’s P/B ratio based on the next 12 months is 0.9x. This valuation tells us a lot of optimism is priced in - we think there are better stocks to buy right now.
Wall Street analysts have a consensus one-year price target of $56.55 on the company (compared to the current share price of $44.30).
Although the price target is bullish, readers should exercise caution because analysts tend to be overly optimistic. The firms they work for, often big banks, have relationships with companies that extend into fundraising, M&A advisory, and other rewarding business lines. As a result, they typically hesitate to say bad things for fear they will lose out. We at StockStory do not suffer from such conflicts of interest, so we’ll always tell it like it is.