Timken (TKR)
We wouldn’t buy Timken. Its weak sales growth and declining returns on capital show its demand and profits are shrinking.― StockStory Analyst Team
1. News


2. Summary
Why We Think Timken Will Underperform
Established after the founder noticed the difficulty freight wagons had making sharp turns, Timken (NYSE:TKR) is a provider of industrial parts used across various sectors.
- Sales tumbled by 2% annually over the last two years, showing market trends are working against its favor during this cycle
- Falling earnings per share over the last two years has some investors worried as stock prices ultimately follow EPS over the long term
- Organic sales performance over the past two years indicates the company may need to make strategic adjustments or rely on M&A to catalyze faster growth


Timken is in the doghouse. We’re hunting for superior stocks elsewhere.
Why There Are Better Opportunities Than Timken


At $97.54 per share, Timken trades at 17x forward P/E. Timken’s multiple may seem like a great deal among industrials peers, but we think there are valid reasons why it’s this cheap.
It’s better to pay up for high-quality businesses with higher long-term earnings potential rather than to buy lower-quality stocks because they appear cheap. These challenged businesses often don’t re-rate, a phenomenon known as a “value trap”.
3. Timken (TKR) Research Report: Q4 CY2025 Update
Industrial component provider Timken (NYSE:TKR) reported Q4 CY2025 results exceeding the market’s revenue expectations, with sales up 3.5% year on year to $1.11 billion. Its non-GAAP profit of $1.14 per share was 4.9% above analysts’ consensus estimates.
Timken (TKR) Q4 CY2025 Highlights:
- Revenue: $1.11 billion vs analyst estimates of $1.07 billion (3.5% year-on-year growth, 3.5% beat)
- Adjusted EPS: $1.14 vs analyst estimates of $1.09 (4.9% beat)
- Adjusted EBITDA: $177.8 million vs analyst estimates of $169.2 million (16% margin, 5.1% beat)
- Adjusted EPS guidance for the upcoming financial year 2026 is $5.75 at the midpoint, missing analyst estimates by 3.7%
- Operating Margin: 9.8%, in line with the same quarter last year
- Free Cash Flow Margin: 12.7%, up from 11.6% in the same quarter last year
- Organic Revenue rose 1.3% year on year (beat)
- Market Capitalization: $6.70 billion
Company Overview
Established after the founder noticed the difficulty freight wagons had making sharp turns, Timken (NYSE:TKR) is a provider of industrial parts used across various sectors.
Timken was established in 1899 after the founder developed a bearing to address this issue. The company then made acquisitions to increase its product offerings and manufacturing capabilities. While the company has primarily targeted the acquisition of small- to mid-sized companies, its $840 million purchase of The Torrington Company in 2003 notably doubled the size of the enterprise.
Today, Timken produces a variety of goods across the industrial sector. Its products range from bearings used to reduce friction between moving parts and power transmission products (helps machines transfer power from one part to another) to components such as gears, shafts, and seals. These parts are a piece of a larger system used to operate manufacturing machinery or power systems like wind turbines. The company also offers maintenance and repair services to complement its products.
Timken generates revenue through its direct sales, long-term supply contracts, and aftermarket sales. Its direct sales involve a one-time sale of its product while long-term supply contracts are tailored to customers needing a larger, consistent supply of products. Its long-term supply contracts typically range from 3 to 5 years, though it can be longer. Additionally, its aftermarket sales provide replacement parts to keep existing machinery and equipment running.
4. Engineered Components and Systems
Engineered components and systems companies possess technical know-how in sometimes narrow areas such as metal forming or intelligent robotics. Lately, automation and connected equipment collecting analyzable data have been trending, creating new demand. On the other hand, like the broader industrials sector, engineered components and systems companies are at the whim of economic cycles. Consumer spending and interest rates, for example, can greatly impact the industrial production that drives demand for these companies’ offerings.
Competitors offering similar products include Amphenol (NYSE:APH), Barnes (NYSE:B), and Illinois Tool Works (NYSE:ITW).
5. Revenue Growth
A company’s long-term sales performance is one signal of its overall quality. Even a bad business can shine for one or two quarters, but a top-tier one grows for years. Unfortunately, Timken’s 5.5% annualized revenue growth over the last five years was tepid. This fell short of our benchmark for the industrials sector and is a rough starting point for our analysis.
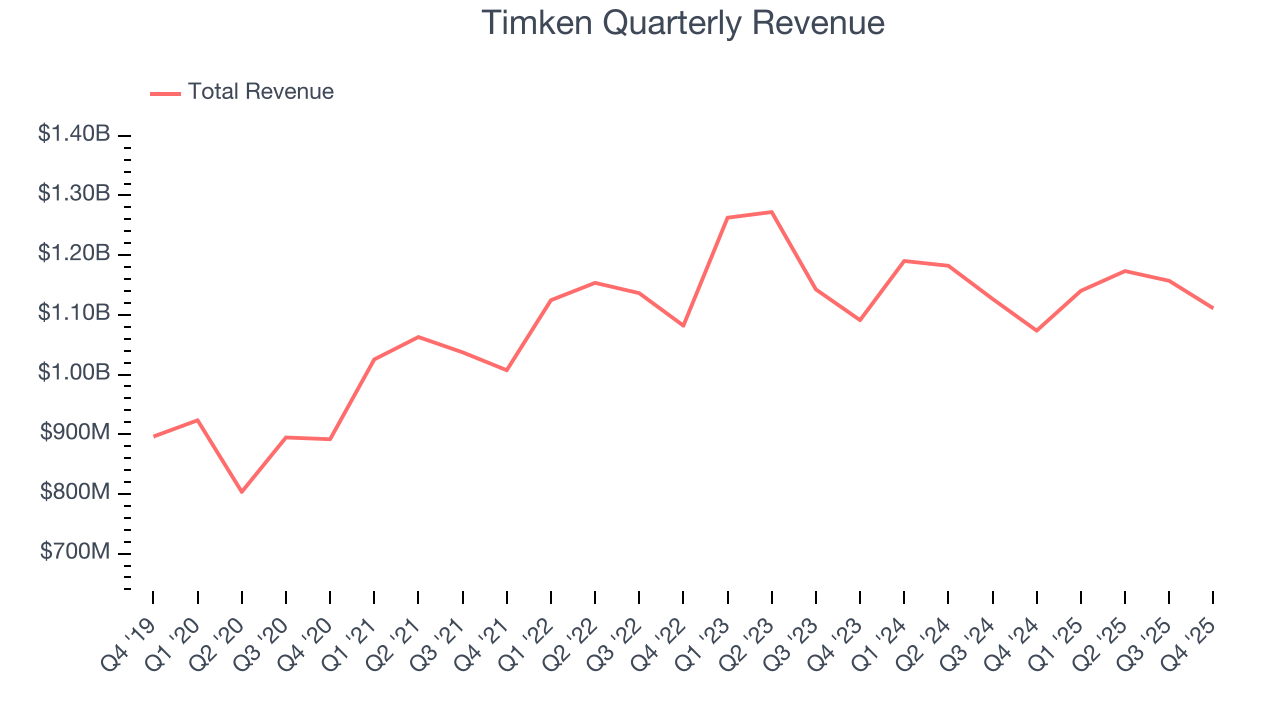
We at StockStory place the most emphasis on long-term growth, but within industrials, a half-decade historical view may miss cycles, industry trends, or a company capitalizing on catalysts such as a new contract win or a successful product line. Timken’s performance shows it grew in the past but relinquished its gains over the last two years, as its revenue fell by 2% annually. 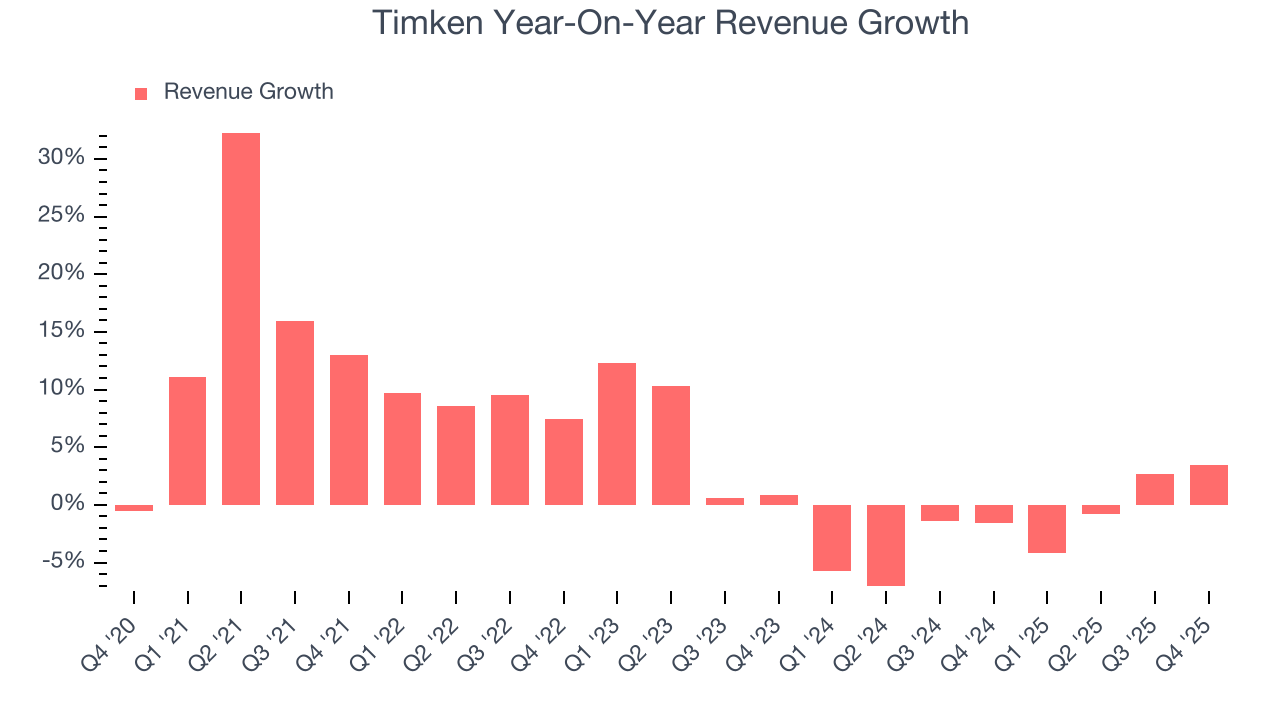
Timken also reports organic revenue, which strips out one-time events like acquisitions and currency fluctuations that don’t accurately reflect its fundamentals. Over the last two years, Timken’s organic revenue averaged 3.3% year-on-year declines. Because this number aligns with its two-year revenue growth, we can see the company’s core operations (not acquisitions and divestitures) drove most of its results. 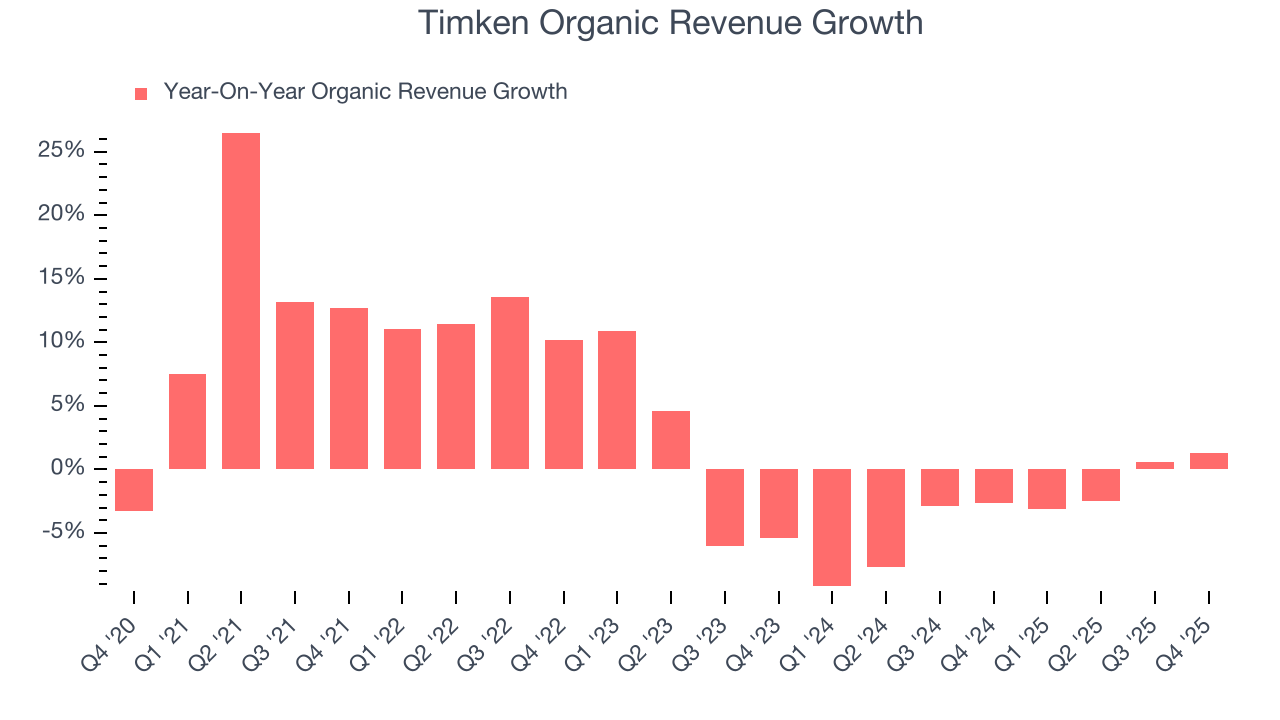
This quarter, Timken reported modest year-on-year revenue growth of 3.5% but beat Wall Street’s estimates by 3.5%.
Looking ahead, sell-side analysts expect revenue to grow 2.5% over the next 12 months. While this projection suggests its newer products and services will fuel better top-line performance, it is still below average for the sector.
6. Gross Margin & Pricing Power
All else equal, we prefer higher gross margins because they make it easier to generate more operating profits and indicate that a company commands pricing power by offering more differentiated products.
Timken’s unit economics are better than the typical industrials business, signaling its products are somewhat differentiated through quality or brand.As you can see below, it averaged a decent 30% gross margin over the last five years. That means for every $100 in revenue, roughly $30.04 was left to spend on selling, marketing, R&D, and general administrative overhead. 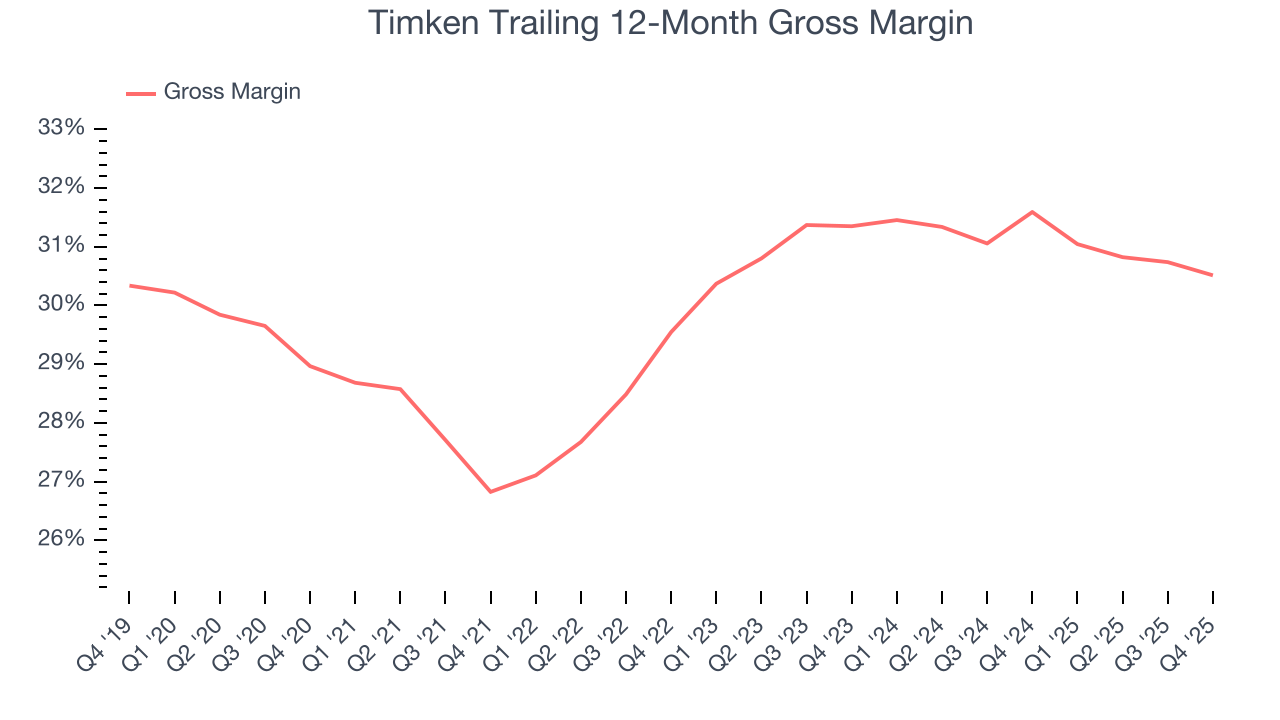
This quarter, Timken’s gross profit margin was 29.3%, in line with the same quarter last year. Zooming out, Timken’s full-year margin has been trending down over the past 12 months, decreasing by 1.1 percentage points. If this move continues, it could suggest a more competitive environment with some pressure to lower prices and higher input costs (such as raw materials and manufacturing expenses).
7. Operating Margin
Operating margin is an important measure of profitability as it shows the portion of revenue left after accounting for all core expenses – everything from the cost of goods sold to advertising and wages. It’s also useful for comparing profitability across companies with different levels of debt and tax rates because it excludes interest and taxes.
Timken’s operating margin might fluctuated slightly over the last 12 months but has remained more or less the same, averaging 13% over the last five years. This profitability was top-notch for an industrials business, showing it’s an well-run company with an efficient cost structure.
Looking at the trend in its profitability, Timken’s operating margin might fluctuated slightly but has generally stayed the same over the last five years. This raises questions about the company’s expense base because its revenue growth should have given it leverage on its fixed costs, resulting in better economies of scale and profitability.
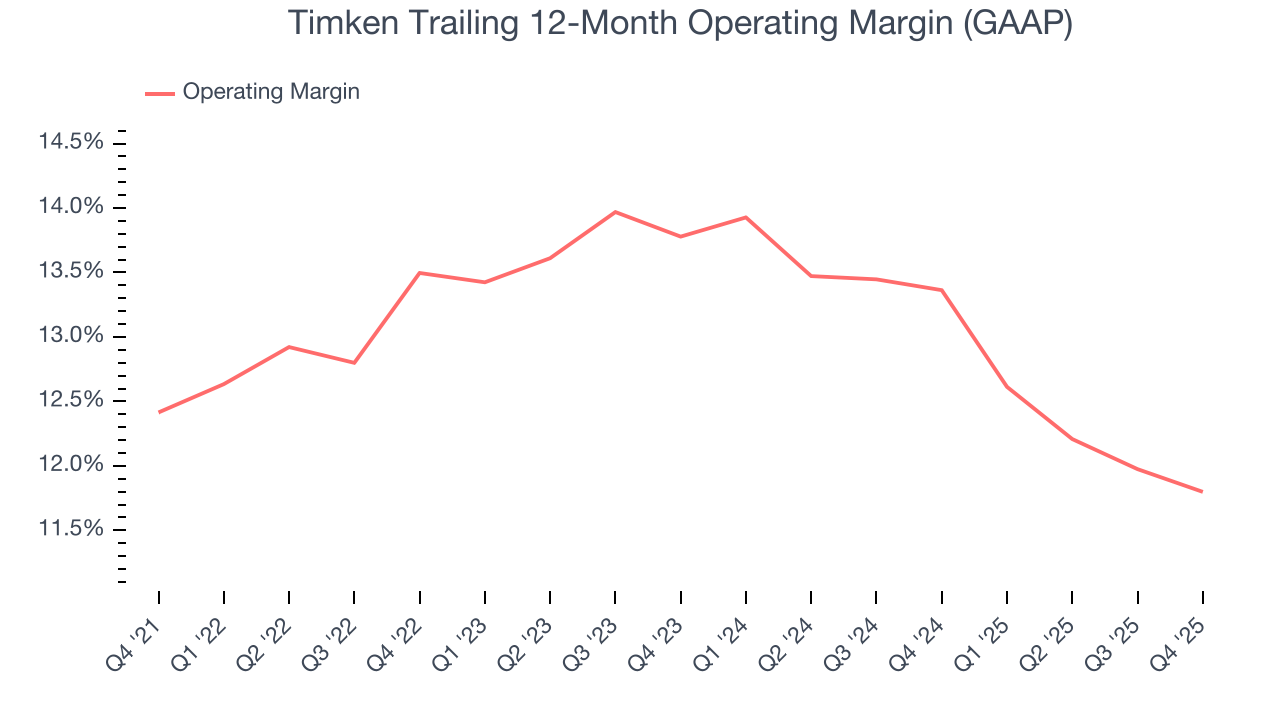
This quarter, Timken generated an operating margin profit margin of 9.8%, in line with the same quarter last year. This indicates the company’s cost structure has recently been stable.
8. Earnings Per Share
Revenue trends explain a company’s historical growth, but the long-term change in earnings per share (EPS) points to the profitability of that growth – for example, a company could inflate its sales through excessive spending on advertising and promotions.
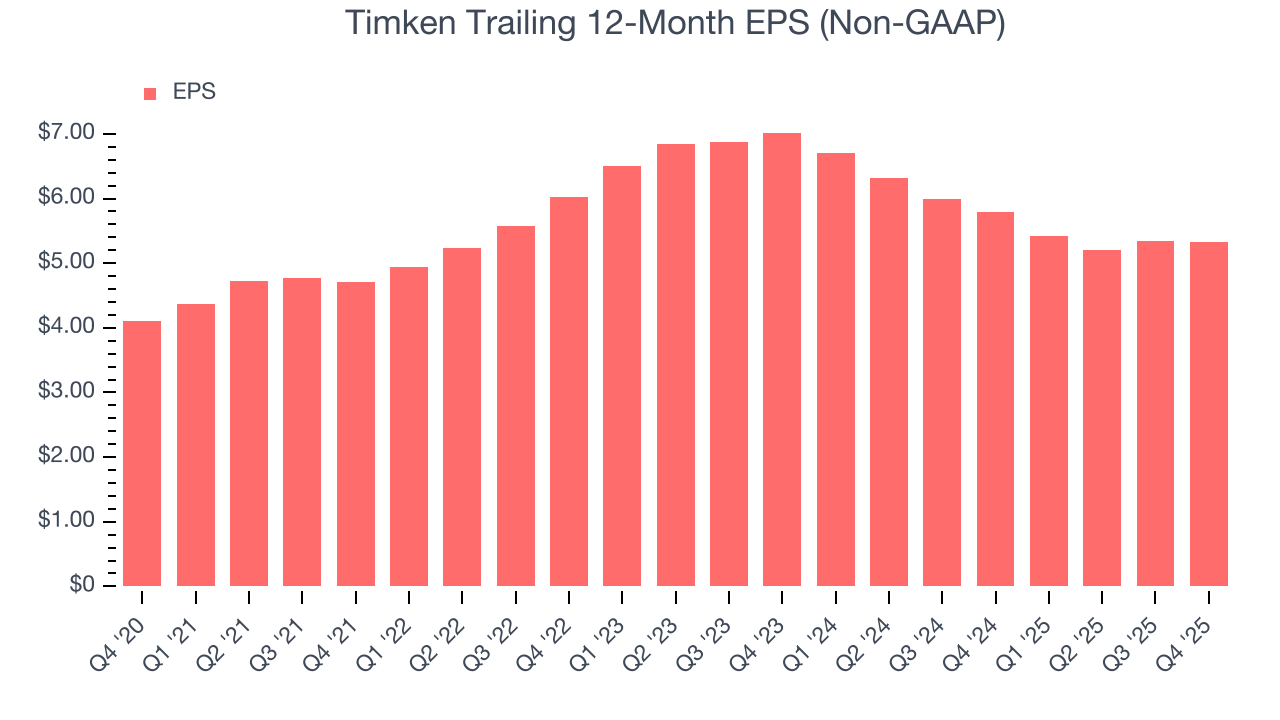
Timken’s unimpressive 5.4% annual EPS growth over the last five years aligns with its revenue performance. This tells us it maintained its per-share profitability as it expanded.
Like with revenue, we analyze EPS over a shorter period to see if we are missing a change in the business.
Timken’s two-year annual EPS declines of 12.9% were bad and lower than its two-year revenue losses.
Diving into the nuances of Timken’s earnings can give us a better understanding of its performance. While we mentioned earlier that Timken’s operating margin was flat this quarter, a two-year view shows its margin has declined. This was the most relevant factor (aside from the revenue impact) behind its lower earnings; interest expenses and taxes can also affect EPS but don’t tell us as much about a company’s fundamentals.
In Q4, Timken reported adjusted EPS of $1.14, down from $1.16 in the same quarter last year. Despite falling year on year, this print beat analysts’ estimates by 4.9%. Over the next 12 months, Wall Street expects Timken’s full-year EPS of $5.33 to grow 11.6%.
9. Cash Is King
Although earnings are undoubtedly valuable for assessing company performance, we believe cash is king because you can’t use accounting profits to pay the bills.
Timken has shown decent cash profitability, giving it some flexibility to reinvest or return capital to investors. The company’s free cash flow margin averaged 7.1% over the last five years, slightly better than the broader industrials sector.
Taking a step back, we can see that Timken’s margin expanded by 3.1 percentage points during that time. This shows the company is heading in the right direction, and we can see it became a less capital-intensive business because its free cash flow profitability rose while its operating profitability was flat.
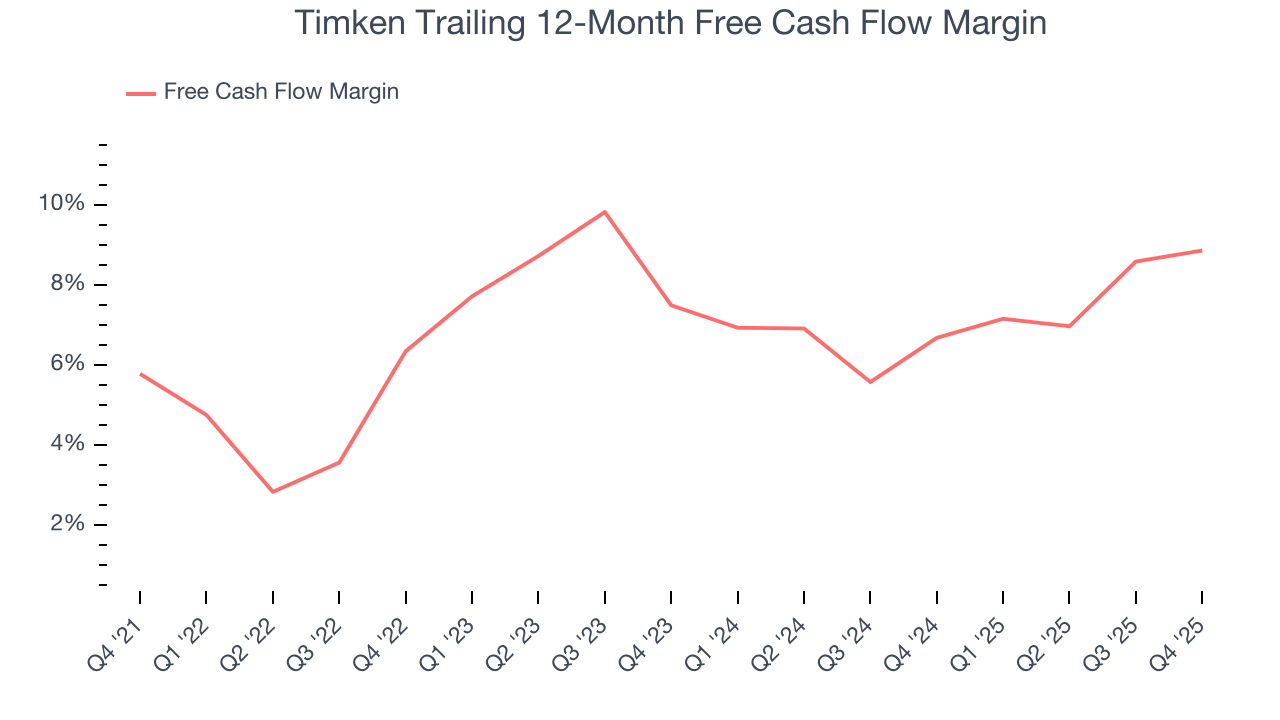
Timken’s free cash flow clocked in at $140.7 million in Q4, equivalent to a 12.7% margin. This result was good as its margin was 1 percentage points higher than in the same quarter last year, building on its favorable historical trend.
10. Return on Invested Capital (ROIC)
EPS and free cash flow tell us whether a company was profitable while growing its revenue. But was it capital-efficient? A company’s ROIC explains this by showing how much operating profit it makes compared to the money it has raised (debt and equity).
Timken’s management team makes decent investment decisions and generates value for shareholders. Its five-year average ROIC was 10.7%, slightly better than typical industrials business.
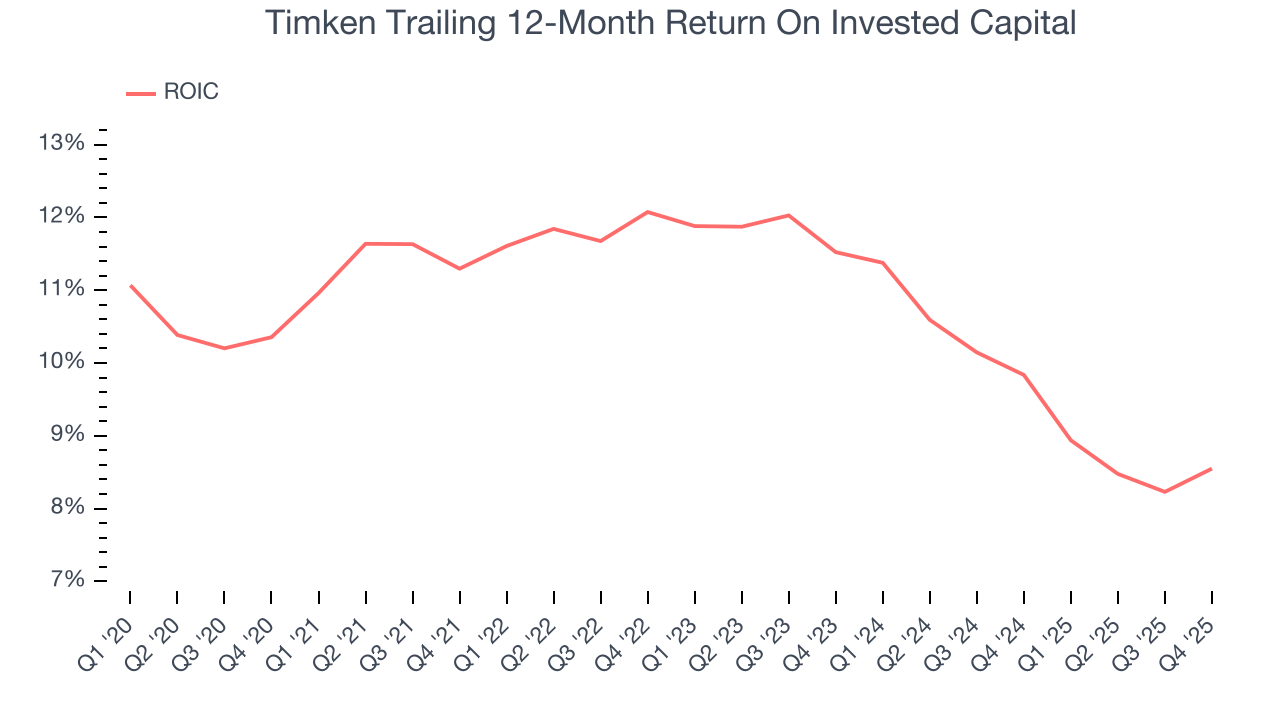
We like to invest in businesses with high returns, but the trend in a company’s ROIC is what often surprises the market and moves the stock price. Over the last few years, Timken’s ROIC averaged 2.5 percentage point decreases each year. We like what management has done in the past, but its declining returns are perhaps a symptom of fewer profitable growth opportunities.
11. Balance Sheet Assessment
Timken reported $365.4 million of cash and $2.02 billion of debt on its balance sheet in the most recent quarter. As investors in high-quality companies, we primarily focus on two things: 1) that a company’s debt level isn’t too high and 2) that its interest payments are not excessively burdening the business.
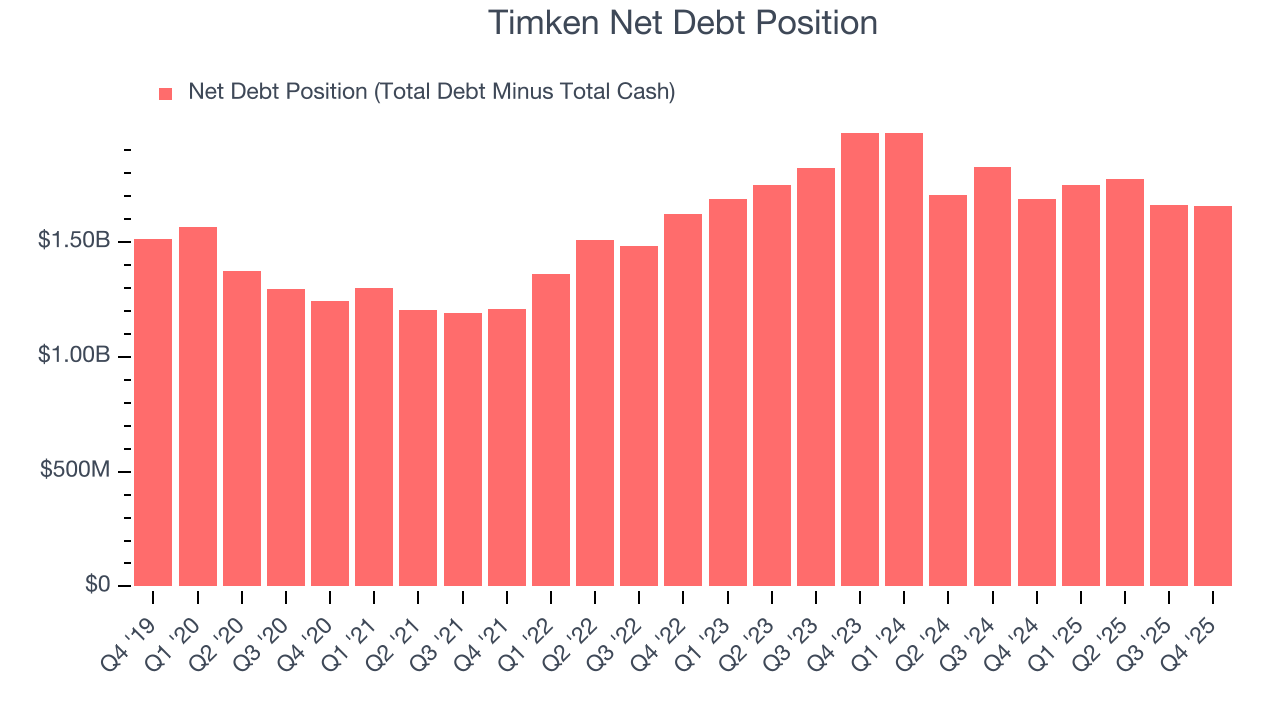
With $795.8 million of EBITDA over the last 12 months, we view Timken’s 2.1× net-debt-to-EBITDA ratio as safe. We also see its $100 million of annual interest expenses as appropriate. The company’s profits give it plenty of breathing room, allowing it to continue investing in growth initiatives.
12. Key Takeaways from Timken’s Q4 Results
We enjoyed seeing Timken beat analysts’ revenue expectations this quarter. We were also glad its organic revenue outperformed Wall Street’s estimates. On the other hand, its full-year EPS guidance missed. Overall, we think this was a mixed quarter. The stock remained flat at $96.38 immediately after reporting.
13. Is Now The Time To Buy Timken?
Updated: March 14, 2026 at 10:13 PM EDT
When considering an investment in Timken, investors should account for its valuation and business qualities as well as what’s happened in the latest quarter.
Timken falls short of our quality standards. First off, its revenue growth was uninspiring over the last five years, and analysts expect its demand to deteriorate over the next 12 months. While its strong operating margins show it’s a well-run business, the downside is its organic revenue declined. On top of that, its diminishing returns show management's prior bets haven't worked out.
Timken’s P/E ratio based on the next 12 months is 17x. This valuation is reasonable, but the company’s shaky fundamentals present too much downside risk. There are more exciting stocks to buy at the moment.
Wall Street analysts have a consensus one-year price target of $109.75 on the company (compared to the current share price of $97.54).