Textron (TXT)
We’re wary of Textron. Its growth has been lacking and its free cash flow margin has caved, suggesting it’s struggling to adapt.― StockStory Analyst Team
1. News


2. Summary
Why We Think Textron Will Underperform
Listed on the NYSE in 1947, Textron (NYSE:TXT) provides products and services in the aerospace, defense, industrial, and finance sectors.
- Organic sales performance over the past two years indicates the company may need to make strategic adjustments or rely on M&A to catalyze faster growth
- Scale is a double-edged sword because it limits the company’s growth potential compared to its smaller competitors, as reflected in its below-average annual revenue increases of 3.4% for the last five years
- On the bright side, its earnings growth has beaten its peers over the last five years as its EPS has compounded at 22% annually


Textron’s quality doesn’t meet our bar. There are more rewarding stocks elsewhere.
Why There Are Better Opportunities Than Textron


At $94.97 per share, Textron trades at 14.5x forward P/E. This multiple is cheaper than most industrials peers, but we think this is justified.
We’d rather pay up for companies with elite fundamentals than get a bargain on weak ones. Cheap stocks can be value traps, and as their performance deteriorates, they will stay cheap or get even cheaper.
3. Textron (TXT) Research Report: Q3 CY2025 Update
Aerospace and defense company Textron (NYSE:TXT) fell short of the market’s revenue expectations in Q3 CY2025, but sales rose 5.1% year on year to $3.60 billion. Its non-GAAP profit of $1.55 per share was 6.4% above analysts’ consensus estimates.
Textron (TXT) Q3 CY2025 Highlights:
- Revenue: $3.60 billion vs analyst estimates of $3.67 billion (5.1% year-on-year growth, 1.9% miss)
- Adjusted EPS: $1.55 vs analyst estimates of $1.46 (6.4% beat)
- Adjusted EBITDA: $454 million vs analyst estimates of $446.5 million (12.6% margin, 1.7% beat)
- Management reiterated its full-year Adjusted EPS guidance of $6.10 at the midpoint
- Operating Margin: 9.9%, up from 7.6% in the same quarter last year
- Free Cash Flow Margin: 7.6%, up from 4.1% in the same quarter last year
- Market Capitalization: $14.72 billion
Company Overview
Listed on the NYSE in 1947, Textron (NYSE:TXT) provides products and services in the aerospace, defense, industrial, and finance sectors.
Textron began its journey in 1923 as a small textile company named Special Yarns Corporation. The company rebranded as Textron in 1956 to reflect its diversification beyond textiles into various industries. Over the years, Textron evolved into a multi-industry company through strategic acquisitions, notably including the purchase of Bell Aircraft Corporation in 1960, which marked its entrance into the aerospace sector.
In the following decades, Textron continued to expand its aerospace capabilities and diversified its holdings by acquiring companies like Cessna Aircraft Company in 1992, further strengthening its position in general aviation. The company also ventured into the defense sector with acquisitions that broadened its product offerings to include unmanned aircraft systems, armored vehicles, and marine craft.
Today, Textron's wide range of products includes aircraft and defense solutions. They build everything from business jets, like the Cessna Citation, to military trainers such as the Beechcraft T-6, serving both private and government needs. Textron also makes advanced helicopters like the V-22 Osprey, which combines the features of helicopters and airplanes for military use, and the Bell 429, used in police work and emergency medical services. In defense, Textron Systems provides everything from drones, such as the Shadow Tactical UAS, to armored vehicles, helping with various security operations. Additionally, through its Kautex subsidiary, Textron manufactures automotive parts like fuel-efficient systems and safety features for cars, enhancing both performance and safety.
Textron generates its revenue through the sale of its diverse products and services across aviation, defense, and industrial sectors, catering to both domestic and international clients including government contracts and commercial entities. Its revenue sources include both direct sales as well as large, multi-year government contracts.
To further enhance its revenue, Textron provides extensive aftermarket services. These services include supplying replacement parts, and offering maintenance, repair, and overhaul services for aviation and rotorcraft products. The company also offers training and support services, including pilot and maintenance training. Additionally, Textron offers retrofitting and modernization services for defense and industrial products, allowing for lifecycle extension and enhancement of existing equipment. This comprehensive approach to aftermarket services helps to secure ongoing customer engagement and also bolsters recurrent revenue, making it a vital aspect of Textron’s business model.
4. Aerospace
Aerospace companies often possess technical expertise and have made significant capital investments to produce complex products. It is an industry where innovation is important, and lately, emissions and automation are in focus, so companies that boast advances in these areas can take market share. On the other hand, demand for aerospace products can ebb and flow with economic cycles and geopolitical tensions, which can be particularly painful for companies with high fixed costs.
Textron’s peers and competitors include Boeing (NYSE:BA), Raytheon (NYSE:RTX), and General Dynamics (NYSE:GD)
5. Revenue Growth
Reviewing a company’s long-term sales performance reveals insights into its quality. Any business can have short-term success, but a top-tier one grows for years. Unfortunately, Textron’s 3.4% annualized revenue growth over the last five years was sluggish. This fell short of our benchmark for the industrials sector and is a tough starting point for our analysis.
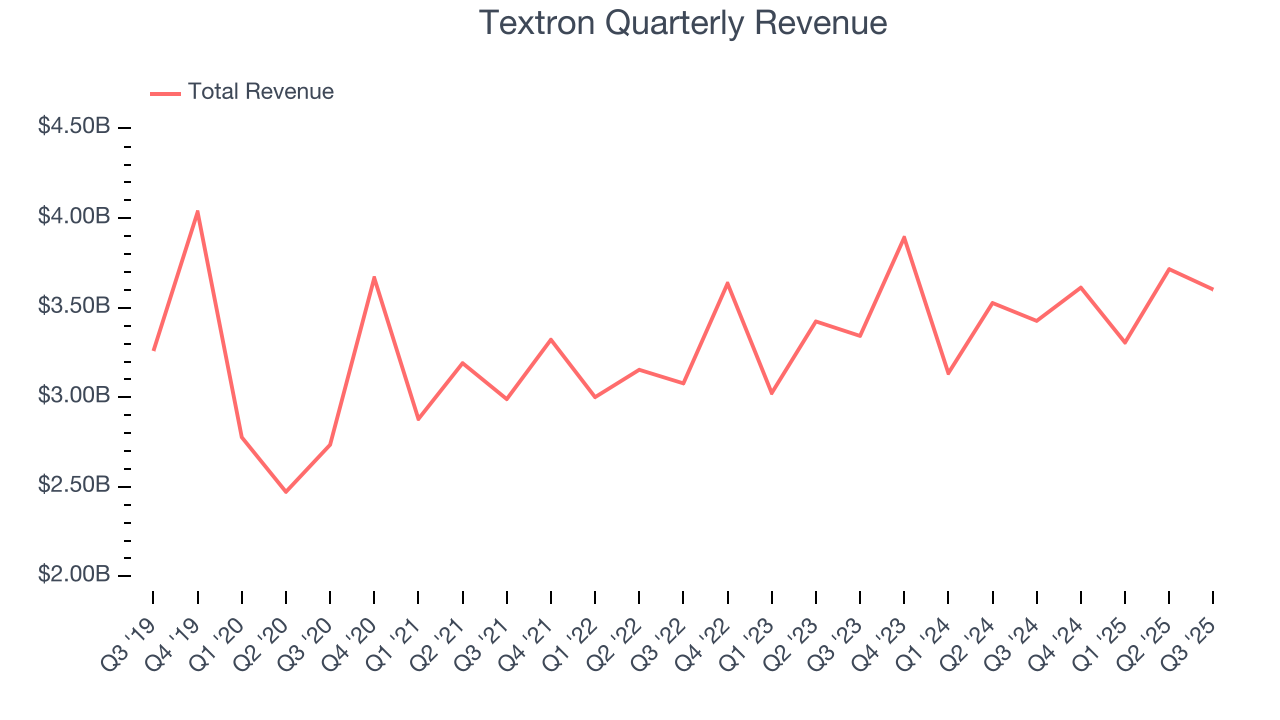
Long-term growth is the most important, but within industrials, a half-decade historical view may miss new industry trends or demand cycles. Textron’s annualized revenue growth of 3% over the last two years aligns with its five-year trend, suggesting its demand was consistently weak. 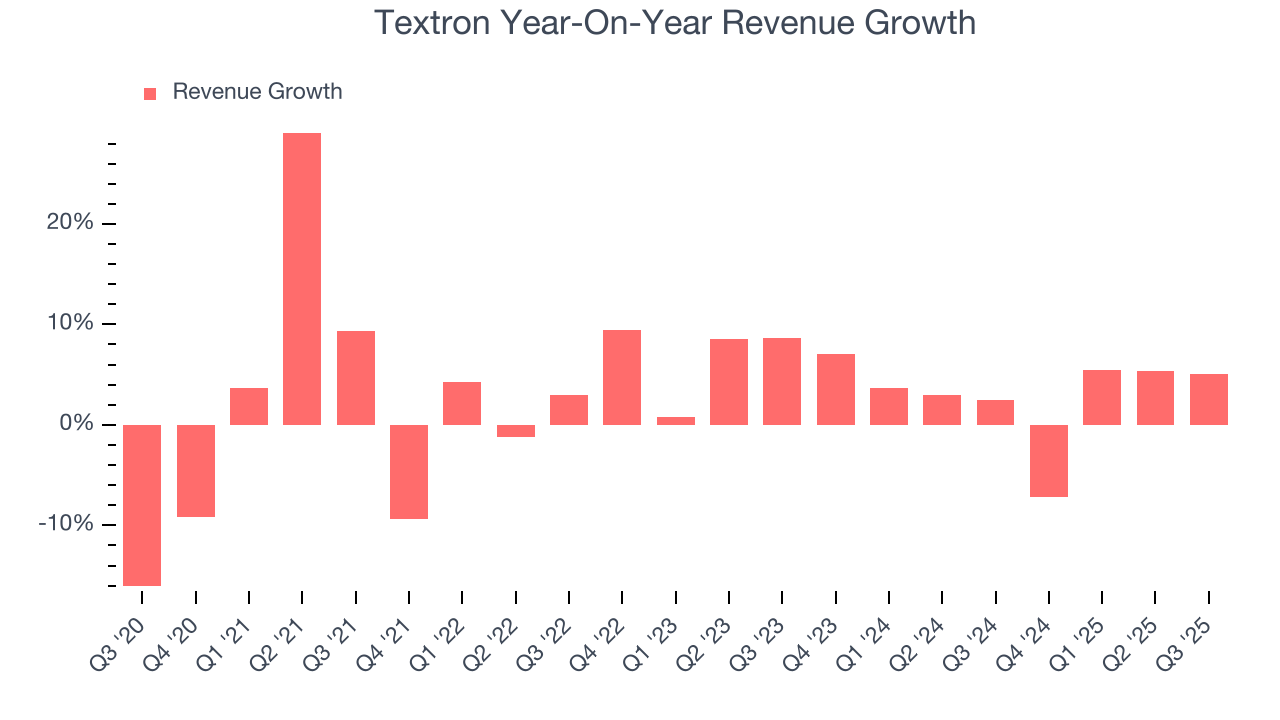
This quarter, Textron’s revenue grew by 5.1% year on year to $3.60 billion, missing Wall Street’s estimates.
Looking ahead, sell-side analysts expect revenue to grow 8.7% over the next 12 months, an improvement versus the last two years. This projection is above the sector average and suggests its newer products and services will fuel better top-line performance.
6. Operating Margin
Textron’s operating margin might fluctuated slightly over the last 12 months but has remained more or less the same, averaging 8.4% over the last five years. This profitability was higher than the broader industrials sector, showing it did a decent job managing its expenses.
Looking at the trend in its profitability, Textron’s operating margin might fluctuated slightly but has generally stayed the same over the last five years. This raises questions about the company’s expense base because its revenue growth should have given it leverage on its fixed costs, resulting in better economies of scale and profitability.
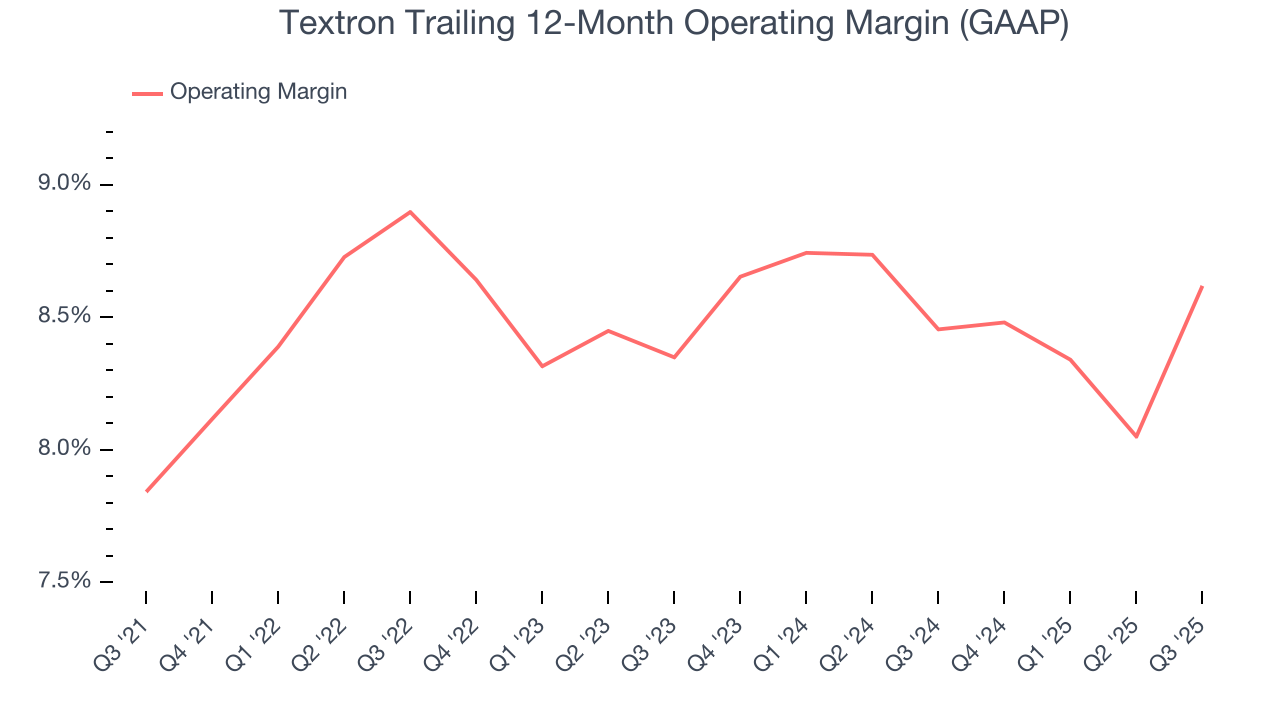
This quarter, Textron generated an operating margin profit margin of 9.9%, up 2.3 percentage points year on year. This increase was a welcome development and shows it was more efficient.
7. Earnings Per Share
We track the long-term change in earnings per share (EPS) for the same reason as long-term revenue growth. Compared to revenue, however, EPS highlights whether a company’s growth is profitable.
Textron’s EPS grew at an astounding 22% compounded annual growth rate over the last five years, higher than its 3.4% annualized revenue growth. This tells us the company became more profitable on a per-share basis as it expanded.
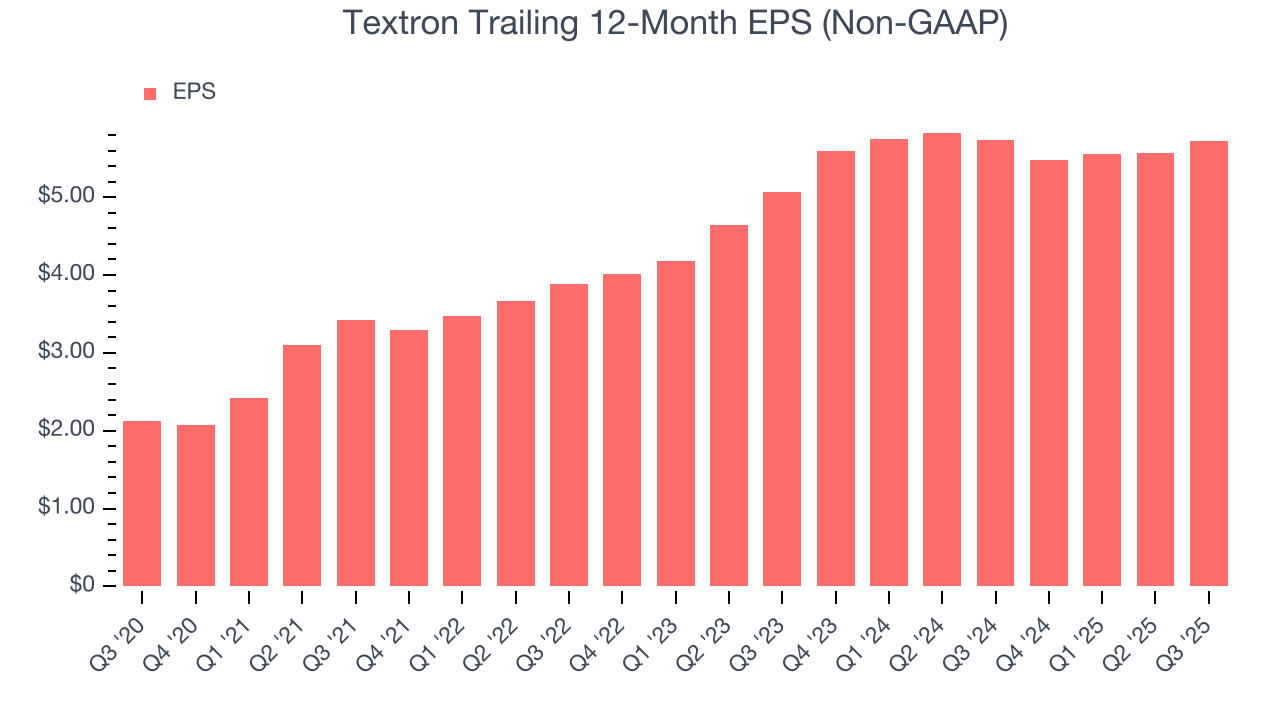
We can take a deeper look into Textron’s earnings quality to better understand the drivers of its performance. A five-year view shows that Textron has repurchased its stock, shrinking its share count by 21.9%. This tells us its EPS outperformed its revenue not because of increased operational efficiency but financial engineering, as buybacks boost per share earnings. 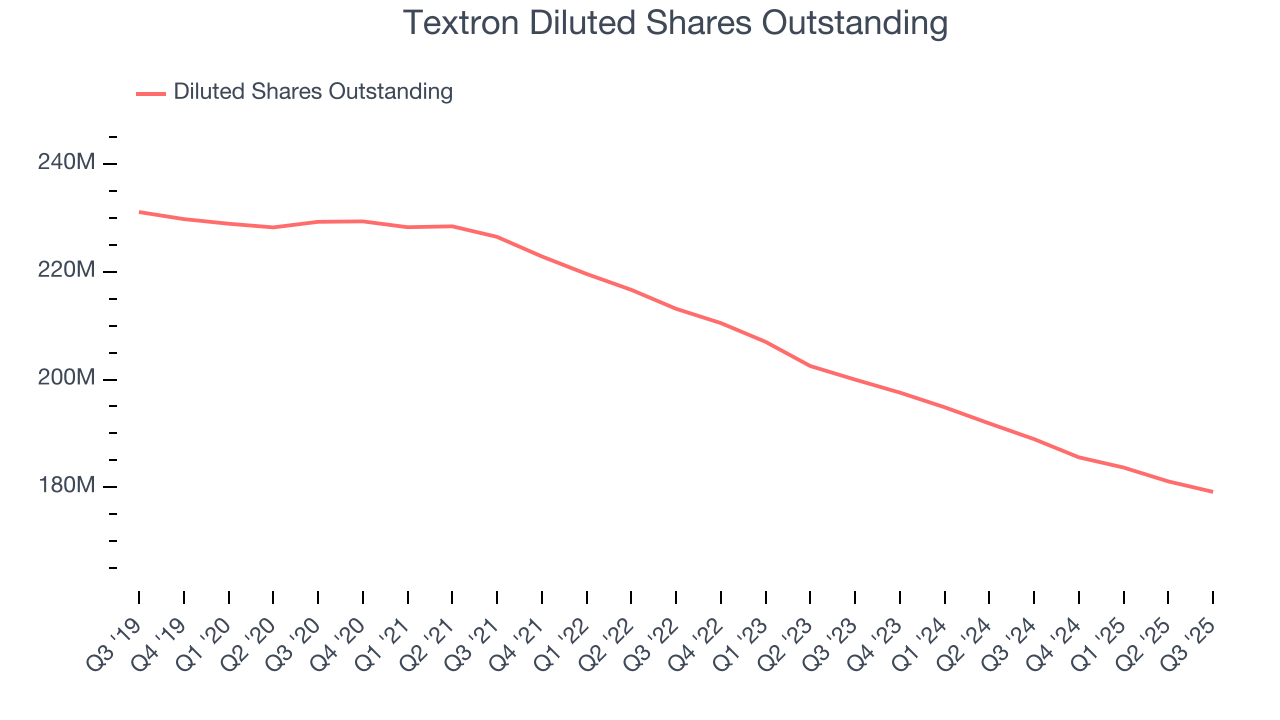
Like with revenue, we analyze EPS over a shorter period to see if we are missing a change in the business.
For Textron, its two-year annual EPS growth of 6.2% was lower than its five-year trend. We hope its growth can accelerate in the future.
In Q3, Textron reported adjusted EPS of $1.55, up from $1.40 in the same quarter last year. This print beat analysts’ estimates by 6.4%. Over the next 12 months, Wall Street expects Textron’s full-year EPS of $5.72 to grow 19.1%.
8. Cash Is King
If you’ve followed StockStory for a while, you know we emphasize free cash flow. Why, you ask? We believe that in the end, cash is king, and you can’t use accounting profits to pay the bills.
Textron has shown decent cash profitability, giving it some flexibility to reinvest or return capital to investors. The company’s free cash flow margin averaged 7.1% over the last five years, slightly better than the broader industrials sector.
Taking a step back, we can see that Textron’s margin dropped by 5.6 percentage points during that time. If its declines continue, it could signal increasing investment needs and capital intensity.
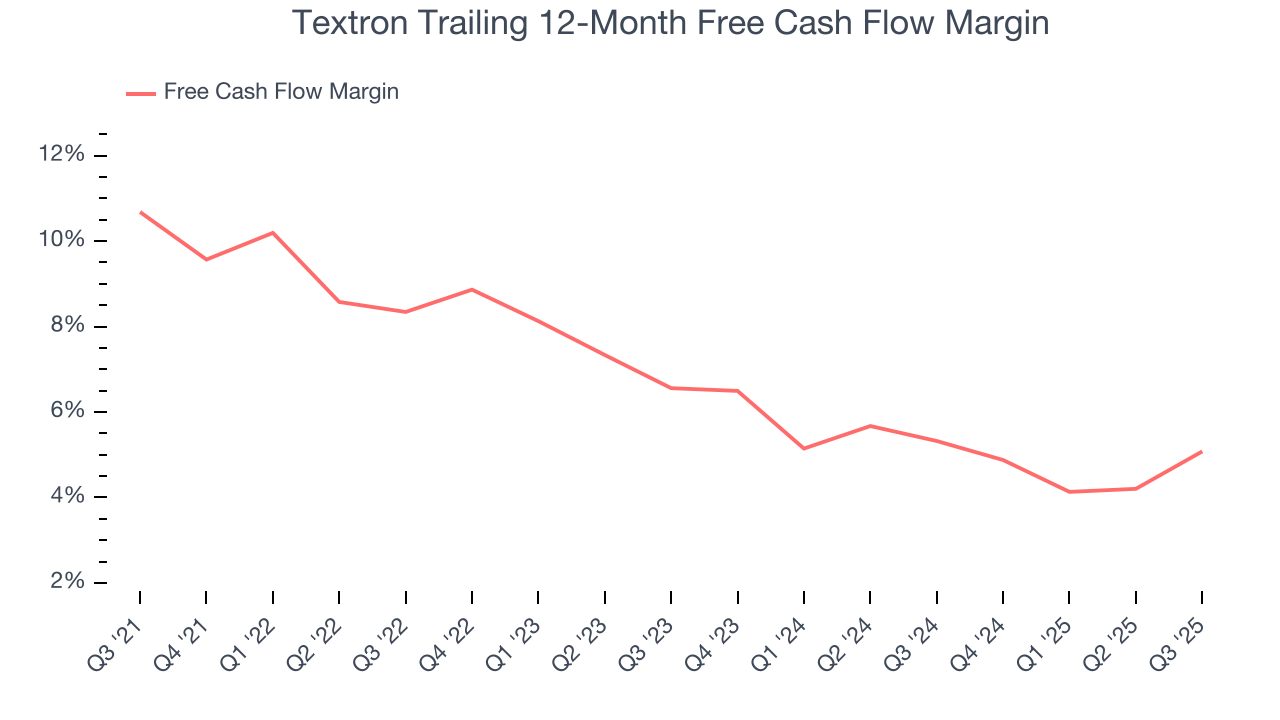
Textron’s free cash flow clocked in at $273 million in Q3, equivalent to a 7.6% margin. This result was good as its margin was 3.5 percentage points higher than in the same quarter last year, but we wouldn’t put too much weight on the short term because investment needs can be seasonal, causing temporary swings. Long-term trends are more important.
9. Return on Invested Capital (ROIC)
EPS and free cash flow tell us whether a company was profitable while growing its revenue. But was it capital-efficient? A company’s ROIC explains this by showing how much operating profit it makes compared to the money it has raised (debt and equity).
Although Textron hasn’t been the highest-quality company lately because of its poor top-line performance, it historically found a few growth initiatives that worked. Its five-year average ROIC was 12.4%, higher than most industrials businesses.
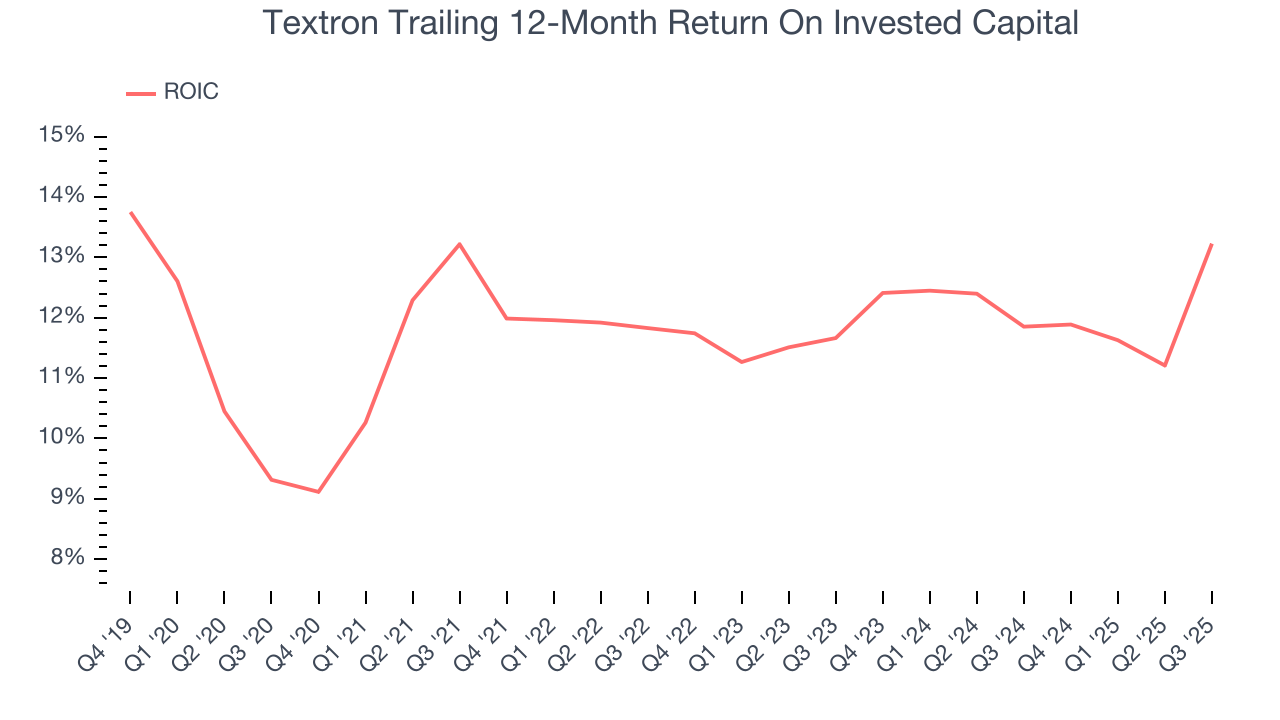
We like to invest in businesses with high returns, but the trend in a company’s ROIC is what often surprises the market and moves the stock price. Uneventfully, Textron’s ROIC has stayed the same over the last few years. Given the company’s underwhelming financial performance in other areas, we’d like to see its returns improve before recommending the stock.
10. Balance Sheet Assessment
Textron reported $1.45 billion of cash and $3.39 billion of debt on its balance sheet in the most recent quarter. As investors in high-quality companies, we primarily focus on two things: 1) that a company’s debt level isn’t too high and 2) that its interest payments are not excessively burdening the business.
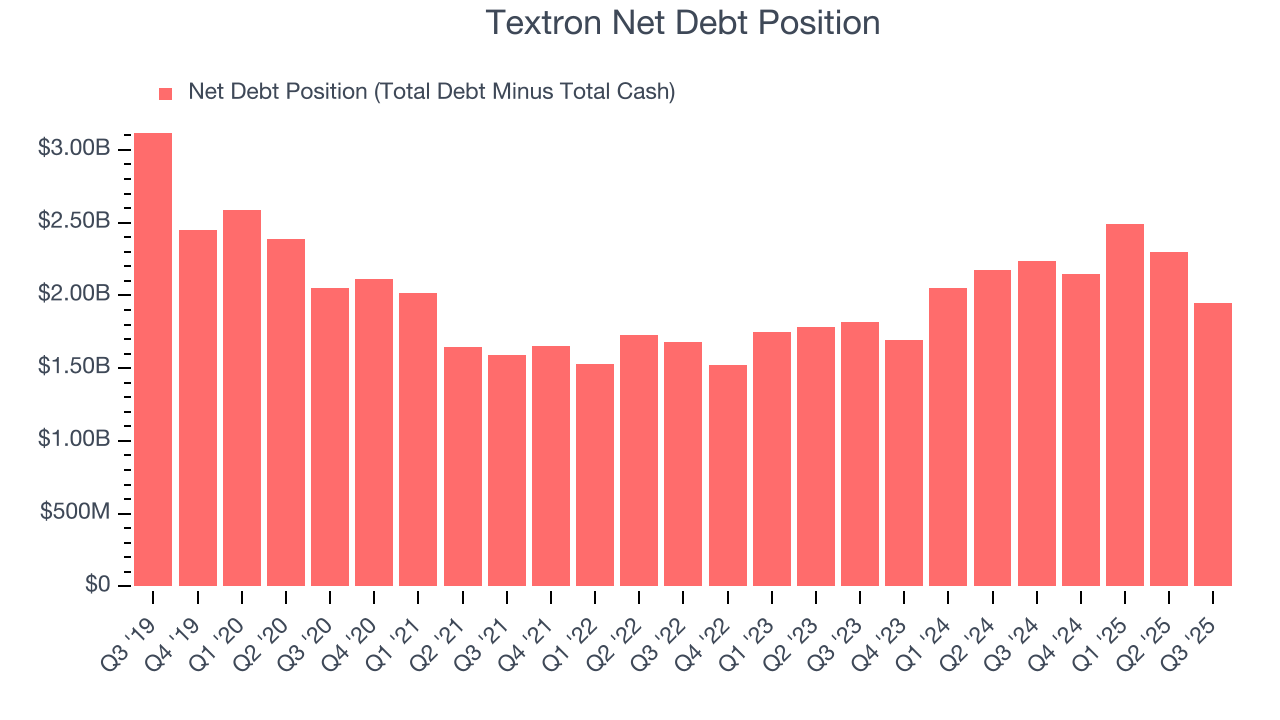
With $1.69 billion of EBITDA over the last 12 months, we view Textron’s 1.2× net-debt-to-EBITDA ratio as safe. We also see its $98 million of annual interest expenses as appropriate. The company’s profits give it plenty of breathing room, allowing it to continue investing in growth initiatives.
11. Key Takeaways from Textron’s Q3 Results
It was good to see Textron beat analysts’ EPS expectations this quarter. We were also happy its EBITDA outperformed Wall Street’s estimates. On the other hand, its revenue missed. Overall, this was a mixed quarter. The stock traded down 1.3% to $81.49 immediately following the results.
12. Is Now The Time To Buy Textron?
Updated: January 24, 2026 at 10:29 PM EST
The latest quarterly earnings matters, sure, but we actually think longer-term fundamentals and valuation matter more. Investors should consider all these pieces before deciding whether or not to invest in Textron.
Textron isn’t a terrible business, but it doesn’t pass our bar. For starters, its revenue growth was weak over the last five years. And while its astounding EPS growth over the last five years shows its profits are trickling down to shareholders, the downside is its cash profitability fell over the last five years. On top of that, its organic revenue growth has disappointed.
Textron’s P/E ratio based on the next 12 months is 14.5x. This valuation multiple is fair, but we don’t have much faith in the company. We're fairly confident there are better stocks to buy right now.
Wall Street analysts have a consensus one-year price target of $98.41 on the company (compared to the current share price of $94.97).