
U.S. Bancorp (USB)
U.S. Bancorp doesn’t excite us. Its revenue growth has been weak and its profitability has caved, showing it’s struggling to adapt.― StockStory Analyst Team
1. News


2. Summary
Why We Think U.S. Bancorp Will Underperform
With roots dating back to 1863 and a presence across 26 states primarily in the Midwest and West, U.S. Bancorp (NYSE:USB) is one of America's largest banks providing lending, deposit services, wealth management, payment processing, and merchant services to individuals and businesses.
- Net interest margin of 2.7% is well below other banks, signaling its loans aren’t very profitable
- Scale is a double-edged sword because it limits the firm’s growth potential compared to its smaller competitors, as reflected in its below-average annual net interest income increases of 5.4% for the last five years
- A positive is that its productivity and efficiency ratio profits are expected to increase next year as some fixed cost leverage kicks in


U.S. Bancorp’s quality isn’t up to par. There are more promising prospects in the market.
Why There Are Better Opportunities Than U.S. Bancorp


At $51.61 per share, U.S. Bancorp trades at 1.3x forward P/B. Not only is U.S. Bancorp’s multiple richer than most banking peers, but it’s also expensive for its revenue characteristics.
We’d rather invest in similarly-priced but higher-quality companies with more reliable earnings growth.
3. U.S. Bancorp (USB) Research Report: Q4 CY2025 Update
Financial services giant U.S. Bancorp (NYSE:USB) reported Q4 CY2025 results topping the market’s revenue expectations, with sales up 5.1% year on year to $7.37 billion. Its non-GAAP profit of $1.26 per share was 6% above analysts’ consensus estimates.
U.S. Bancorp (USB) Q4 CY2025 Highlights:
- Net Interest Income: $4.31 billion vs analyst estimates of $4.28 billion (4% year-on-year growth, 0.7% beat)
- Net Interest Margin: 2.8% vs analyst estimates of 2.8% (in line)
- Revenue: $7.37 billion vs analyst estimates of $7.32 billion (5.1% year-on-year growth, 0.6% beat)
- Efficiency Ratio: 57.4% vs analyst estimates of 57.8% (37.3 basis point beat)
- Adjusted EPS: $1.26 vs analyst estimates of $1.19 (6% beat)
- Tangible Book Value per Share: $29.12 vs analyst estimates of $28.62 (22.6% year-on-year growth, 1.8% beat)
- Market Capitalization: $84.56 billion
Company Overview
With roots dating back to 1863 and a presence across 26 states primarily in the Midwest and West, U.S. Bancorp (NYSE:USB) is one of America's largest banks providing lending, deposit services, wealth management, payment processing, and merchant services to individuals and businesses.
U.S. Bancorp operates through several key business segments that serve different customer needs. Its Consumer and Business Banking division provides everyday banking services like checking accounts, savings products, and loans to individuals and small businesses through both physical branches and digital channels. The Wealth, Corporate, Commercial and Institutional Banking segment caters to higher-net-worth individuals, large corporations, and institutional clients with specialized services including asset management, investment advisory, and complex lending solutions.
The company's Payment Services division is a significant revenue generator, processing transactions for merchants and offering credit, debit, and corporate card services. This makes U.S. Bancorp one of the largest payment processors in the United States through its subsidiary Elavon, which handles merchant transactions domestically and in parts of Europe and Canada.
A typical corporate customer might use U.S. Bancorp for a comprehensive suite of services—maintaining operating accounts, processing employee payroll, obtaining financing for expansion, managing treasury operations, and utilizing corporate cards for business expenses. Meanwhile, a retail customer might have a mortgage, checking account, credit card, and investment portfolio all managed through the bank.
U.S. Bancorp generates revenue primarily through interest income on loans, fees from account services and transactions, and commissions from wealth management and investment services. As a systemically important financial institution, the bank operates under extensive regulatory oversight from agencies including the Federal Reserve, the Office of the Comptroller of the Currency, and the Consumer Financial Protection Bureau.
4. Diversified Banks
At their core, diversified banks take in deposits and engage in various forms of lending, which means revenue is generated through interest rate spreads (difference between loan and deposit rates) and fees. Other revenue comes from adjacent services such as wealth management, card and account fees, and products such as annuities. These institutions benefit from rising interest rates that improve NIMs (net interest margins), digital transformation reducing operational costs, and expanding wealth management services as populations age. However, they face headwinds including fintech competition disrupting traditional models (how disruptive is crypto?), stringent regulatory requirements increasing compliance costs, and cybersecurity threats requiring substantial technology investments. Economic downturns also pose risks through potential loan defaults and compressed margins during accommodative monetary policy periods.
U.S. Bancorp competes with other major financial institutions including JPMorgan Chase (NYSE:JPM), Bank of America (NYSE:BAC), Wells Fargo (NYSE:WFC), and PNC Financial Services (NYSE:PNC), as well as regional banks like Truist Financial (NYSE:TFC) and Fifth Third Bancorp (NASDAQ:FITB).
5. Sales Growth
Net interest income and and fee-based revenue are the two pillars supporting bank earnings. The former captures profit from the gap between lending rates and deposit costs, while the latter encompasses charges for banking services, credit products, wealth management, and trading activities. Regrettably, U.S. Bancorp’s revenue grew at a sluggish 4.4% compounded annual growth rate over the last five years. This fell short of our benchmark for the banking sector and is a rough starting point for our analysis.
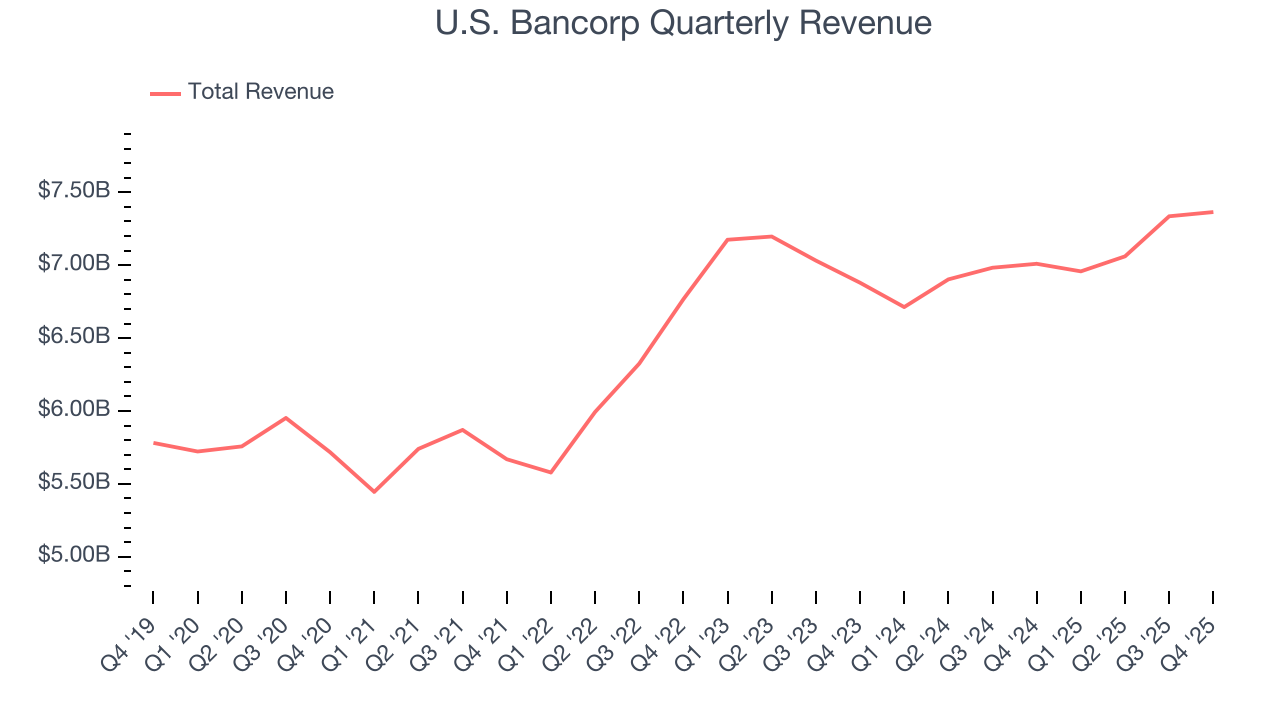
Long-term growth is the most important, but within financials, a half-decade historical view may miss recent interest rate changes and market returns. U.S. Bancorp’s recent performance shows its demand has slowed as its revenue was flat over the last two years. 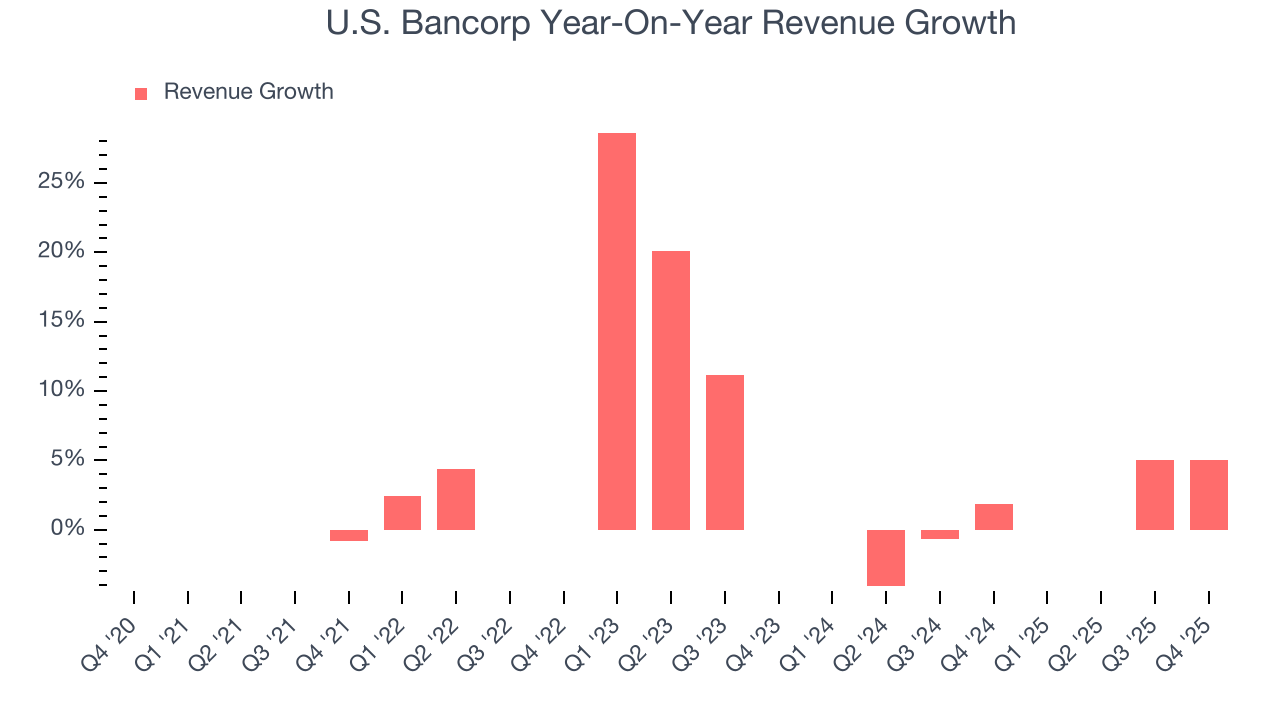 Note: Quarters not shown were determined to be outliers, impacted by outsized investment gains/losses that are not indicative of the recurring fundamentals of the business.
This quarter, U.S. Bancorp reported year-on-year revenue growth of 5.1%, and its $7.37 billion of revenue exceeded Wall Street’s estimates by 0.6%.
Net interest income made up 58.6% of the company’s total revenue during the last five years, meaning U.S. Bancorp’s growth drivers strike a balance between lending and non-lending activities.
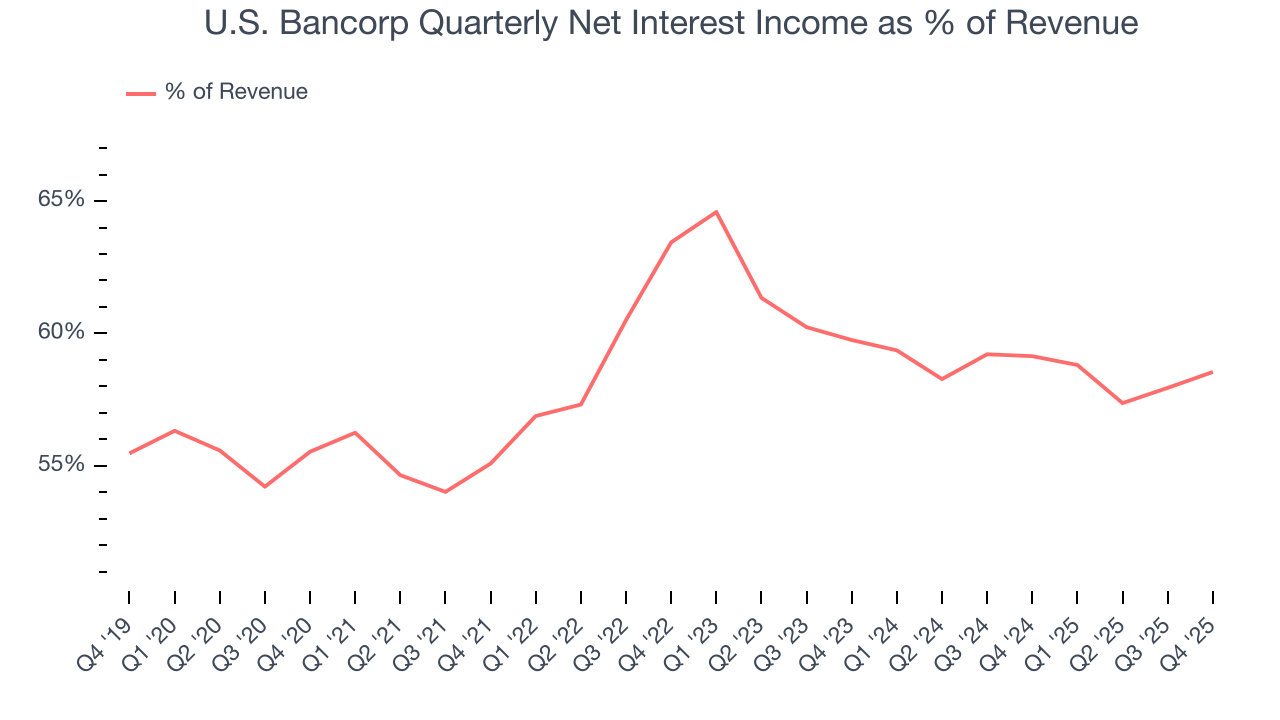
Our experience and research show the market cares primarily about a bank’s net interest income growth as non-interest income is considered a lower-quality and non-recurring revenue source.
6. Efficiency Ratio
Topline growth carries importance, but the overall profitability behind this expansion determines true value creation. For banks, the efficiency ratio captures this relationship by measuring non-interest expenses, including salaries, facilities, technology, and marketing, against total revenue.
Markets emphasize efficiency ratio trends over static measurements, recognizing that revenue compositions drive different expense bases. Lower efficiency ratios signal superior performance by indicating that banks are controlling costs effectively relative to their income.
Over the last five years, U.S. Bancorp’s efficiency ratio has increased by 1.3 percentage points, going from 59.8% to 58.7%. Said differently, the company’s expenses have increased at a faster rate than revenue, which usually raises questions unless the company is in high-growth mode and reinvesting its profits into attractive ventures.
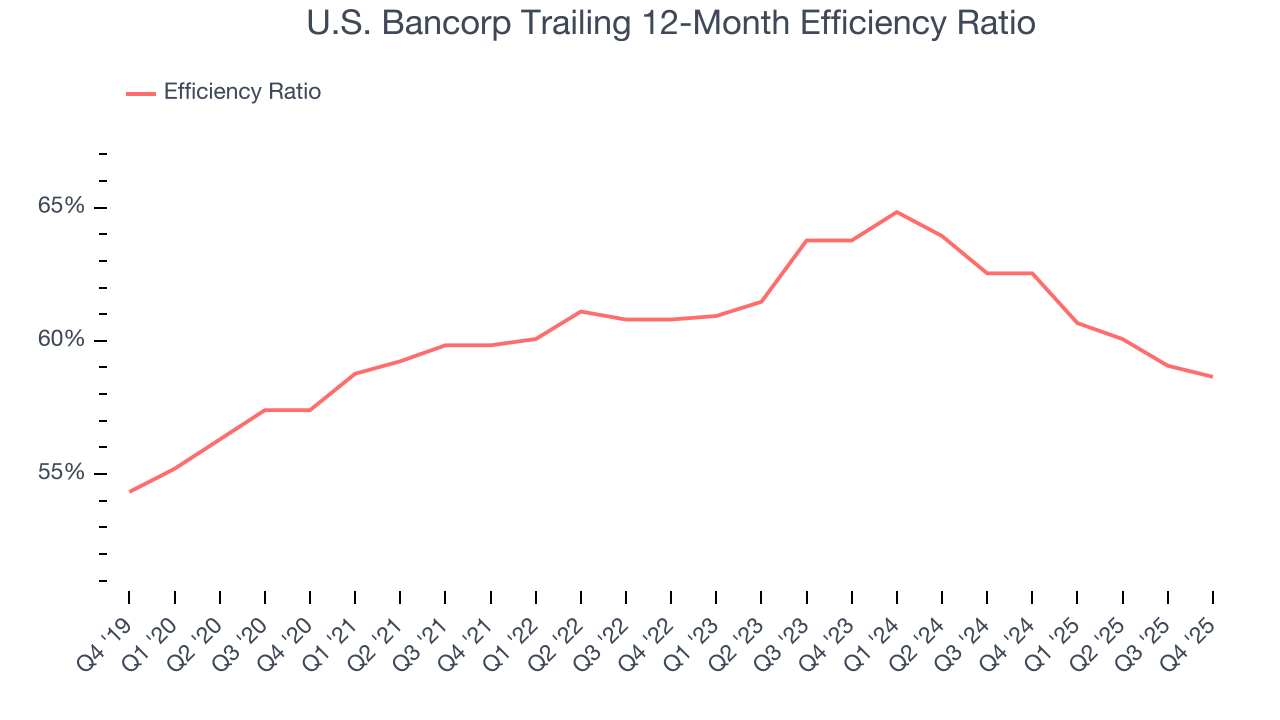
In Q4, U.S. Bancorp’s efficiency ratio was 57.4%, beating analysts’ expectations by 37.3 basis points (100 basis points = 1 percentage point).
For the next 12 months, Wall Street expects U.S. Bancorp to rein in some of its expenses as it anticipates an efficiency ratio of 57.6%.
7. Earnings Per Share
Revenue trends explain a company’s historical growth, but the long-term change in earnings per share (EPS) points to the profitability of that growth – for example, a company could inflate its sales through excessive spending on advertising and promotions.
U.S. Bancorp’s EPS grew at an unimpressive 8.5% compounded annual growth rate over the last five years. On the bright side, this performance was better than its 4.4% annualized revenue growth and tells us the company became more profitable on a per-share basis as it expanded.
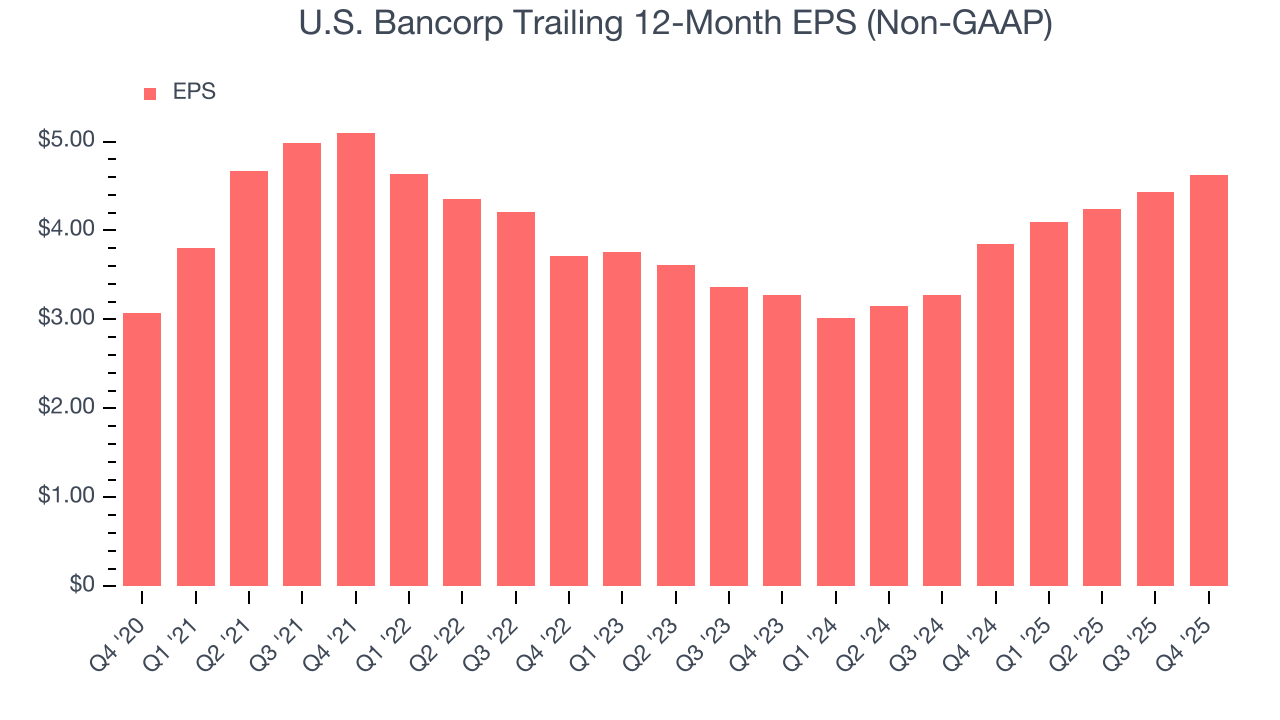
Like with revenue, we analyze EPS over a shorter period to see if we are missing a change in the business.
For U.S. Bancorp, its two-year annual EPS growth of 18.7% was higher than its five-year trend. This acceleration made it one of the faster-growing banking companies in recent history.
In Q4, U.S. Bancorp reported adjusted EPS of $1.26, up from $1.07 in the same quarter last year. This print beat analysts’ estimates by 6%. Over the next 12 months, Wall Street expects U.S. Bancorp’s full-year EPS of $4.62 to grow 6.7%.
8. Tangible Book Value Per Share (TBVPS)
Banks operate as balance sheet businesses, with profits generated through borrowing and lending activities. Valuations reflect this reality, emphasizing balance sheet strength and long-term book value compounding ability.
This explains why tangible book value per share (TBVPS) stands as the premier banking metric. TBVPS strips away questionable intangible assets, revealing concrete per-share net worth that investors can trust. Other (and more commonly known) per-share metrics like EPS can sometimes be murky due to M&A or accounting rules allowing for loan losses to be spread out.
U.S. Bancorp’s TBVPS grew at a tepid 3.7% annual clip over the last five years. However, TBVPS growth has accelerated recently, growing by 16.7% annually over the last two years from $21.37 to $29.12 per share.
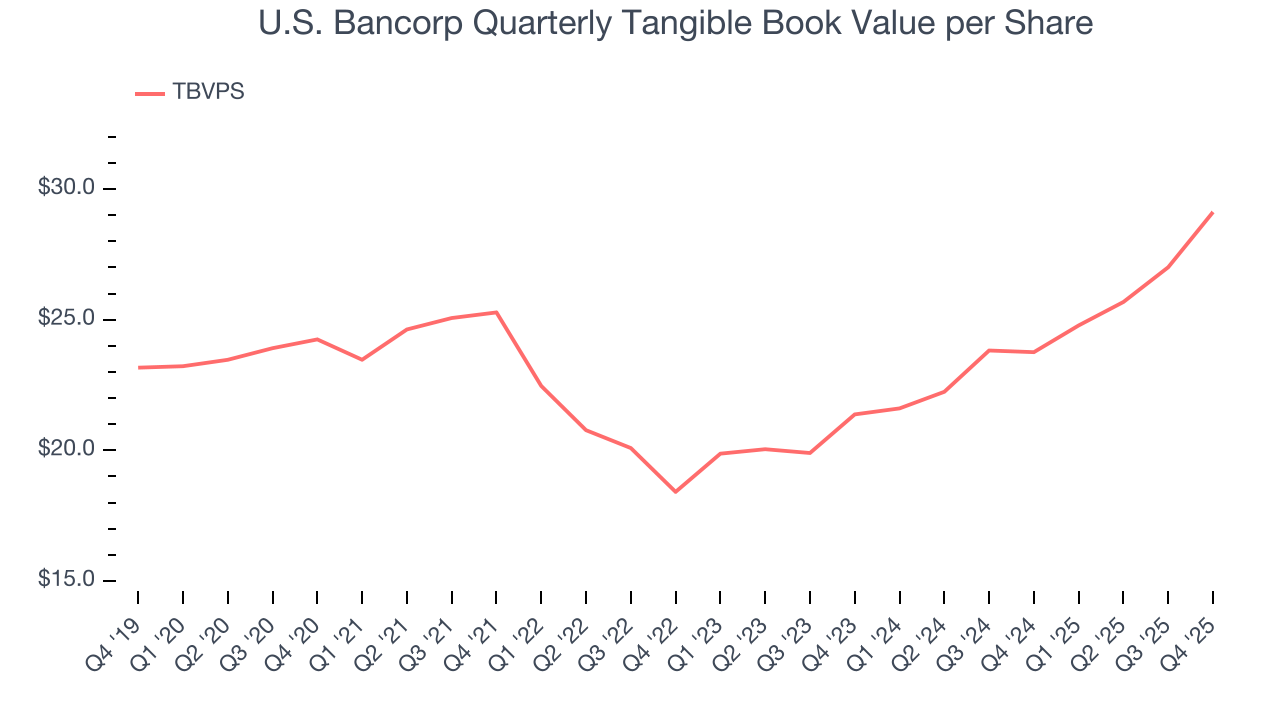
Over the next 12 months, Consensus estimates call for U.S. Bancorp’s TBVPS to grow by 8.7% to $31.67, paltry growth rate.
9. Balance Sheet Assessment
Leverage is core to a financial firm’s business model (loans funded by deposits). To ensure economic stability and avoid a repeat of the 2008 GFC, regulators require certain levels of capital and liquidity, focusing on the Tier 1 capital ratio.
Tier 1 capital is the highest-quality capital that a firm holds, consisting primarily of common stock and retained earnings, but also physical gold. It serves as the primary cushion against losses and is the first line of defense in times of financial distress.
This capital is divided by risk-weighted assets to derive the Tier 1 capital ratio. Risk-weighted means that cash and US treasury securities are assigned little risk while unsecured consumer loans and equity investments get much higher risk weights, for example.
New regulation after the 2008 financial crisis requires that all firms must maintain a Tier 1 capital ratio greater than 4.5%. On top of this, there are additional buffers based on scale, risk profile, and other regulatory classifications, so that at the end of the day, firms generally must maintain a 7-10% ratio at minimum.
Over the last two years, U.S. Bancorp has averaged a Tier 1 capital ratio of 10.6%, which is considered safe and well capitalized in the event that macro or market conditions suddenly deteriorate.
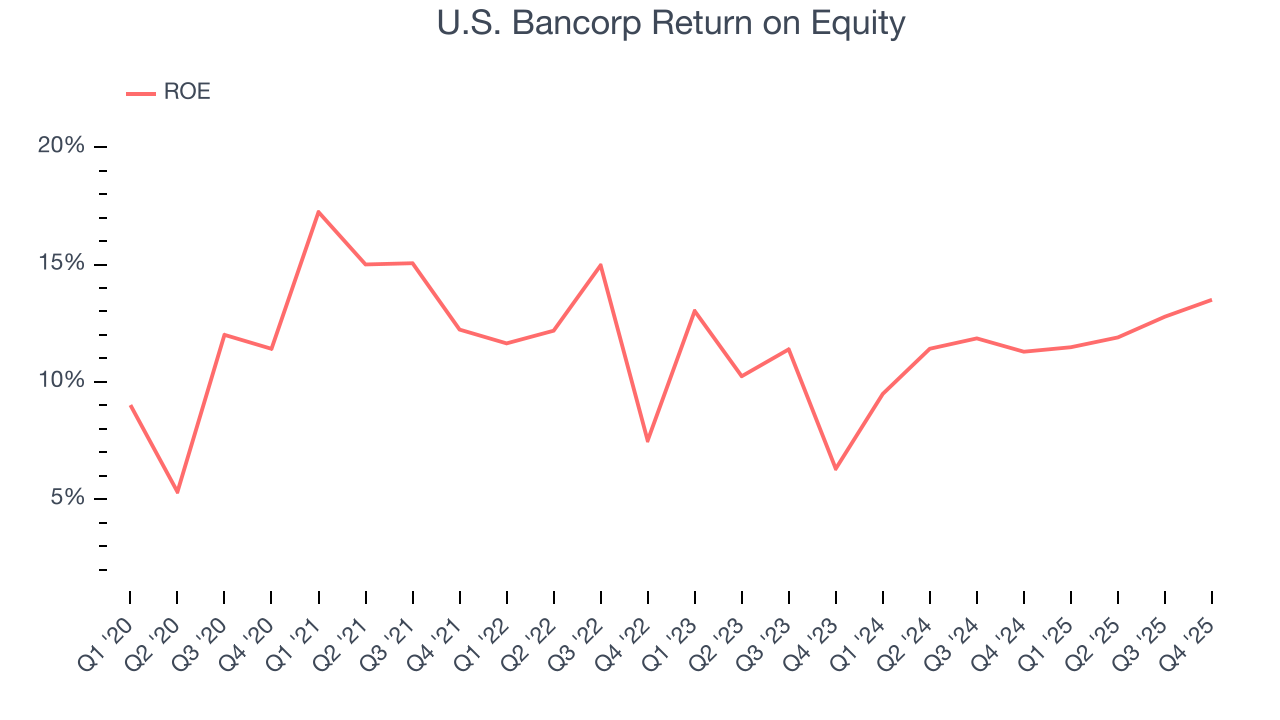
10. Return on Equity
Return on equity, or ROE, tells us how much profit a company generates for each dollar of shareholder equity, a key funding source for banks. Over a long period, banks with high ROE tend to compound shareholder wealth faster through retained earnings, buybacks, and dividends.
Over the last five years, U.S. Bancorp has averaged an ROE of 12%, healthy for a company operating in a sector where the average shakes out around 7.5% and those putting up 15%+ are greatly admired. This is a bright spot for U.S. Bancorp.
11. Key Takeaways from U.S. Bancorp’s Q4 Results
It was encouraging to see U.S. Bancorp beat analysts’ tangible book value per share expectations this quarter. We were also happy its net interest income narrowly outperformed Wall Street’s estimates. Overall, this print had some key positives. The stock remained flat at $54.21 immediately following the results.
12. Is Now The Time To Buy U.S. Bancorp?
Updated: March 24, 2026 at 12:58 AM EDT
A common mistake we notice when investors are deciding whether to buy a stock or not is that they simply look at the latest earnings results. Business quality and valuation matter more, so we urge you to understand these dynamics as well.
U.S. Bancorp isn’t a terrible business, but it doesn’t pass our quality test. To begin with, its revenue growth was weak over the last five years. While its anticipated efficiency ratio over the next year signals it will gain leverage on its fixed costs, the downside is its net interest margin limits its operating profit potential compared to other banks that can earn more, all else equal.. On top of that, its net interest income growth was weak over the last five years.
U.S. Bancorp’s P/B ratio based on the next 12 months is 1.3x. This valuation multiple is fair, but we don’t have much faith in the company. We're fairly confident there are better investments elsewhere.
Wall Street analysts have a consensus one-year price target of $63.95 on the company (compared to the current share price of $51.61).
Although the price target is bullish, readers should exercise caution because analysts tend to be overly optimistic. The firms they work for, often big banks, have relationships with companies that extend into fundraising, M&A advisory, and other rewarding business lines. As a result, they typically hesitate to say bad things for fear they will lose out. We at StockStory do not suffer from such conflicts of interest, so we’ll always tell it like it is.