
Valmont (VMI)
We’re not sold on Valmont. Its sales have recently plummeted and its meager cash generation gives it few resources to turn the ship around.― StockStory Analyst Team
1. News

2. Summary
Why Valmont Is Not Exciting
Credited with an invention in the 1950s that improved crop yields, Valmont (NYSE:VMI) provides engineered products and infrastructure services for the agricultural industry.
- Demand will likely be soft over the next 12 months as Wall Street’s estimates imply tepid growth of 2.8%
- Gross margin of 28.3% is below its competitors, leaving less money to invest in areas like marketing and R&D
- A positive is that its performance over the past five years shows its incremental sales were extremely profitable, as its annual earnings per share growth of 18.7% outpaced its revenue gains


Valmont falls short of our expectations. We’re hunting for superior stocks elsewhere.
Why There Are Better Opportunities Than Valmont


At $475.33 per share, Valmont trades at 23x forward P/E. This multiple is cheaper than most industrials peers, but we think this is justified.
Cheap stocks can look like great bargains at first glance, but you often get what you pay for. These mediocre businesses often have less earnings power, meaning there is more reliance on a re-rating to generate good returns - an unlikely scenario for low-quality companies.
3. Valmont (VMI) Research Report: Q4 CY2025 Update
Infrastructure and agriculture equipment manufacturer Valmont Industries (NYSE:VMI) missed Wall Street’s revenue expectations in Q4 CY2025, with sales flat year on year at $1.04 billion. On the other hand, the company’s outlook for the full year was close to analysts’ estimates with revenue guided to $4.3 billion at the midpoint. Its GAAP profit of $9.05 per share was 83.1% above analysts’ consensus estimates.
Valmont (VMI) Q4 CY2025 Highlights:
- Revenue: $1.04 billion vs analyst estimates of $1.05 billion (flat year on year, 0.7% miss)
- EPS (GAAP): $9.05 vs analyst estimates of $4.94 (83.1% beat)
- Adjusted EBITDA: $638.8 million vs analyst estimates of $168.2 million (61.5% margin, significant beat)
- EPS (GAAP) guidance for the upcoming financial year 2026 is $22 at the midpoint, beating analyst estimates by 4%
- Operating Margin: 11.2%, in line with the same quarter last year
- Free Cash Flow Margin: 6.8%, down from 16.2% in the same quarter last year
- Backlog: $1.65 billion at quarter end, up 15.1% year on year
- Market Capitalization: $9.36 billion
Company Overview
Credited with an invention in the 1950s that improved crop yields, Valmont (NYSE:VMI) provides engineered products and infrastructure services for the agricultural industry.
Founded in 1946 and headquartered in Omaha, Nebraska, Valmont has established itself as a leader in its field, with operations spanning North America, Europe, Asia, and Australia. Valmont operates through two main reportable segments: Infrastructure and Agriculture. The Infrastructure segment is responsible for the manufacture and distribution of products and solutions serving utility, solar, lighting, transportation, and telecommunications markets, as well as providing coatings services to protect metal products. The Agriculture segment focuses on the manufacture of center pivot components and linear irrigation equipment for agricultural markets, including parts, tubular products, and advanced technology solutions for precision agriculture.
The Infrastructure segment offers a wide range of products, including steel, pre-stressed concrete, and composite structures for electrical transmission, substation, and distribution applications. It also provides steel, aluminum, wood, and composite poles and structures for lighting and transportation applications, as well as coatings services to inhibit corrosion and extend the service life of various materials. Additionally, this segment manufactures and distributes products for the wireless communication market and solar single-axis trackers for the renewable energy sector.
The Agriculture segment is known for its Valley® brand of mechanical irrigation equipment and related service parts. These irrigation machines are designed to efficiently apply water and chemicals to crops, with options ranging from standard center pivots to corner machines and linear systems. The segment has also expanded into technology products and services, offering advanced solutions for crop monitoring and management through artificial intelligence and machine learning.
4. Building Materials
Traditionally, building materials companies have built competitive advantages with economies of scale, brand recognition, and strong relationships with builders and contractors. More recently, advances to address labor availability and job site productivity have spurred innovation. Additionally, companies in the space that can produce more energy-efficient materials have opportunities to take share. However, these companies are at the whim of construction volumes, which tend to be cyclical and can be impacted heavily by economic factors such as interest rates. Additionally, the costs of raw materials can be driven by a myriad of worldwide factors and greatly influence the profitability of building materials companies.
Top competitors in Valmont’s established markets include AZZ (NYSE:AZZ), which competes with Valmont’s metal coatings offerings, Lindsay (NYSE:LNN), which competes with Valmont in the agricultural sector, and American Tower (NYSE:AMT), which competes with Valmont in its other various infrastructure markets.
5. Revenue Growth
A company’s long-term performance is an indicator of its overall quality. Any business can put up a good quarter or two, but many enduring ones grow for years. Over the last five years, Valmont grew its sales at a mediocre 7.2% compounded annual growth rate. This fell short of our benchmark for the industrials sector and is a tough starting point for our analysis.
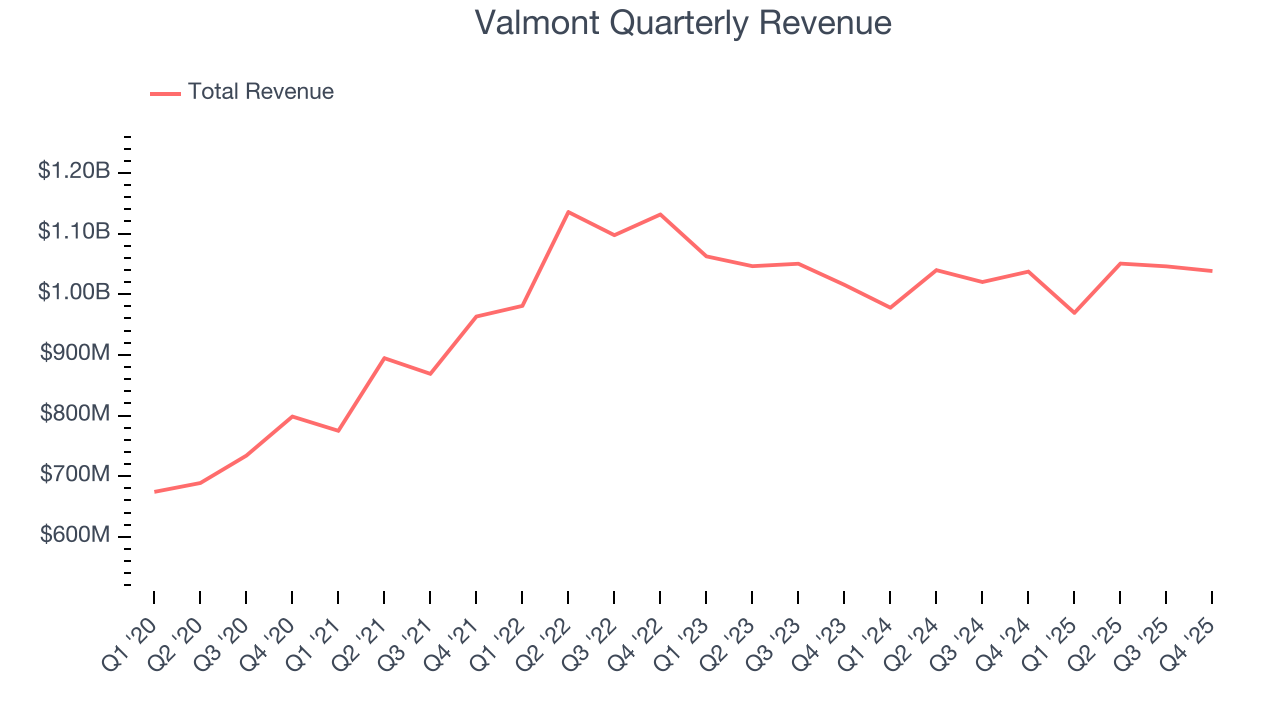
We at StockStory place the most emphasis on long-term growth, but within industrials, a half-decade historical view may miss cycles, industry trends, or a company capitalizing on catalysts such as a new contract win or a successful product line. Valmont’s recent performance shows its demand has slowed as its revenue was flat over the last two years. 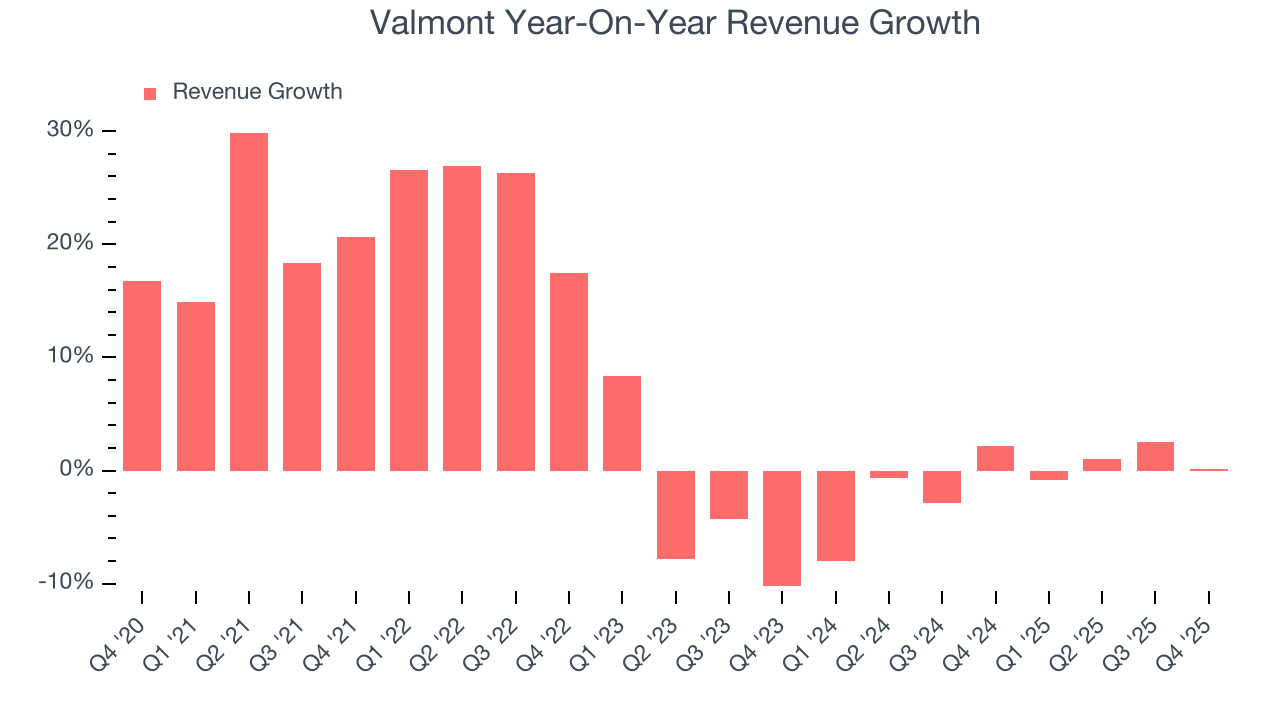
We can dig further into the company’s revenue dynamics by analyzing its backlog, or the value of its outstanding orders that have not yet been executed or delivered. Valmont’s backlog reached $1.65 billion in the latest quarter and averaged 15.1% year-on-year growth over the last two years. Because this number is better than its revenue growth, we can see the company accumulated more orders than it could fulfill and deferred revenue to the future. This could imply elevated demand for Valmont’s products and services but raises concerns about capacity constraints. 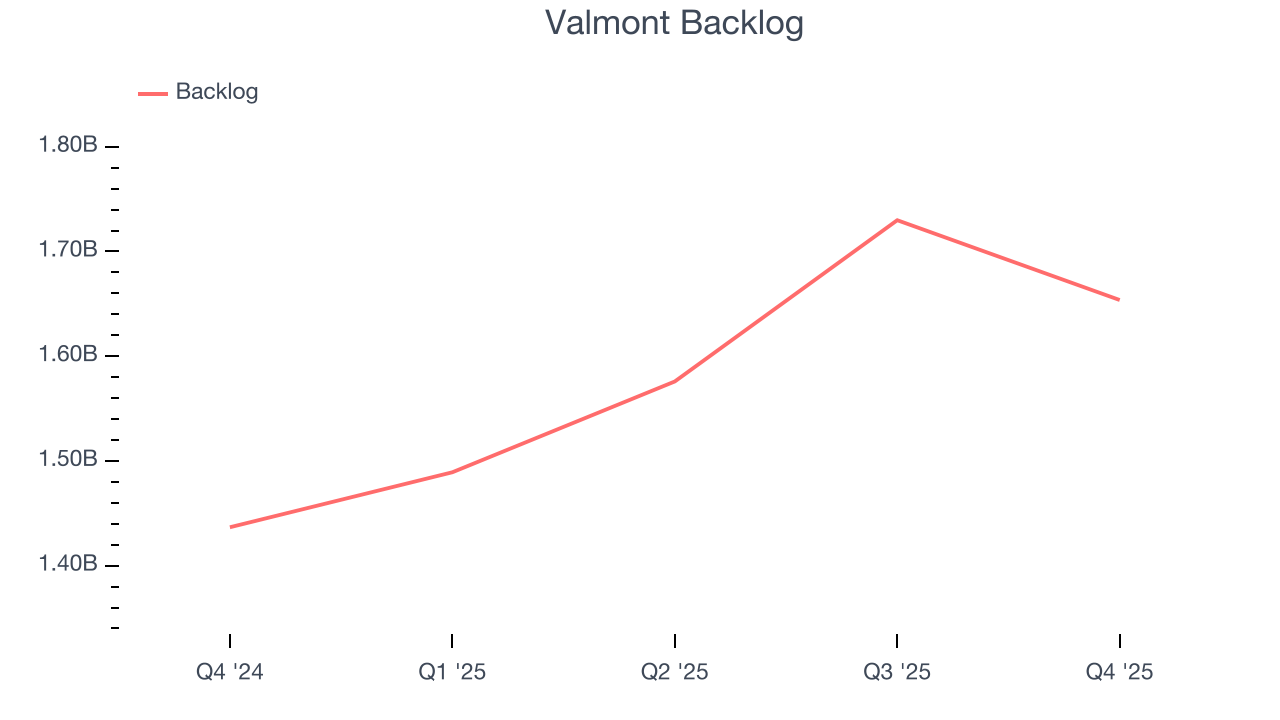
This quarter, Valmont’s $1.04 billion of revenue was flat year on year, falling short of Wall Street’s estimates.
Looking ahead, sell-side analysts expect revenue to grow 4% over the next 12 months. Although this projection indicates its newer products and services will fuel better top-line performance, it is still below average for the sector.
6. Gross Margin & Pricing Power
Cost of sales for an industrials business is usually comprised of the direct labor, raw materials, and supplies needed to offer a product or service. These costs can be impacted by inflation and supply chain dynamics.
Valmont’s gross margin is slightly below the average industrials company, giving it less room to invest in areas such as research and development. As you can see below, it averaged a 28.5% gross margin over the last five years. Said differently, Valmont had to pay a chunky $71.54 to its suppliers for every $100 in revenue. 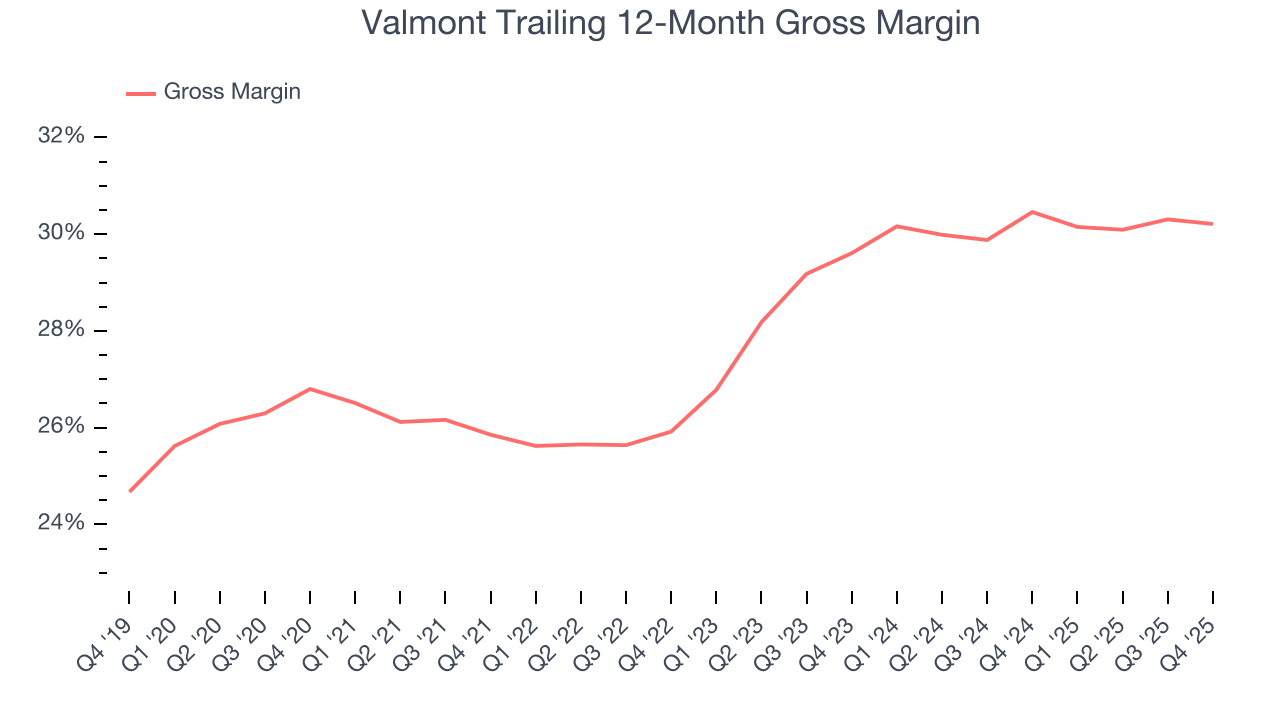
This quarter, Valmont’s gross profit margin was 29.8%, in line with the same quarter last year. Zooming out, the company’s full-year margin has remained steady over the past 12 months, suggesting its input costs (such as raw materials and manufacturing expenses) have been stable and it isn’t under pressure to lower prices.
7. Operating Margin
Operating margin is an important measure of profitability as it shows the portion of revenue left after accounting for all core expenses – everything from the cost of goods sold to advertising and wages. It’s also useful for comparing profitability across companies with different levels of debt and tax rates because it excludes interest and taxes.
Valmont has done a decent job managing its cost base over the last five years. The company has produced an average operating margin of 9.7%, higher than the broader industrials sector.
Looking at the trend in its profitability, Valmont’s operating margin rose by 1.9 percentage points over the last five years, as its sales growth gave it operating leverage.
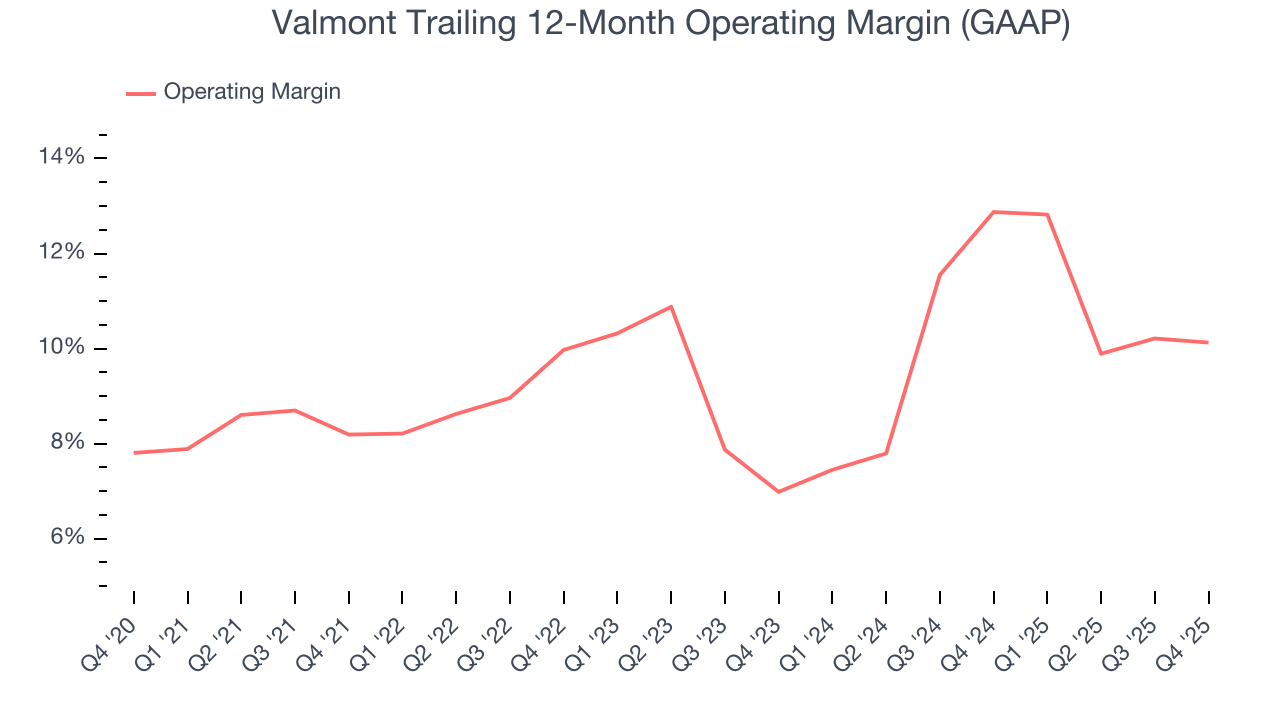
In Q4, Valmont generated an operating margin profit margin of 11.2%, in line with the same quarter last year. This indicates the company’s cost structure has recently been stable.
8. Earnings Per Share
Revenue trends explain a company’s historical growth, but the long-term change in earnings per share (EPS) points to the profitability of that growth – for example, a company could inflate its sales through excessive spending on advertising and promotions.
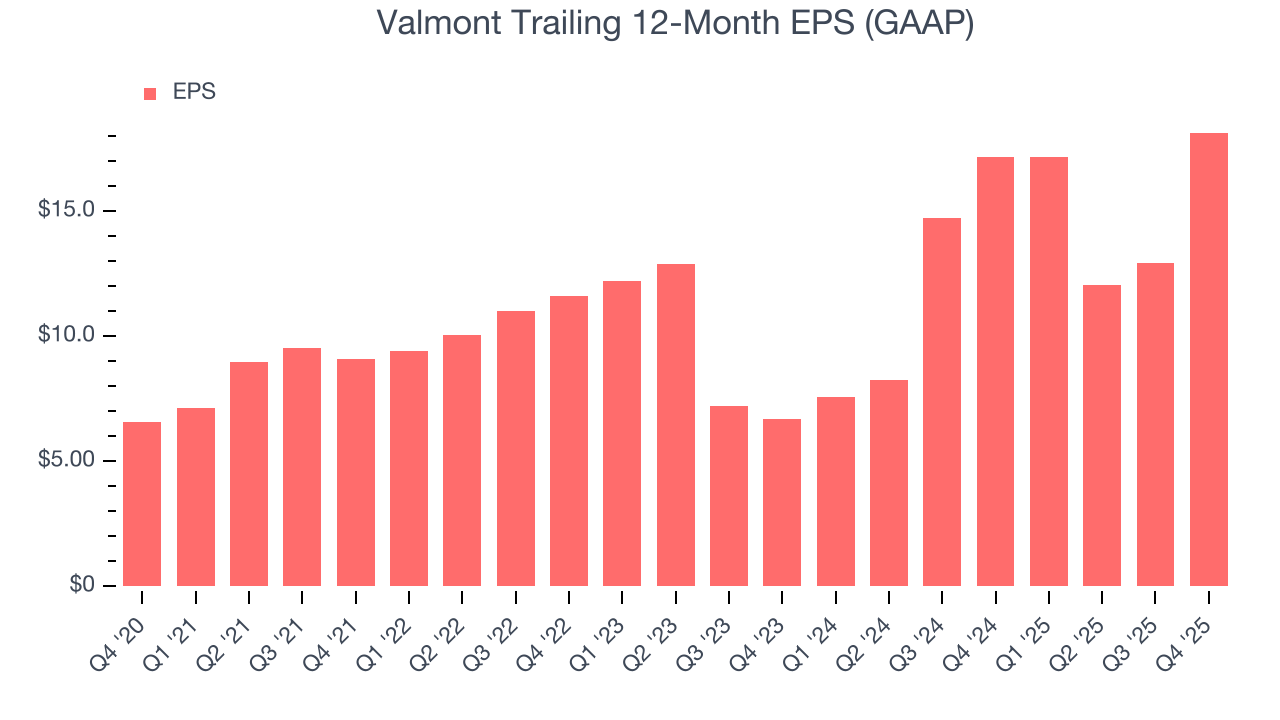
Valmont’s EPS grew at an astounding 22.6% compounded annual growth rate over the last five years, higher than its 7.2% annualized revenue growth. This tells us the company became more profitable on a per-share basis as it expanded.
Diving into Valmont’s quality of earnings can give us a better understanding of its performance. As we mentioned earlier, Valmont’s operating margin was flat this quarter but expanded by 1.9 percentage points over the last five years. On top of that, its share count shrank by 7.5%. These are positive signs for shareholders because improving profitability and share buybacks turbocharge EPS growth relative to revenue growth. 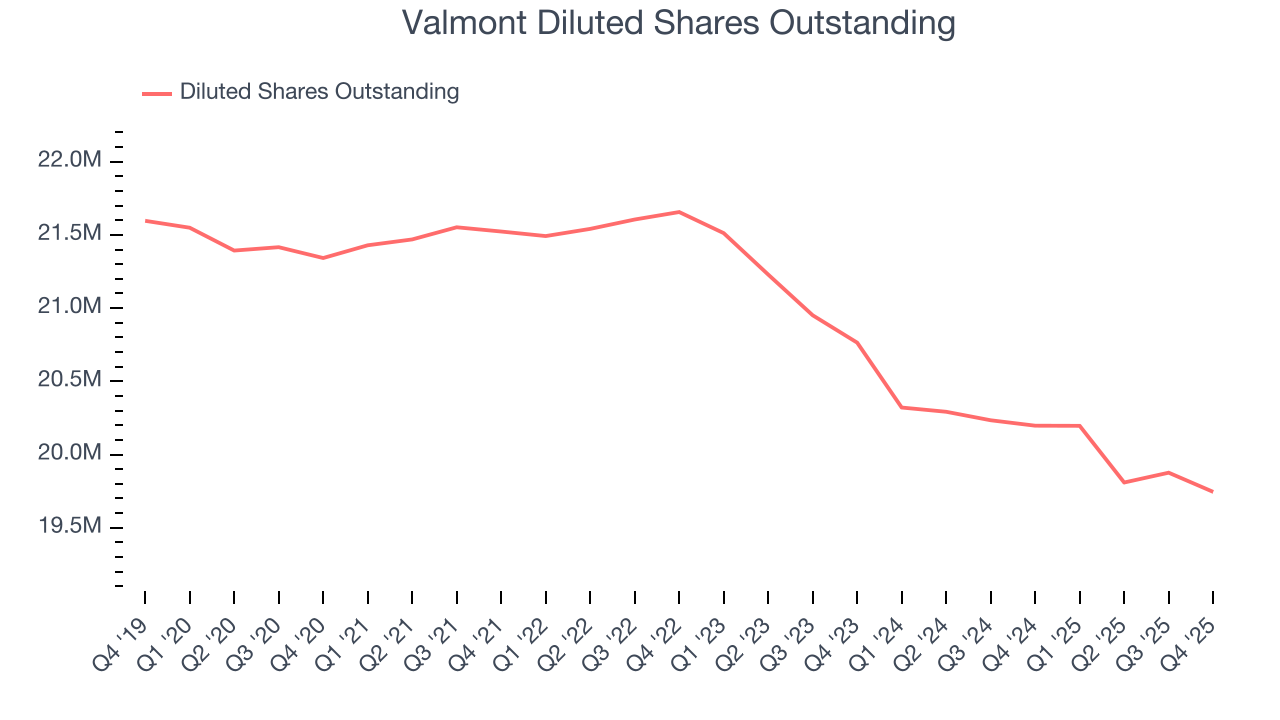
Like with revenue, we analyze EPS over a more recent period because it can provide insight into an emerging theme or development for the business.
For Valmont, its two-year annual EPS growth of 64.4% was higher than its five-year trend. We love it when earnings growth accelerates, especially when it accelerates off an already high base.
In Q4, Valmont reported EPS of $9.05, up from $3.84 in the same quarter last year. This print easily cleared analysts’ estimates, and shareholders should be content with the results. Over the next 12 months, Wall Street expects Valmont’s full-year EPS of $18.15 to grow 16.9%.
9. Cash Is King
If you’ve followed StockStory for a while, you know we emphasize free cash flow. Why, you ask? We believe that in the end, cash is king, and you can’t use accounting profits to pay the bills.
Valmont has shown mediocre cash profitability over the last five years, giving the company limited opportunities to return capital to shareholders. Its free cash flow margin averaged 6%, subpar for an industrials business.
Taking a step back, an encouraging sign is that Valmont’s margin expanded by 8.8 percentage points during that time. The company’s improvement shows it’s heading in the right direction, and we can see it became a less capital-intensive business because its free cash flow profitability rose more than its operating profitability.
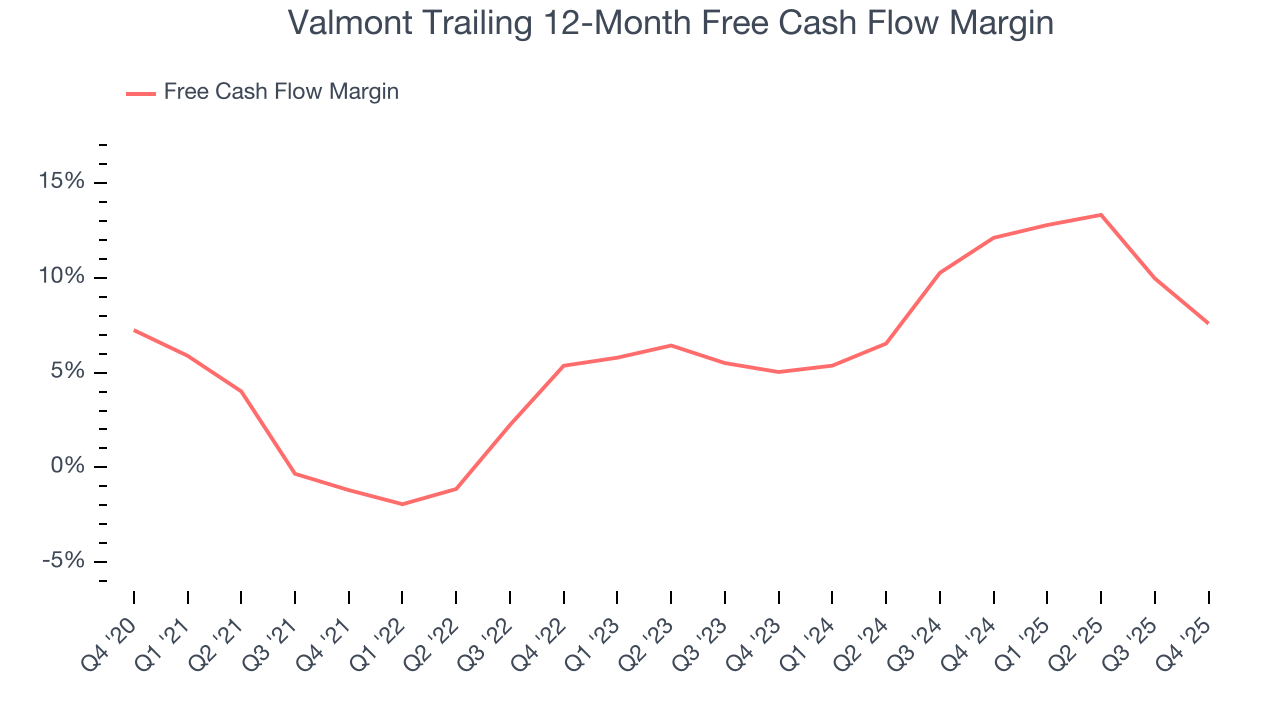
Valmont’s free cash flow clocked in at $70.44 million in Q4, equivalent to a 6.8% margin. The company’s cash profitability regressed as it was 9.4 percentage points lower than in the same quarter last year, but we wouldn’t read too much into the short term because investment needs can be seasonal, causing temporary swings. Long-term trends trump fluctuations.
10. Return on Invested Capital (ROIC)
EPS and free cash flow tell us whether a company was profitable while growing its revenue. But was it capital-efficient? Enter ROIC, a metric showing how much operating profit a company generates relative to the money it has raised (debt and equity).
Although Valmont hasn’t been the highest-quality company lately, it historically found a few growth initiatives that worked. Its five-year average ROIC was 13.3%, higher than most industrials businesses.
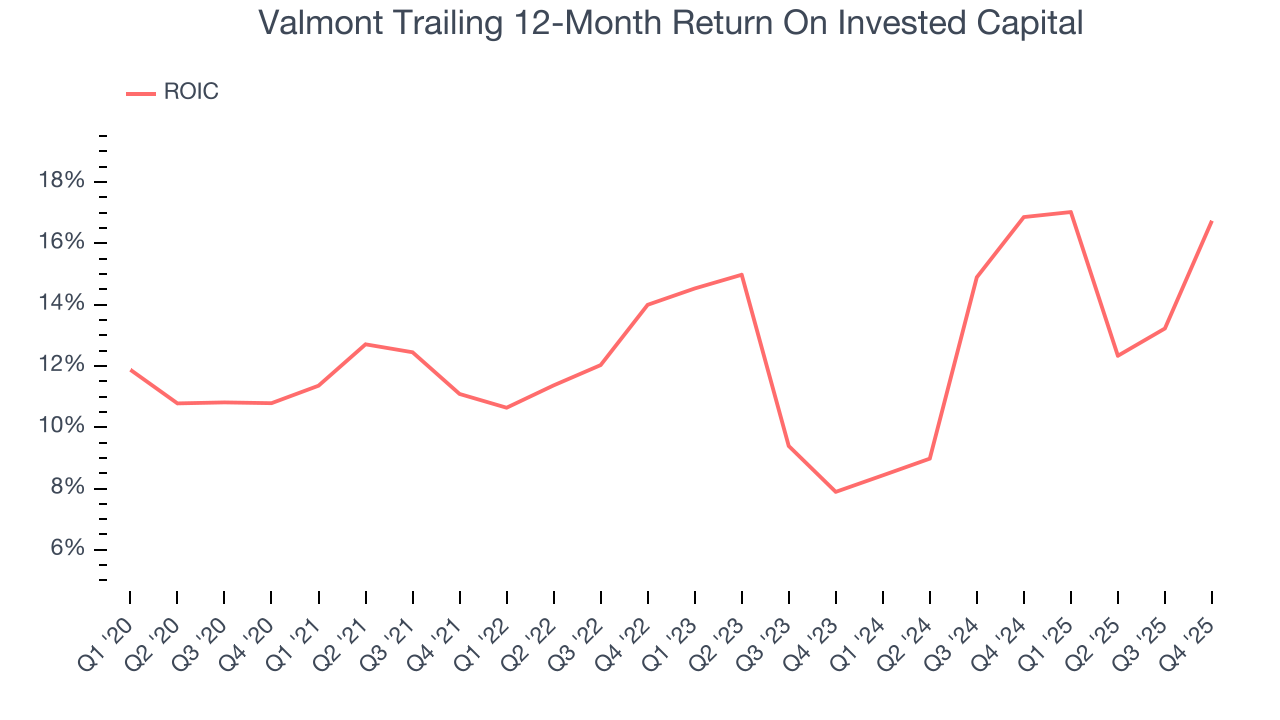
We like to invest in businesses with high returns, but the trend in a company’s ROIC is what often surprises the market and moves the stock price. Fortunately, Valmont’s ROIC averaged 4.3 percentage point increases each year over the last few years. This is a good sign, and if its returns keep rising, there’s a chance it could evolve into an investable business.
11. Balance Sheet Assessment
Valmont reported $187.1 million of cash and $925.7 million of debt on its balance sheet in the most recent quarter. As investors in high-quality companies, we primarily focus on two things: 1) that a company’s debt level isn’t too high and 2) that its interest payments are not excessively burdening the business.
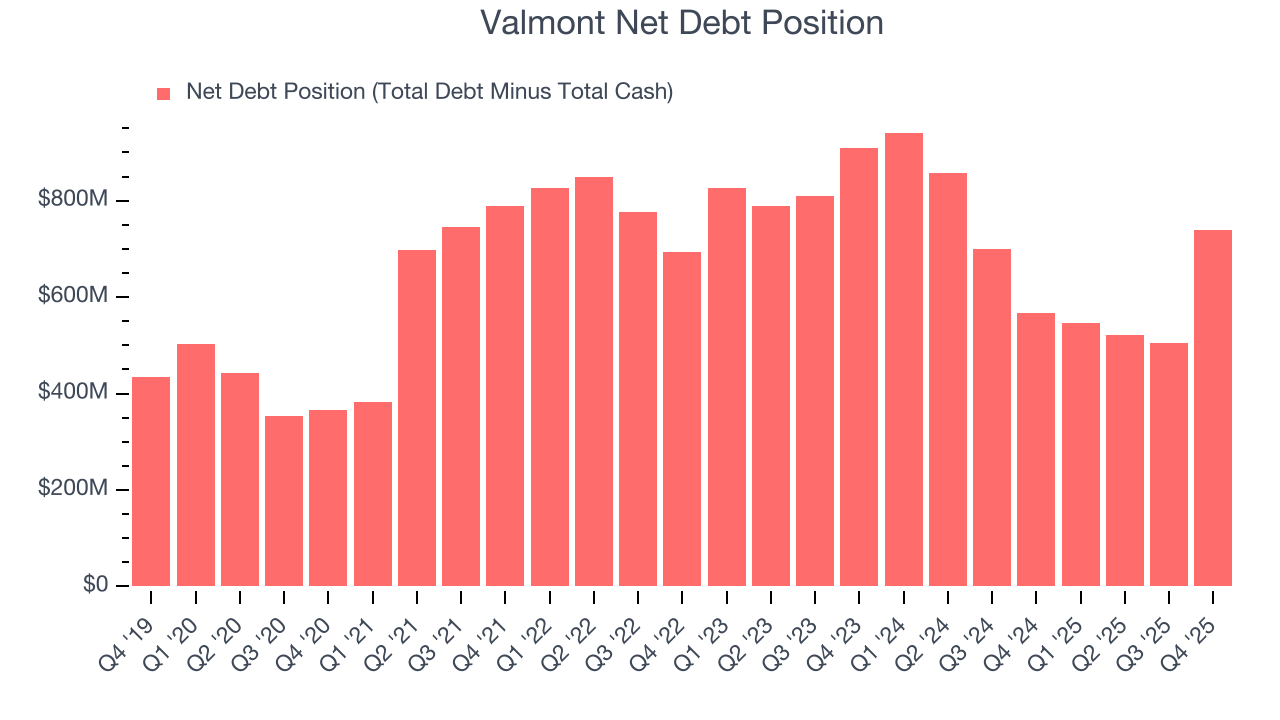
With $1.12 billion of EBITDA over the last 12 months, we view Valmont’s 0.7× net-debt-to-EBITDA ratio as safe. We also see its $15.34 million of annual interest expenses as appropriate. The company’s profits give it plenty of breathing room, allowing it to continue investing in growth initiatives.
12. Key Takeaways from Valmont’s Q4 Results
It was good to see Valmont beat analysts’ EPS expectations this quarter. We were also excited its EBITDA outperformed Wall Street’s estimates by a wide margin. On the other hand, its revenue slightly missed. Zooming out, we think this was a good print with some key areas of upside. Investors were likely hoping for more, and shares traded down 3.1% to $459.62 immediately after reporting.
13. Is Now The Time To Buy Valmont?
Updated: February 17, 2026 at 7:30 AM EST
When considering an investment in Valmont, investors should account for its valuation and business qualities as well as what’s happened in the latest quarter.
Valmont is a fine business. Although its revenue growth was mediocre over the last five years and analysts expect growth to slow over the next 12 months, its backlog growth has been marvelous. And while its gross margins are lower than its industrials peers, its rising cash profitability gives it more optionality.
Valmont’s P/E ratio based on the next 12 months is 22.4x. Investors with a higher risk tolerance might like the company, but we don’t really see a big opportunity at the moment. We're fairly confident there are better investments elsewhere.
Wall Street analysts have a consensus one-year price target of $459.25 on the company (compared to the current share price of $459.62).